Mariana Teixeira da Trindade*, Hérida Regina Nunes Salgado
Department of Pharmaceutics, School of Pharmaceutical Sciences, Universidade Estadual Paulista, Araraquara, SP, Brazil
Abstract
This paper proposed the validation of a modern and useful analytical method for the quantification of ceftriaxone sodium in powder for injection, using Fourier-transform infrared (FT-IR) transmission spectroscopy. This technique has great advantage because it does not use organic solventes and it is in accordance with the International Conference on Harmonisation guidelines (ICH), contributing to the reduction of the generation of waste of organic solvents by the industry and minimizing the impact of its activities on the environment. The method was quantified by measuring the absorbance of the band corresponding to the carbonyl present in the drug molecule, in the region between 1800 and 1700 cm-1, showing to be linear, accurate, precise, selective and robust. It was linear over the concentration range of 0.4-1.2 mg with correlation coefficient of 0.9983 and limits of detection and quantification of 0.016 and 0.049 mg, respectively. The validated method is able to quantify ceftriaxone sodium powder for injection preparation, it is an environmentally-friendly and low cost method and can be applied in the routine quality control of the pharmaceutical industry.Keywords
Ceftriaxone sodium, Validation, Infrared, Quantitative, Green Method1. Introduction
Since 1970 cephalosporins are among the most potent and widely used anti-infective agentes [1]. Ceftriaxone sodium (Figure 1) is a semi-synthetic antibiotic belonging to the class of the third generation cephalosporins. It is administered only by the parenteral route and has the capacity to overcome the blood-brain barrier [2-4].
It has bactericidal action; its main activity is related to the Gram-negative bacteria, being also able to act against Gram-negative bacilli resistant to the first and second generations cephalosporins [1, 4, 6, 7].
It is indicated in cases of septicemia, meningitis, disseminated Lyme borreliosis (early and late stages of the disease) (Lyme disease), intra-abdominal infections (peritonitis, gastrointestinal and biliary tract infections), bone, joint, soft tissue, skin and wound infections, infections in immunocompromised patients, kidney and urinary tract infections, infections of the respiratory tract, particularly pneumonia and otolaryngological infections, genital infections, including gonorrhea, perioperative prophylaxis of
* Corresponding author:
[email protected] (Mariana Teixeira da Trindade) Published online at http://journal.sapub.org/pc
Copyright © 2017 Scientific & Academic Publishing. All Rights Reserved
infections [8-10].
There are several analytical methods for the quantification of ceftriaxone sodium, such as high performance liquid chromatography [5, 11-17]; ultra performance liquid chromatography [18, 19]; UV absorption spectroscopy [2, 20-23] and spectrofluorimetry [24]. Most of the proposed methods involve the use of organic solvents and buffer solutions, which contribute to the generation of these residues by the pharmaceutical industry.
The concern with a reduction of toxic solvents, as well as buffer solutions in order to reduce the impacts of their activities on the environment, is a tendency to be acquired by pharmaceutical industries. Therefore, it is necessary to develop innovative and environmentally-friendly methods [25-34].
Infrared spectroscopy is a relevant technique when the intention is to contribute to the environment, as it does not use toxic solvents, which allows the quantification through the measurements of the absorbances corresponding to a selected group present in the molecule [26, 30-33].
Figure 1. Chemical structure of ceftriaxone disodium hemieptahydrate (CAS 104376-79-6) [5]
Table 1. Preparation of pellets for the test of recovery of infrared spectroscopy method for ceftriaxone sodium
Ceftrixone sodium sample (mg) (dilution
1:10, w/w in KBr)
Ceftriaxone sodium RCS (mg) (dilution
1:10, w/w in KBr) %
Final theoretical concentration
(mg/pellets)
KBr amount (mg)
Sample 4.0 --- 0.4 146.0
R1 4.0 2.4 80 0.64 143.6
R2 4.0 4.0 100 0.80 142.0
R3 4.0 5.6 120 0.96 140.4
Standard --- 4.0 0.4 146.0
2. Material and Methods
2.1. Chemicals
The chemicals used were ceftriaxone sodium reference chemical substance (RCS) (assigned purity 99.6%) and ceftriaxone sodium in powder for injection, each flask contains 1.193 g of ceftriaxone sodium, equivalent to 1.0 g of ceftriaxone, it has no excipients, this was kindly donated by the pharmaceutical company ABL Antibióticos do Brasil® (Cosmópolis, SP, Brazil).
The potassium bromide (KBr) (Neon® , Brazil) was of analytical grade and was used for the preparation of pellets. Before use, the KBr was ground and dried at 120°C until constant weight.
2.2. Instrumentation and Analytical Conditions
2.2.1. Equipments
The FT-IR spectrometer (Shimadzu® , Kyoto, Japan, IR Prestige-21 model) was used and the spectral region was consisted of 4000 - 500 cm-1 at intervals of 2 cm-1. After obtaining the IR spectrum and with the assistance of the IR Solution software, quantitative analysis was carried out in the spectral region between 1800 and 1700 cm-1, related to a carbonyl band of the ceftriaxone sodium molecule, and this band had its height analyzed in terms of absorbance.
2.2.2. Obtaining the Analytical Curve
Equivalent amounts of 0.4, 0.6, 0.8, 1.0 and 1.2 mg of ceftriaxone sodium RCS were previously diluted in KBr (1:10 w/w) and after diluted in KBr again to obtain sufficient
quantities of 150 mg of pellets. The powders were mixed until a homogeneous mixture was obtained, this mixture was submitted to mechanical pressing for 10 minutes to obtain translucent pellets.
2.2.3. Preparation of Ceftriaxone Sodium RCS Pellets
Aliquots of powder equivalent to 0.8 mg of ceftriaxone sodium RCS (8.0 mg diluting 1:10 in KBr) were properly homogeinized in 142 mg potassium bromide, to form pellets of 150 mg. The determinations of the substance were performed in triplicate absorbance.
2.2.4. Preparation of Ceftriaxone Sodium Sample Pellets
The contents of twenty vials of ceftriaxone sodium in powder for injection solution were mixed. From this mixture, amounts of 0.8 mg of ceftrixone sodium (8.0 mg of the 1:10 dilution in potassium bromide) were taken and well homogenized with 142 mg of potassium bromide, comprising the total pellet weight of 150 mg. The determinations were performed in triplicate.
2.3. Method Validation
The method was validated following ICH specifications showing accuracy, linearity, precision, robustness, selectivity, detection limit and quantitation limit.
2.3.1. Selectivity
analysis was by ANOVA. The method was performed on three different days.
2.3.3. Accuracy
Accuracy was attained by the recovery assay, to which was added a known amount of standard in known quantity of sample [35]. The method was performed at three different levels (R1, R2, R3), being prepared in triplicate on three different days. Table 1 shows the preparation of the pellets for the recovery test method.
2.3.4. Precision
Precision was evaluated respecting both repeatability (intraday) and intermediate precision (interdays). The intraday precision was evaluated by the preparation and the analyses of six pellets ceftriaxone sodium at a concentration of 0.8 mg/150 mg on the same day and at about the same working conditions. Intermediate precision (among analysts) was assessed by performing the assay for a second analyst under the same experimental conditions. Six replicates at a concentration of 0.8 mg/150 mg were prepared and assayed. At the end of testing, the standard deviations of the measurements were calculated.
2.3.5. Robustness
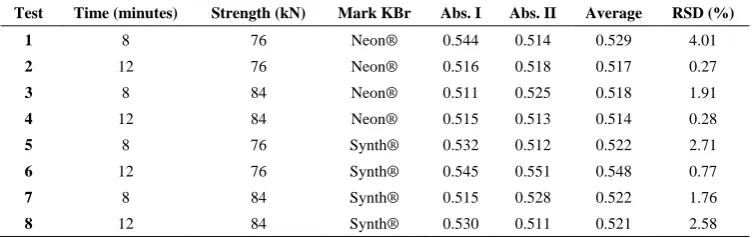
The robustness of the method was evaluated with the purpose of showing the reliability of the analysis concerning small variations in its working parameters, that is, the validity of the method is maintained even with small variations in its working conditions. The following parameters were varied: compression of the pellets time two minutes down and above the usual working time compression; compressive strength, ranging four kN down and above the usual working compression and potassium bromide trade mark. The obtained responses were evaluated according to factorial design 23 and Table 3 shows the parameters of the evaluation of the robustness by factorial design 23 of the analytical method for ceftriaxone sodium analysis.
2.3.6. Detection and Quantitation Limits
The detection (LOD) and quantification (LOQ) limits were calculated based on the intercept standard deviation and the curve slope [35]. Three different curves were performed to obtain the data necessary to calculate. The values were
Quality Control ensures the safety and efficacy of pharmaceutical products. The validation of analytical and bioanalytical methods is indispensable in the process of good manufacturing practices.
The search for methods with low environmental impact is a tendency to be applied in routine analysis in the pharmaceutical industry, the replacement of analytical methods that employ organic solvents for others that do not employ them are viable alternatives for this objective [36].
Infrared spectroscopy is an excellent alternative because it does not use organic solvents, requires minimal or no pre-treatment of the sample and it is a suitable technique for drugs with solubility problems, once they can be prepared in the form of pellets [25-34].
Therefore the quantification of ceftriaxone sodium samples is very important for conducting pharmacokinetic studies, bioavailability, bioequivalence and consequently for the therapeutic monitoring of this substance. In this paper, a single reagent was chosen in order to obtain a low cost, simple and environmentally friendly infrared spectroscopy method for quantification of this medicine.
The method can be quantified by measuring the absorbance of the band corresponding to the carbonyl present in the drug molecule, in the region between 1800 and 1700 cm-1, this band is specific and useful in the determination of ceftriaxone sodium in powder for injection, the values of these bands/peaks were provided in absorbance presenting accuracy, linearity, precision, robustness and selectivity.
3.1. Selectivity
Figure 2. Overlap absorption spectra in the infrared region ceftriaxone sodium RCS and powder for injection with the band used for quantification
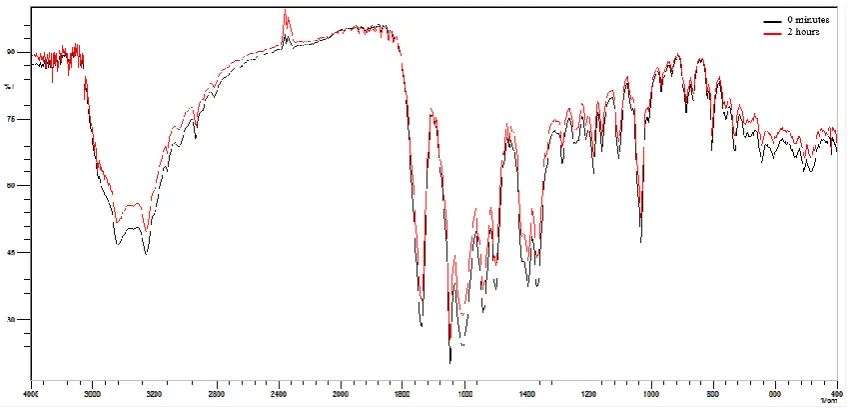
Figure 3. Overlap absorption spectra in the infrared region of the photolytic degradation of ceftriaxone sodium at times zero and 3 hours
3.3. Precision
The precision of the method was evaluated by parameters: intra-day or repeatability, inter-days or intermediate (among analysts). The results were expressed by the relative standard deviation (R.S.D.).
Table 2. Determination of precision for test-F and t-test between analysts
of spectroscopy method in the infrared region
Test-F: Two samples for variance
Test-t: Two samples assuming equal variances
Fcal2.53 < 6.39 Fcrit tcal0.78 < 2.23 tcrit Pvalue 0.20 > 0.05 Pvalue0.45 > 0.05
The repeatability showed provided the R.S.D. value of 2.64%. Intermediate precision was demonstrated on different
4), it is noticed that the changes did not present significant interference in the proposed method, where all values (p-value) are greater than (0,05), showing the appropriate robustness of the method.
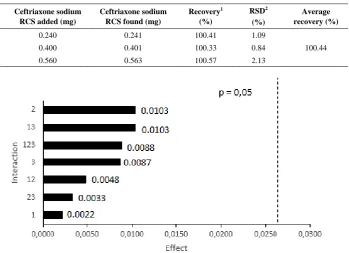
The Pareto graph (Figure 6) shows the effects values in order to evaluate the possible interactions between factors. From the data presented it is possible to verify that there were no statistically significant interactions for one (p- value) of 0.05, therefore, none of the altered factors interfered significantly in the quantification of the medicine. Although the demonstration of robustness of the method was adequate for the analysis, it is important to note that the factor 2 represented by the compressive force and the combination of factors 1 and 3 represented by the compression time and Kbr mark presented greater variations in the results.
Figure 5. Graphical representation of the calibration curve of ceftriaxone sodium by spectroscopy method in the infrared region
Table 3. Parameters of the robustness evaluation by factorial design 23 of the analytical method for ceftriaxone sodium analysis by spectroscopy in the
infrared region
Test Time (minutes) Strength (kN) Mark KBr Abs. I Abs. II Average RSD (%)
1 8 76 Neon® 0.544 0.514 0.529 4.01
2 12 76 Neon® 0.516 0.518 0.517 0.27
3 8 84 Neon® 0.511 0.525 0.518 1.91
4 12 84 Neon® 0.515 0.513 0.514 0.28
5 8 76 Synth® 0.532 0.512 0.522 2.71
6 12 76 Synth® 0.545 0.551 0.548 0.77
7 8 84 Synth® 0.515 0.528 0.522 1.76
Table 4. Analysis of variance for robustness spectroscopy in the infrared region
Source of variation df SS SA F F critical value-P
Factor 1 1 0.00002 0.00002 0.1565 5.3177 0.7026 Factor 2 1 0.00044 0.00044 3.4087 5.3177 0.1019 Factor 3 1 0.00029 0.00029 0.6975 5.3177 0.4277 Factor interaction 1 and 2 1 0.00009 0.00009 2.2338 5.3177 0.1732 Factor interaction 1 and 3 1 0.00042 0.00042 3.2483 5.3177 0.1090 Factor interaction 2 and 3 1 0.00005 0.00005 0.3787 5.3177 0.5552 Factor interaction 1, 2 and 3 1 0.00031 0.00031 2.3672 5.3177 0.1623 Treatments 7 0.00162 0.00023 1.7844 3.5005 0.2173
Residue 8 0.00103 0.00013 - - -
Factor 1 = time of compression (minute) / factor 2 = Strength (kN) / Factor 3= mark KBr df= degrees of freedom / SS= Sum of Squares/ SA= square average / F= test statistic
Table 5. Determination of the accuracy of the analytical method for analysis of ceftriaxone sodium by spectroscopy in the infrared region
Ceftriaxone sodium RCS added (mg)
Ceftriaxone sodium RCS found (mg)
Recovery1
(%)
RSD2
(%)
Average recovery (%)
R1 0.240 0.241 100.41 1.09
R2 0.400 0.401 100.33 0.84 100.44
R3 0.560 0.563 100.57 2.13
Figure 6. Pareto graph of the interactions of the robustness variable for the spectroscopy method in the infrared region
3.5. Accuracy
The accuracy of the method is in accordance with fixed limits of 98.0 to 102.0%, as shown in table 5, indicating the adequacy of the method developed in the quantification of the ceftriaxone sodium in powder for injection.
3.6. Detection and Quantitation Limits
The value found for the detection limit was 0.016 mg and the quantitation limit was 0.049 mg. These values indicate the reliability of the method for the determination and quantification of ceftriaxone sodium in powder for injection.
4. Conclusions
The method presented for the quantification of ceftriaxone in powder for injection presented linearity, selectivity, precision, accuracy, robustness and adequate limits of
detection and quantification in concentrations ranging from 0.4 to 1.2 mg. The proposed method used only one reagent with minimum procedures of sample preparation, encouraging its application in the routine analysis and contributing to minimize the environmental impact of pharmaceutical industries. Therefore, the validated method is an acceptable alternative method for quality control and can be easily applied in the routine analysis of ceftriaxone sodium.
ACKNOWLEDGMENTS
pharmaceutical formulations. Spectrochimica Acta Part A: Molecular and Biomolecular Spectroscopy, v.60, n.12, p. 2831-2835, 2004.
[3] GUIMARAES, D. O.; MOMESSO, L. S.; PUPO, M. T. Antibiotics therapeutic importance and prospects for the discovery and development of new agents. New Chemistry, v.33, n.3, p. 667-679, 2010.
[4] MANFIO, M. L.; AGARRAYUA, D. A.; MACHADO, J. C.; SCHMIDT, C. A. A fully validated microbiological assay to evaluate the potency of ceftriaxone sodium. Brazilian Journal of Pharmaceutical Sciences, v.49, n.4, p. 753-762, 2013.
[5] BP. BRITISH Pharmacopoeia. London: Her Majesty’s Stationary Office, 2012.
[6] ALI, S. M.; ELBASHIR, A. A.; ABOUL-ENEIN, H. Y. Spectroscopic methods for analysis of cephalosporins in pharmaceutical formulations. World Journal of Analytical Chemistry, v.3, n.1A, p. 21-32, 2015.
[7] LOURENÇ O, F. R.; TRAPLE, M. A.; OKAMOTO, R. T.; PINTO, T. J. A. Development and validation of microbiological assay for ceftriaxone and its application in photo-stability study. Current Pharmaceutical Analysis, v.9, n.1, p. 77-81, 2013.
[8] BRAYFIELD, A. Martindale: The complete drug reference. 38 ed. Pharmaceutical Press: London, United Kingdom, 2014.
[9] BPR. Guide of medicines. Escala: São Paulo, Brazil, 2014. [10] BRAZIL. National Health Surveillance Agency (ANVISA).
Rocefin® http://www.anvisa.gov.br/datavisa/fila_bula. Accessed January 11, 2017.
[11] EL-ADL, S. M.; EL-SHANAWANY, A. A.; ABDEL-AZIZ, L. M.; HASSAN, A. F. HPLC Determination of three cephalosporins (cefepime, cefotriaxone and cefotaxime) in their bulk and dosage forms. Asian Journal of Pharmaceutical Analysis, v.4, n.3, p. 91-97, 2014.
[12] EP. EUROPEAN Pharmacopoeia. 8 ed., Council of Europe, 2013.
[13] JP. JAPANESE Pharmacopoeia. 16th ed. Tokyo, Society of Japanese Pharmacopoeia, 2011.
[14] KALE, R. S.; JAIN, H. K.; PRASHANT, D. G.; MHASKE, G. S.; PURI, M. V.; RAUT, M. D.; PATIL, H. S. An RPHPLC method for simultaneous estimation of ceftriaxone sodium and sulbactam sodium in parenteral dosage form. International Journal of Pharmacy and Pharmaceutical Sciences, v.3, n.5, p. 406-409, 2011.
[15] PORTUGUESE Pharmacopoeia. 7. ed. Lisboa: Infarmed,
[19] ETHIRAJ, R.; THIRUVENGADAM, E.; SAMPATH, V. S.; VAHIG, A.; RAJ, J. Development and validation of stability indicating spectroscopic method for content analysis of ceftriaxone sodium in pharmaceuticals. International Scholarly Research Notices, 2014.
[20] ETHIRAJ, R.; THIRUVENGADAM, E.; SAMPATH, V. S.; VAHIG, A.; RAJ, J. Development and validation of stability indicating spectroscopic method for content analysis of ceftriaxone sodium in pharmaceuticals. International Scholarly Research Notices, 2014.
[21] PASHA, C.; NARAYANA, B. A simple method for the spectrophotometric determination of cephalosporins in pharmaceuticals using variamine blue. Eclética Química, v.33, n.2, p. 41-46, 2008.
[22] RAGEH, A. H.; EL-SHABOURY, S. R.; SALEH, G. A.; MOHAMED, F. A. Spectrophotometric method for determination of certain cephalosporins using 4-chloro-7-nitrobenzo-2-oxa-1, 3-diazole (NBD-Cl). Natural Science, v.2, n.8, p. 828-840, 2010.
[23] SALEH, G. A.; ASKAL, H. F.; DARWISH, I. A.; EL-SHORBAGI, A. A. Spectroscopic analytical study for the charge-transfer complexation of certain cephalosporins with chloranilic acid. Analytical Sciences, v.19, n.2, p. 281-287, 2003.
[24] SHAH, J.; JAN, M. R.; SHAH, S.; INAYATULLAH. Development and validation of a spectrofluorimetric method for the quantification of ceftriaxone in pharmaceutical formulations and plasma. The Journal of Biological and Chemical Luminescence, v.28, n.4, p. 516-522, 2013. [25] CONSORTTI, L. P.; SALGADO, H. R. N. Green method for
quantification of sodium cefotaxime in lyophilized powder by infrared spectroscopy. Journal of Pharmaceutical Sciences & Emerging Drugs, v.5, n.1, 2015.
[26] CORRÊ A, J.C.R.; SALGADO, H.R.N. A platform fordesigning quantitative infrared spectrophotometric methodfor drugs and pharmaceuticals analysis: a rediscover for anecological and safer technique in the routine quality control laboratories. World Journal of Pharmacy and Pharmaceutical Sciences, v.3, n.6, p.2056-2059, 2014. [27] KOGAWA, A.C.; SALGADO, H.R.N. Development and
validation of infrared spectroscopy method for the determination of darunavir in tabets. Physical Chemistry, v.3, n.1, p.1-6, 2013.
Pharmacy and Pharmaceutical Sciences, v.3, n.6, p.283-297, 2014.
[29] KOGAWA, A.C.; MELLO, N. P.; SALGADO, H.R.N. Quantification of doxycycline in raw material by na eco-friendly method of infrared spectroscopy. Pharmaceutica Analytica Acta, v.7, n.2, p.463-466, 2016.
[30] MARCO, B. A.; SALGADO, H. R. N. Development and Validation of an Innovative Method for the Determination of Cefadroxil Monohydrate in Capsules. Physical Chemistry, v.6, n.6, p.67-74, 2016.
[31] MORENO, A. H.; SALGADO, H. R. N. Development and validation of quantitative analysis of ceftazidime in poder for injection by infrared spectroscopy. Physical Chemistry, v.2, n.1, p.6-11, 2012.
[32] NATORI, J. S. H.; TÓ TOLI, E. G.; SALGADO, H. R. N. Development and validation of a green analytical method for the determination of norfloxacin in raw material by FTIR spectrophotometry. Journal of AOAC International, v.99, n.6, p.1533-1536, 2016.
[33] TÓ TOLI, E.G.; SALGADO, H.R.N. Development and validation of the quantitative analysis of ampicillin sodium in powder for injection by Fourier-transform infrared spectroscopy (FT-IR). Physical Chemistry, v.2, n.6, p.103-108, 2012.
[34] VIEIRA, D.C.M.; RICARTE, P.C.; SALGADO, H.R.N. Development and validation of the quantitative analysis of cefuroxime sodium in powder for injection by infrared spectroscopy. Advances in Analytical Chemistry, v.2, n.6, p.80-87, 2012.
[35] ICH - International Harmonised Tripartite Guideline. Validation of analytical procedures: text and methodology Q2 (R1). Commission of the European Communities. Geneva, 2005.
![Figure 1. Chemical structure of ceftriaxone disodium hemieptahydrate (CAS 104376-79-6) [5]](https://thumb-us.123doks.com/thumbv2/123dok_us/8695304.1737013/2.595.93.516.250.351/figure-chemical-structure-ceftriaxone-disodium-hemieptahydrate-cas.webp)