Supplementary Material for:
Phenotypic and Molecular Characterization of the Claudin-low Intrinsic Subtype of Breast Cancer
Aleix Prat, Joel S. Parker, Olga Karginova, Cheng Fan, Chad Livasy, Jason I. Herschkowitz, Xiaping He and Charles M. Perou*
*To whom correspondence should be addressed. E-mail: [email protected]
This PDF file includes:
Table S1. Biological processes and signaling pathways enriched in Claudin-low vs. Basal-like tumors.
Table S2. Biological processes and signaling pathways enriched in Claudin-low tumors vs. rest.
Table S3. Identification of the Claudin-low subtype in a panel of breast cancer cell lines.
Table S4. Histological examination of Claudin-low tumors.
Table S5. Evaluation of the intrinsic breast cancer molecular subtypes in histologically diverse types.
Figure Legends
Fig. S1. Intrinsic unsupervised hierarchical clustering of the UNC337 database.
Fig. S2. Average expression of additional selected genes and gene signatures across the breast cancer subtypes.
Fig. S3. E-Cadherin and Claudin 3 immunohistochemical staining of breast tumors.
Fig. S4. Intrinsic gene set analysis of 52 breast cancer cell lines.
Fig. S5. Claudin-low tumor and Normal Breast predictions in 52 breast cancer cell lines.
Fig. S6. Average expression of genes and gene signatures across the various mouse classes.
Fig. S7. Differentiation predictions in Raouf et al. database.
Fig. S8. Expression of the 9-Cell Line Claudin-low predictor across different subpopulations of the normal breast.
Fig. S9. Mean expression of the top highly expressed and low expressed genes in Claudin-low cell lines across 337 human breast tumor samples.
Fig. S10. Localization of five H/E Claudin-low samples in the UNC337 intrinsic clustering.
Table S1. Biological Processes (BP) and Signaling Pathways Enriched in Claudin-low vs Basal-like Tumors*
Upregulated (1,190 genes)
GO BP Terms Count
EASE
score KEGG Pathway Terms Count
EASE score
Response to wounding 96 3.14E-28 Hematopoietic cell lineage 27 3.69E-08
Inflammatory response 70 9.14E-22 Cell adhesion molecules (CAMs) 32 6.71E-07
Cell communication 363 2.84E-14 Natural killer cell mediated cytotoxicity 27 1.64E-04
Developmental process 299 1.79E-13 Leukocyte transendothelial migration 25 2.21E-04
Cell adhesion 87 1.20E-07
T cell differentiation 14 8.51E-06
B cell mediated immunity 16 1.15E-06
Downregulated (526 genes)
GO BP Terms Count
EASE
score KEGG Pathway Terms Count
EASE score
Cell cycle phase 55 4.70E-26 Cell Cycle 20 4.57E-10
Mitotic cell cycle 47 2.00E-21 p53 signaling pathway 9 7.95E-04
Spindle organization and biogenesis 11 2.12E-11 Tight junction 11 0.005
*Gene lists were selected after perfoming SAM (FDR 0%) between Claudin-low tumors as defined by SigClust versus Basal-like tumors. Selected Gene Ontology (GO) and Kyoto Encyclopedia of Genes and Genomes (KEGG) pathway terms with p-values of < 0.001 and <0.05, respectively, are shown here. The complete GO BP terms, genes and p-p-values are found in Supplemental Data.
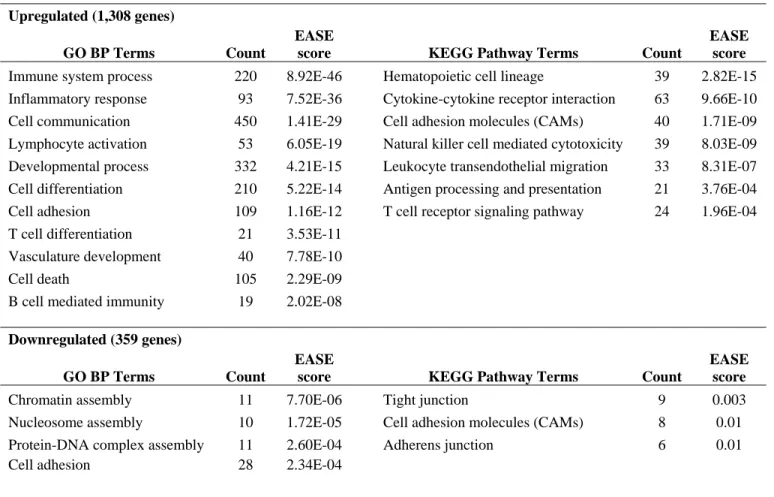
Table S2. Biological Processes (BP) and Signaling Pathways Enriched in Claudin-low Tumors*
Upregulated (1,308 genes)
GO BP Terms Count
EASE
score KEGG Pathway Terms Count
EASE score
Immune system process 220 8.92E-46 Hematopoietic cell lineage 39 2.82E-15
Inflammatory response 93 7.52E-36 Cytokine-cytokine receptor interaction 63 9.66E-10
Cell communication 450 1.41E-29 Cell adhesion molecules (CAMs) 40 1.71E-09
Lymphocyte activation 53 6.05E-19 Natural killer cell mediated cytotoxicity 39 8.03E-09
Developmental process 332 4.21E-15 Leukocyte transendothelial migration 33 8.31E-07
Cell differentiation 210 5.22E-14 Antigen processing and presentation 21 3.76E-04
Cell adhesion 109 1.16E-12 T cell receptor signaling pathway 24 1.96E-04
T cell differentiation 21 3.53E-11
Vasculature development 40 7.78E-10
Cell death 105 2.29E-09
B cell mediated immunity 19 2.02E-08
Downregulated (359 genes)
GO BP Terms Count
EASE
score KEGG Pathway Terms Count
EASE score
Chromatin assembly 11 7.70E-06 Tight junction 9 0.003
Nucleosome assembly 10 1.72E-05 Cell adhesion molecules (CAMs) 8 0.01
Protein-DNA complex assembly 11 2.60E-04 Adherens junction 6 0.01
Cell adhesion 28 2.34E-04
*Gene lists were selected after perfoming SAM (FDR 0%) between Claudin-low tumors as defined by SigClust versus the rest. Selected Gene Ontology (GO) and Kyoto Encyclopedia of Genes and Genomes (KEGG) pathway terms with p-values of < 0.001 and <0.05, respectively, are shown here. The complete GO BP terms, genes and p-values are found in Supplemental Data.
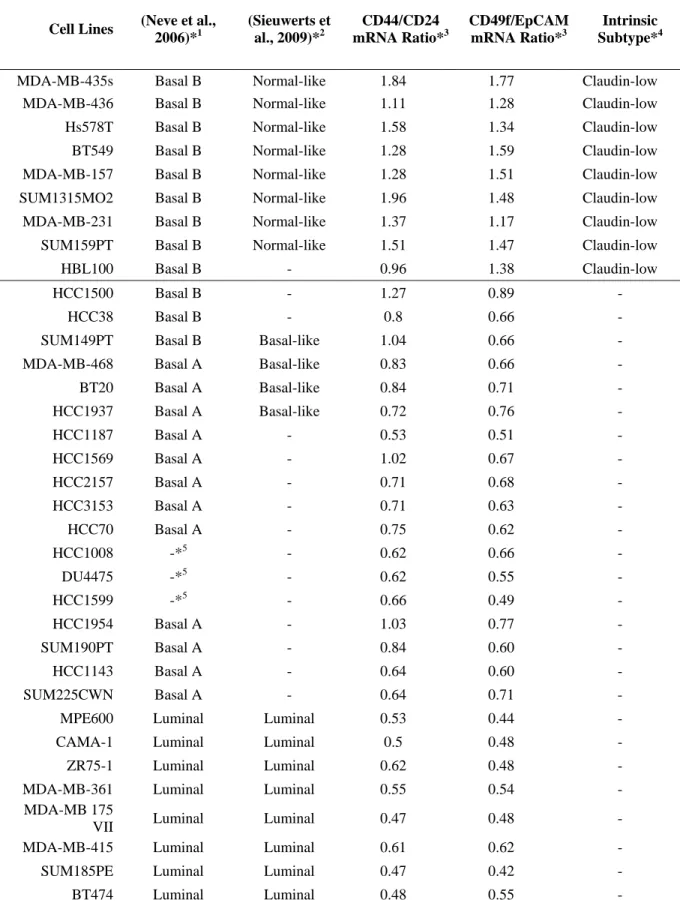
Table S3. Identification of the Claudin-low Subtype in a Panel of Breast Cancer Cell Lines
Cell Lines (Neve et al., 2006)*1 (Sieuwerts et al., 2009)*2 CD44/CD24 mRNA Ratio*3 CD49f/EpCAM mRNA Ratio*3 Intrinsic Subtype*4
MDA-MB-435s Basal B Normal-like 1.84 1.77 Claudin-low
MDA-MB-436 Basal B Normal-like 1.11 1.28 Claudin-low
Hs578T Basal B Normal-like 1.58 1.34 Claudin-low
BT549 Basal B Normal-like 1.28 1.59 Claudin-low
MDA-MB-157 Basal B Normal-like 1.28 1.51 Claudin-low
SUM1315MO2 Basal B Normal-like 1.96 1.48 Claudin-low
MDA-MB-231 Basal B Normal-like 1.37 1.17 Claudin-low
SUM159PT Basal B Normal-like 1.51 1.47 Claudin-low
HBL100 Basal B - 0.96 1.38 Claudin-low
HCC1500 Basal B - 1.27 0.89 -
HCC38 Basal B - 0.8 0.66 -
SUM149PT Basal B Basal-like 1.04 0.66 -
MDA-MB-468 Basal A Basal-like 0.83 0.66 -
BT20 Basal A Basal-like 0.84 0.71 - HCC1937 Basal A Basal-like 0.72 0.76 - HCC1187 Basal A - 0.53 0.51 - HCC1569 Basal A - 1.02 0.67 - HCC2157 Basal A - 0.71 0.68 - HCC3153 Basal A - 0.71 0.63 - HCC70 Basal A - 0.75 0.62 - HCC1008 -*5 - 0.62 0.66 - DU4475 -*5 - 0.62 0.55 - HCC1599 -*5 - 0.66 0.49 - HCC1954 Basal A - 1.03 0.77 - SUM190PT Basal A - 0.84 0.60 - HCC1143 Basal A - 0.64 0.60 - SUM225CWN Basal A - 0.64 0.71 -
MPE600 Luminal Luminal 0.53 0.44 -
CAMA-1 Luminal Luminal 0.5 0.48 -
ZR75-1 Luminal Luminal 0.62 0.48 -
MDA-MB-361 Luminal Luminal 0.55 0.54 -
MDA-MB 175
VII Luminal Luminal 0.47 0.48 -
MDA-MB-415 Luminal Luminal 0.61 0.62 -
SUM185PE Luminal Luminal 0.47 0.42 -
MCF-7 Luminal Luminal 0.58 0.45 - HCC1007 Luminal - 0.56 0.37 - HCC1428 Luminal - 0.7 0.48 - HCC202 Luminal - 0.54 0.50 - LY2 Luminal - 0.62 0.38 - SUM44PE Luminal - 0.67 0.60 - SUM52PE Luminal - 0.51 0.56 - SK-BR-3 Luminal Her2+ 0.49 0.42 - UACC812 Luminal - 0.51 0.63 - ZR7530 Luminal - 0.62 0.49 - ZR75B Luminal - 0.46 0.47 - MDA-MB-134 VI Luminal Luminal 0.56 0.60 - T47D Luminal Luminal 0.55 0.52 -
MDA-MB-453 Luminal Her2+ 0.41 0.64 -
AU565 Luminal - 0.5 0.46 - BT483 Luminal - 0.5 0.49 - HCC2185 Luminal - 0.43 0.46 - EVSA-T - Her2+ - MDA-MB-330 - Her2+ - UACC893 - Her2+ - SK-BR-7 - Normal-like - SK-BR-5 - Luminal - OCUB-F - Luminal - SUM229PE - Basal-like -
*1, Subtype calls of the different breast cancer cell lines were identified in Neve et al. (1) by performing an
unsupervised hierarchical clustering of 1,438 probes which showed substantial variation across the data (4
measurements that varied by more than Log2 1.89). *2, Subtype calls of the different breast cancer cell lines
were derived in Sieuwerts et al. (2) using the intrinsic list of Perou et al. (3). *3, mRNA ratios were derived
from the array data of Neve et al. (1). *4, The Claudin-low subtype classification was based on unsupervised
hierarchical clustering using the intrinsic list of Parker et al. (4) and the node identified in fig. S4. *5, Breast
Table S4. Histological Examination of Claudin-low Tumors in UNC337*
Sample Histology Review Tumor
Border Lymphoid Infiltration Necrosis ER Status Node Status Grade Tumor
size PAM50 call
1 Ductal I P P 0 1 3 2 HER2-enriched 2 Ductal I A A 0 1 3 NA NBL 3 Ductal I A P 0 0 3 NA NBL 4 Ductal I A A 1 1 3 2 NBL 5 Ductal I A A 1 1 2 4 NBL 6 Ductal Pu A A NA NA NA NA BL 7 Ductal I P P 0 0 2 1 BL 8 Ductal I A A 0 0 3 1 NBL 9 Ductal I A A 1 1 3 4 NBL 10 Ductal I A A 1 0 3 2 NBL 11 Ductal I A P 0 0 3 4 NBL 12 Ductal in LN NA NA A NA 1 NA 1 LB 13 Ductal with MF Pu P P 0 0 NA 1 NBL
14 Ductal with MF Pu P P 0 1 3 2 HER2-enriched
15 Ductal with MF Pu P A 0 0 3 1 BL 16 Ductal with MF Pu P A 0 1 3 2 BL 17 Ductal with MF Pu P A 0 0 3 2 BL 18 Metaplastic Pu A P 0 0 3 2 BL 19 Metaplastic*1 NA NA NA 0 0 NA 2 BL 20 Metaplastic*1 NA NA NA 0 0 3 2 BL 21 Metaplastic*1 NA NA NA 0 0 3 4 NBL 22 Metaplastic*1 NA NA NA 0 0 3 2 BL 23 Metaplastic*1 NA NA NA 0 1 3 4 BL 24 Metaplastic*1 NA NA NA 0 0 NA 2 BL 25 Metaplastic*1 NA NA NA 0 0 3 2 BL 26 Metaplastic*1 NA NA NA 0 0 3 3 BL 27 Metaplastic in LN NA NA P NA 1 NA 1 NBL 28 Micropapillary I A A 0 0 3 2 NBL 29 Mixed Ductal/Lobular I A A 0 1 2 3 NBL
*Histological diagnoses are based on the WHO histological classification of tumors of the breast. Claudin-low tumors have been identified by the 9-Cell Line Claudin-low Predictor. LN, lymph node; MF, medullary features have been defined as the
presence of pushing margins and brisk tumor lymphocytic infiltration without meeting the criteria for being classified as
medullary carcinoma; Pu, pushing; I, infiltrative; P, present; A, absent; Tumor size (0, <2 cm; 1, 2-5 cm; 3, >5 cm), Node status (0, none; 1, ≥ 1 positive node), ER status (0, negative; 1, positive), Grade (1, low grade; 2, intermediate grade; 3, high grade);
NA, not available; BL, Basal-like; NBL, Normal Breast-like; LB, Luminal B. *1, tumors whose histological diagnosis was only
Table S5. Evaluation of the Intrinsic Breast Cancer Molecular Subtypes in Histologically Diverse Types.
Claudin-low Basal-like HER2-enriched Luminal B Luminal A
Normal Breast-like Metaplastic 8 (57%) 11 (46%) - - - 1 (17%) Medullary 2 (14%) 8 (33%) - - - - ILC 2 (9%) 1 (4%) 5 (50%) 3 (17%) 8 (21%) 3 (50%) Tubular 1 (7.1%) - - - 7 (18%) 1 (17%) Adenocystic - 4 (17%) - - - - Apocrine - - 3 (30%) 1 (6%) 2 (5%) - Neuroendocrine - - - 2 (11%) 7 (18%) 1 (17%) IDC with OGC* - - - 4 (22%) 1 (3%) - Micropapillary - - 2 (20%) 3 (17%) 3 (8%) - Mucinous A 1 (7.1%) - - 3 (17%) 6 (15%) - Mucinous B - - - 2 (11%) 7 (18%) -
Figure Legends
Figure S1. Intrinsic unsupervised hierarchical clustering of the UNC337 database. Average-linkage hierarchical clustering of genes and arrays was performed using the intrinsic gene list from Parker et al. (4) on the 320 breast tumors and 17 normal breast tissue samples (UNC337). Claudin-low breast cancer intrinsic molecular subtype was defined by SigClust (5) (Yellow color array tree node, P < 0.0001). Approximate localization of characteristic gene clusters is shown on the right side of the figure. Gene symbols of important Claudin-low gene clusters are also shown. The Treeview files of this clustering can be obtained in the UMD UNC
https://genome.unc.edu/ website.
Figure S2. Average expression of additional selected genes and gene signatures (6-9) across the intrinsic breast cancer subtypes including the Claudin-low group defined by SigClust (5) and the Normal Breast-like group. P-values shown here have been calculated by comparing gene expression means across all subtypes.
Figure S3. E-Cadherin (CDH1) and Claudin 3 (CLDN3) immunohistochemical staining of 103 breast tumors, including 22 Claudin-low samples identified by SigClust (5). (A) Light microscopic picture examples (20X) of negative/weak and moderate/strong positive staining for CDH1 and CLDN3 in two Claudin-low, one Luminal B and one Basal-like tumor samples. (B) Tables summarizing the IHC scores and the statistics.
Figure S4. Intrinsic gene set analysis of 52 breast cancer cell lines. (A) The intrinsic list of Parker et al. (4) was used to hierarchically cluster 52 breast cancer cell lines from Neve et al. (1) Average-linkage clustering was performed on genes and arrays. In the tree, the yellow node denotes the Claudin-low cell lines (cluster correlation ~59%). The Treeview files of this clustering can be obtained in the UMD UNC https://genome.unc.edu/ website. (B) Expression of selected genes associated with luminal differentiation (KRT8, KRT5, KRT14, KRT19, ESR1, ERBB2), EMT (CDH1, CLDN3, CLDN4, CLDN7, VIM, TWIST1, SNAI1, SNAI2, ZEB1, ZEB2) and stem cell and/or TICs features (CD44, CD24, ALDH1A1, EPCAM) across the cell line database. (C) Table summarizing the cell lines selected for building the 9-Cell Line Claudin-low predictor. Among them, MDA-MB-435 cells have been shown to have melanoma characteristics (10), which is still a controversial topic (11).
Figure S5. Claudin-low tumor and Normal Breast predictions in 52 breast cancer cell lines (1). In order to build the Claudin-low tumor predictor, we first selected those genes that were significantly differentially expressed between Claudin-low tumors defined by SigClust (or cell lines) and all other subtypes using a two-class, unpaired SAM, with <5% FDR. Then we used these gene lists and built two centroids for Claudin-low vs. “others” and used these as our training data. For every sample, we calculated the euclidean distances to the two centroids, and defined each sample as Claudin-low if its nearest centroid was the Claudin-low centroid ([Distance to the “others” centroid] / [Distance to the Claudin-low centroid] ≥ 1.0). Distance weighted discrimination (DWD; (https://genome.unc.edu/pubsup/dwd/) was used to calculate the distance to each centroid. Using the same methodology, we also build a normal breast predictor by selecting those genes that were significantly differentially expressed between normal breast tissues and breast tumors using a two-class, unpaired SAM, with 0% FDR; note that these gene lists are also included in Supplemental Data.
Figure S6. Average expression of important genes and gene signatures across the various mouse classes (I-X) previously published (12). (A) Classical markers used to characterize breast tumors are shown for mRNA expression levels for: basal markers (keratins 5 [KRT5], 14 [KRT14] and 17 [KRT17]), luminal markers (keratins 18 [KRT18] and 19 [KRT19]), estrogen receptor (ESR1), progesterone receptor (PR), GATA3 and HER2 (ERBB2); to the right is shown a box-and-whisker plot for expression of the previously published luminal and proliferation gene signatures. (B) Markers of epithelial-to-mesenchymal transition (Vimentin [VIM], Snail-1 [SNAI1], Snail-2 [SNAI2], TWIST2, ZEB1, ZEB2, E-Cadherin [CDH1], and Claudins 3 [CLDN3], 4 [CLDN4] and 7 [CLDN7]), and to the right, expression of stromal- and immune-related signatures (7, 9, 13). (C) Markers of stem cells / cancer stem cells / epithelial differentiation (CD44, EPCAM, CD10, CD49f, CD29, CD133, MUC1, THY1, and ALDH1A1), and expression to the right, published CSC signatures (6, 8, 14). Each colored square on the left side panels represents the relative transcript abundance (in log 2 space) with highest expression being red, average expression being black, and lowest expression being green. Group I, Murine Normal breast samples; Group II, Claudin-low samples; Group III, DMBA/Wnt1; Group IV, BRCA1/p53/Wnt1; Group V, p53null/p53het IR; Group VI, MMTV-Neu/PyMT; Group VII, WAMyc; Group VIII, WAInt3; Group IX, WAPT121/WAPTag; Group X, TgC3(1)-Tag. P-values (Student’s t-test) shown here have been calculated by comparing gene expression means across all mouse classes. *, Statistical significant p-values (<0.05, Student’s t-test) obtained by comparing Group II (Claudin-low) vs. Group I (Murine Normal breast).
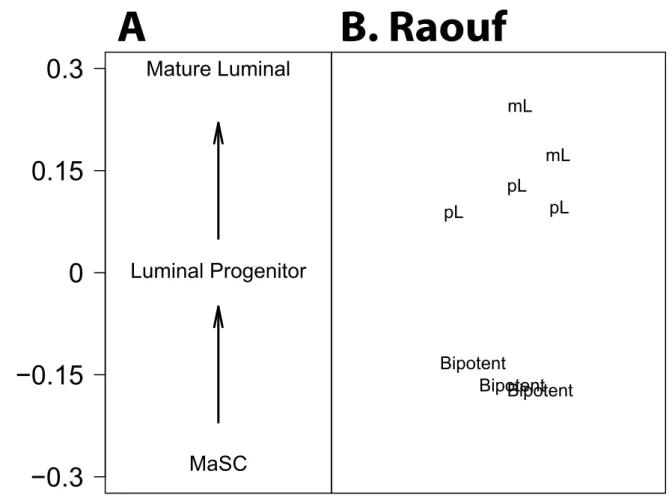
Figure S7. Differentiation predictions in Raouf et al. (15) bipotent progenitor subpopulation, luminal restricted progenitor subpopulation and mature luminal cell subpopulation. Note: an outlier mL subpopulation identified in Raouf et al. (15) (Diff Luminal-1) has been removed from this analysis. mL, mature luminal; pL, luminal progenitor.
Figure S8. Expression of the 9-Cell Line Claudin-low predictor across different subpopulations of the normal breast. (A) Lim et al. (16) subpopulations. (B) Raouf et al. (15) subpopulations. MaSC, mammary stem cell; mL, mature luminal; pL, luminal progenitor; Str, stromal; mM, mature myoepithelial. Yellow color bars denote those subpopulations identified as Claudin-low by the 9-Cell Line Claudin-low predictor. Note: an outlier mL subpopulation identified in Raouf et al. (15) (Diff Luminal-1) has been removed from this analysis.
Figure S9. Mean expression of the top highly expressed (n=833) and low expressed (n=642) genes in Claudin-low cell lines across 337 human breast tumor samples classified according to intrinsic subtype, including the Normal Breast-like group. Both gene lists were obtained by performing Significance Analysis Microarray (SAM) between Claudin-low breast cancer cell lines vs. the rest (FDR<5%). BL, Basal-like; CL, Claudin-low; H2, HER2-enriched; LA, Luminal A; LB, Luminal B; NBL, Normal Breast-like
Figure S10. Localization of five Claudin-low samples (BC00054, 020018B, BC00075, 010384B, and BC00083) in the UNC337 intrinsic clustering. The H/E (haematoxylin and eosin) slides of these five samples have been previously reported in Herschkowitz et al., Genome Biol 2007, Supplemental File 7. Red: the five Claudin-low samples; Yellow, the Claudin-low intrinsic cluster as defined by SigClust.
CLDN8 TSC22D1 MBNL2 PER2 MOSC1 APOD NFIA HRASLS3 PPP1R15A PEMT ACADVL LAMB3 ACTG2 COL17A1 DST CNN1 IL17B CSRP1 ACTC1 PTGER3 LARP6 DUSP6 KLF4 TGFBR2 MAOA RAPGEF3 DGAT2 AQP7 CES1 VWF TXNIP TSPAN7 MEOX1 AQP1 IGFBP6 EDNRB ITM2A ALDH1A1 GSN MFAP4 DPT PDK4 AOC3 CDO1 PPARG GPX3 FHL1 ITGA7 RBP4 LPL FABP4 CD36 EPAS1 ZEB2 MAF TFPI PPAP2B TSHZ2 KANK2 ADRA2A FOSB METTL7A MGLL C5orf4 TGFBR3 FAM13A1 PDGFRA FERMT2 PTPRM SOBP HOXA5 HOXA7 ABLIM1 ACSL1 WASF3 RGS5 LPHN2 CBLN4 SPG3A PTHLH AK5 FTO PBX1 TOM1L1 RBM35B SHROOM3 NEBL BSPRY ELF3 CLDN4 MAL2 ATAD4 CLDN7 SPINT2 RBM35A FXYD3 CGN OCLN CDH1 EPN3 CLDN3 TRPS1 MYO6 MB PRLR Claudins/ECadherin Gene Cluster Claudin-low/Normal Breast-like Gene Cluster Luminal Gene Cluster HER2 Gene Cluster Proliferation Gene Cluster Immune Gene Cluster RELB TLR7 LAPTM5 CTSS CASP1 ADAMDEC1 LYN CTSH FCRL5 IGLL1 IGJ TNFRSF17 CD38 TMEM149 CCDC88B IRF4 LIMD2 MS4A1 PLAC8 PRKCB1 LGALS2 LTB PDCD1 PTPN7 SIT1 CD3D P2RY10 DEF6 VAV1 STAT4 SMR3A CD4 LAX1 CD79A ADAM33 CSK PSMB10 CXCL9
Figure S1
Basal-like/Normal Breast-like Gene ClusterFigure S2
Mean Expression
Ki67 HIF1alpha Fibromatosis genes
Mean Expression
B_Cell genes Granulocytes genes T Lymphocyte genes
ALDH1A1 Mean Expression BL CL H2 LA LB NBL BL CL H2 LA LB NBL BL CL H2 LA LB NBL BL CL H2 LA LB NBL BL CL H2 LA LB NBL BL CL H2 LA LB NBL BL CL H2 LA LB NBL −0.2 0.0 0.2 0.4 0.6 p=1.23e−21 −0.4 −0.2 0.0 0.2 0.4 p=8.51e−25 −0.4 −0.2 0.0 0.2 0.4 0.6 0.8 p=1e−25 −1.0 −0.5 0.0 0.5 1.0 p=6.99e−10 −3 −2 −1 0 1 2 p=2.38e−34 −2 −1 0 1 2 3 p=6.67e−14 −3 −2 −1 0 1 2 3 p=2.9e−27 −2 0 2 4 6 p=8.9e−45 CD44/CD24 ratio BL CL H2 LA LB NBL −6 −4 −2 0 2 4 p=4.7e−16 CD49f/EpCAM ratio BL CL H2 LA LB NBL Basal Claudin
Her2 LumA LumB
Normal −1.0 −0.5 0.0 0.5 1.0 p=2.05e−29 Basal Claudin
Her2 LumA LumB
Normal
−0.5 0.0 0.5
p=2.22e−29
Stem Cell/TICs up genes MMS up genes Stem Cell/TICs down genes
Mean Expression
BL CL H2 LA LB NBL BL CL H2 LA LB NBL
Basal
Claudin Her2 LumA LumB Normal
−0.6 −0.4 −0.2 0.0 0.2 0.4 p=6.16e−71 BL CL H2 LA LB NBL
E-Cadherin (CDH1) and Claudin 3 (CLDN3) IHC Staining in 103 Breast Cancers. Subtype Samples with CDH1 Nega ve/Weak Posi ve Staining % Samples with CDH1 Moderate/Strong Posi ve Staining % Samples with CLDN3 Nega ve/Weak Posi ve Staining % Samples with CLDN3 Moderate/Strong Posi ve Staining % Total Samples Claudin-low 10 45% 12 55% 13 59% 9 41% 22 Basal-like 2 11% 17 89% 2 11% 17 89% 19 HER2-enriched 1 10% 9 90% 5 50% 5 50% 10 Luminal A 4 16% 21 84% 7 28% 18 72% 25 Luminal B 5 22% 18 78% 4 17% 19 83% 23 Normal Breast-like 0 0% 4 100% 0 0% 4 100% 4 Total 22 21% 81 79% 31 30% 72 70% 103
CDH1 Sta s cs (Chi-Square Test) P-value CLDN3 Sta s cs (Chi-Square Test) P-value
Claudin-low vs rest 0.0019 Claudin-low vs rest 0.0008
Claudin-low vs Basal-like 0.0142 Claudin-low vs Basal-like 0.0020
Figure S3
A
B
CDH1 IHC Staining / Claudin-low Sample CDH1 IHC Staining / Luminal B Sample
HCC1007 MDAMB453 MDAMB134 T47D SUM185PE SUM44PE HCC1428 BT483 UACC812 MDAMB361 BT474 ZR7530 MDAMB175 600MPE ZR75B ZR751 CAMA1 MCF7 LY2 HCC202 MDAMB415 SUM52PE SKBR3 AU565 HCC2185 HCC1500 MDAMB436 HBL100 MDAMB231 MDAMB157 SUM1315 BT549 SUM159PT HS578T MDAMB435 HCC38 DU4475 HCC1187 HCC1569 HCC2157 HCC1599 HCC1008 HCC1143 SUM190PT SUM149PT HCC1954 HCC70 MDAMB468 HCC1937 HCC3153 SUM225CWN BT20 CD44 CD24 ALDH1A1 EPCAM CDH1 CLDN3 CLDN4 CLDN7 VIM TWIST1 SNAI1 SNAI2 ZEB1 ZEB2 KRT8 KRT5 KRT14 KRT19 ESR1 ERBB2
Figure S4
C
3 2 0 -2 -3A
BT549
MDA-MB157
MDA-MB436
HBL100
MDA-MB231
SUM159PT
Hs578T
MDA-MB435
SUM1315
Claudin-low Breast Cancer Cell Lines
B
0.7 0.8 0.9 1.0 1.1 1.2
0.7
0.8
0.9
1.0
1.1
1.2
Normal Breast Predictions
Distance to Tumor centroid / Distance to Normal breast centroid
Claudin-low Predictions
Distance to Other subtypes / Distance to Claudin-low
600MPE AU565 BT20 BT474 BT483 BT549 CAMA1 DU4475 HBL100 HCC1007 HCC1008 HCC1143 HCC1187 HCC1428 HCC1500 HCC1569 HCC1599 HCC1937 HCC1954 HCC202 HCC2157 HCC2185 HCC3153 HCC38 HCC70 HS578T LY2 MCF7 MDAMB134 MDAMB157 MDAMB175 MDAMB231 MDAMB361 MDAMB415 MDAMB435 MDAMB436 MDAMB453 MDAMB468 SKBR3 SUM1315 SUM149PT SUM159PT SUM185PE SUM190PT SUM225CWN SUM44PE SUM52PE T47D UACC812 ZR751 ZR7530 ZR75B
UNC337 predictions on 52 Breast Cancer Cell Lines
Luminal Gene Cluster Proliferation Gene Cluster
West et al. (Stromal genes) (CD8 T-Lymphoid genes)Palmer et al.
Shipitsin et al. (Up genes)
Creighton et al. (Up genes)
Figure S6
Dontu et al. (Up genes)
Shipitsin et al. (Down genes)
Creighton et al. (Down genes)
A
B
C
-2 -1 0 1 2 Mean Expression Mean Expression Mean Expression A B C D E F G H I J −0.4 −0.2 0.0 0.2 p=4.24e−24 A B C D E F G H I J −1.5 −1.0 −0.5 0.0 0.5 1.0 p=4.02e−29 A B C D E F G H I J −0.4 −0.2 0.0 0.2 0.4 0.6 p=5.69e−25 A B C D E F G H I J −0.5 0.0 0.5 1.0 1.5 2.0 p=2.05e−16 A B C D E F G H I J −0.5 0.0 0.5 p=3.57e−26 A B C D E F G H I J −0.4 −0.2 0.0 0.2 0.4 0.6 p=1.31e−31 A B C D E F G H I J −0.4 −0.2 0.0 0.2 p=3.04e−23 Mean Expression A B C D E F G H I J −0.5 0.0 0.5 1.0 1.5 p=2.89e−29 A B C D E F G H I J −0.6 −0.4 −0.2 0.0 0.2 p=3.44e−36 A B C D E F G H I J A B C D E F G H I J A B C D E F G H I J A B C D E F G H I J A B C D E F G H I JI II* III IV V VI VII VIII IX X
Normal Breast (Group I) Claudin-low (Group II) DMBA/Wnt1 (Group III) BRCA1/p53/Wnt1 (Group IV) p53null/p53het IR (Group V) MMT
V-Neu/PyM
T (Group VI)
W
AP-Myc (Group VII)
W
AP-Int3 (Group VIII)
W
APT121/
W
AP
Tag (Group IX)
TgC3(1)-Tag (GRoup X)
Normal Breast (Group I) Claudin-low (Group II) DMBA/Wnt1 (Group III) BRCA1/p53/Wnt1 (Group IV) p53null/p53het IR (Group V) MMT
V-Neu/PyM
T (Group VI)
W
AP-Myc (Group VII)
W
AP-Int3 (Group VIII)
W
APT121/
W
AP
Tag (Group IX)
TgC3(1)-Tag (GRoup X)
Normal Breast (Group I) Claudin-low (Group II) DMBA/Wnt1 (Group III) BRCA1/p53/Wnt1 (Group IV) p53null/p53het IR (Group V) MMT
V-Neu/PyM
T (Group VI)
W
AP-Myc (Group VII)
W
AP-Int3 (Group VIII)
W
APT121/
W
AP
Tag (Group IX)
TgC3(1)-Tag (GRoup X) KRT5 KRT14 KRT18 KRT19 ESR1 PGR GATA3 ERBB2 CLDN3 CLDN4 CLDN7 CDH1 OCLN VIM SNAI1 SNAI2 TWIST2 ZEB1 ZEB2 CD44 EPCAM CD10 CD49f CD29 MUC1 THY1 ALDH1A1
I II* III IV V VI VII VIII IX X
I II III IV V VI VII VIII IX X I II III IV V VI VII VIII IX X
I II* III IV V VI VII VIII IX X I II III IV V VI VII VIII IX X
Figure S7
Dif
ferentiation Score
−0.3
−0.15
0
0.15
0.3
Mature Luminal
Luminal Progenitor
MaSC
pL Bipotent BipotentBipotent pL pL mL mLA
B. Raouf
Figure S8
A
B
MaSC mL pL Str Mean Expression −1.0 −0.5 0.0 0.5 1.0 Upregulated Genes MaSC mL pL Str Mean Expression −1.0 −0.5 0.0 0.5 1.0 Downregulated Genes9-Cell Line Claudin−low Predictor
Lim et al.
Bipotent mL mM pL Mean Expression −1.0 −0.5 0.0 0.5 1.0 Upregulated Genes Bipotent mL mM pL Mean Expression −1.0 −0.5 0.0 0.5 1.0 Downregulated GenesRaouf et al.
−0.8 −0.6 −0.4 −0.2 0.0 0.2 0.4 p=9.98e−61 −0.4 −0.2 0.0 0.2 0.4 0.6 p=2.09e−33
Claudin-low Cell Lines
Upregulated genes
in 337 human breast samples
Claudin-low Cell Lines
in 337 human breast samples
Downregulated genes
BL CL H2 LA LB NBL
Mean Expression Mean Expression
BL CL H2 LA LB NBL
UNC337 Intrinsic Clustering as shown in Figure S1.
Yellow array cluster: Claudin-low cluster as defined by SigClust.
Red: the 5 Claudin-low H/E samples from Herschkowitz et al. Genome Biol 2007 (Supplemental Figure 7)
UNC-000279B UNC-010509B MDACC-Meta16 9830-030267B
UNC04-0574B-44K
PB232
UNC-010208B MDACC-Meta8 UNC-030370B UNC-040011B
UNC00-0552B-44K 9830-030597B BC00054 UNC-020157B-core UB-94 BC00075_Repeat1 PB341 BC00037
UNC-030183B UNC-030528B UNC-030065B 9830-010384B
UB28 9830-020018B PB244T PB155-LN-Met PB342 BC00083 MDACC-Meta5 MDACC-Meta7 9830-020416B BC00033-T