Abstract— Construction industries are facing challenges day by day. Amidst all these challenges it is very crucial to improve the performance of a project with respect to Schedule and Cost. Earned Value Analysis is an important tool in analyzing the performance of any construction project. It measures the project progress and helps in identifying the critical activities thereby bringing the project on schedule. This paper shows the Earned Value Analysis done on a real time project in Kerala, using Microsoft Office Project. The analysis helped in identifying the critical areas. It ensured that the project is on time and within the budget.
Index Terms— Progress, Earned Value Analysis.
I. INTRODUCTION
Construction industry is one of the important sectors in India and is met with challenges day by day. The industry contributes to the growth of our economy to a large extent. One of the main problems that the industry faces is project delay. This can be caused due to various reasons like deviation from the initial plan, scarcity of resources, poor planning, poor execution, natural calamities etc. This causes the project to go over the expected budget and fails to complete within the scheduled time. The construction itself becomes costlier. Hence it is important that there is a systematic and scientific approach to project management to ensure that the project is completed within the constraints of time and resources.
EV analysis is an important tool to measure the performance of a project. It is a program management technique that uses “work in progress” to indicate what will happen to the work in future.It compares the actual work performed against a baseline plan. In this way, the analysis helps in setting a standard for performance evaluation and controls the time and cost constraints. It also helps in identifying the critical activities which maybe noted down and taken care of during further progress of the project.
The importance of EV is because it not only focuses on planned expenditure and actual cost but also identifies future opportunities and analyses actual performance. The project managers can keep track of the possible areas that are prone to
risk. They can create plans accordingly. In short, EV
Manuscript received April , 2015.
Sandhya Suresh, Department of Civil Engineering, SRM University Chennai, India,
Ganapathy Ramasamy N, Department of Civil Engineering, SRM University Chennai, India,
analysis takes care of problems through timely corrective action before they become too great to overcome.
II. TERMINOLOGIES
There are mainly three terms which identifies Earned Value Technique:
Budgeted Cost of Work Scheduled (BCWS) or Planned Value (PV)
Budgeted Cost of Work Performed (BCWP) or Earned Value (EV)
Actual Cost of Work Performed (ACWP) or Actual Cost (AC)
A. PLANNED VALUE
The planned value is that portion of the approved total cost estimate which is planned to be spent on an activity during a given period.
PV = Physical Work + Approved Budget
B. ACTUAL COST
Actual cost (AC), also called actual cost of work performed (ACWP), is the total of direct and indirect costs incurred in accomplishing work on an activity during a given period.
C. EARNED VALUE
The earned value (EV), also called the budgeted cost of work performed (BCWP), is an approximation of the value of the physical work actually completed. It relates the original planned costs for the project or activity and the rate at which the team is completing work on the project or activity to date.
From the above terms, following parameters are defined. Estimate At Completion
Budget At Completion Schedule Performance Index Cost Performance Index Schedule Variance Cost Variance D. ESTIMATE AT COMPLETION
The Estimate at Completion (EAC) is the sum of actual cost in current till date and the estimated cost for the remaining work.
EAC = Actual Cost (AC) + Estimate to Complete (ETC)
Analysis of Project Performance Using Earned
Value Analysis
E. SCHEDULE PERFORMANCE INDEX
Schedule Performance Index (SPI) can be used to estimate the projected time to complete the project based on the performance to date. It is given by:
SPI = EV / PV SPI = 1 means that project is on schedule. SPI < 1 means that project is behind schedule. SPI > 1 means that project is ahead of schedule.
F. COST PERFORMANCE INDEX
Cost Performance Index (CPI) can be used to estimate the projected cost to complete the project based on performance to date. It is given by:
CPI = EV / AC
CPI = 1 means that the planned and actual costs are same. CPI < 1 means that project is under budget.
CPI > 1 means that project is over budget.
G. SCHEDULE VARIANCE
Schedule Variance (SV) is the comparison of amount of work performed during a given period of time to what was scheduled to be performed. It is calculated as follows
SV = EV – PV
A negative schedule variance indicates that the project is behind schedule which means it took longer time than planned to perform the work. In the same way, a positive variance indicates that the project is ahead of schedule which means it took lesser time than planned to perform.
H. COST VARIANCE
Cost Variance (CV) is the comparison of the budgeted cost of work performed with the actual cost. It is calculated as follows
CV = EV – AC
A negative cost variance means the project is over budget that is performing the work cost more than planned. When this happens, the project managers will be able to know that cost is going beyond the budget.
The reasons for this can be analysed and suitable corrective measures can be taken to bring the project back on budget. In the same way, a positive cost variance means that the project is progressing at a cost lesser than what was planned to be spent. This is a good sign as it shows that the project is progressing efficiently.
I. BUDGET AT COMPLETION
Budget at Completion (BAC) is the baseline cost that shows the planned cost for a task, a resource for all assigned tasks or for work to be performed by a resource on a task. The terms and their interpretations are presented in Table 1 given below.
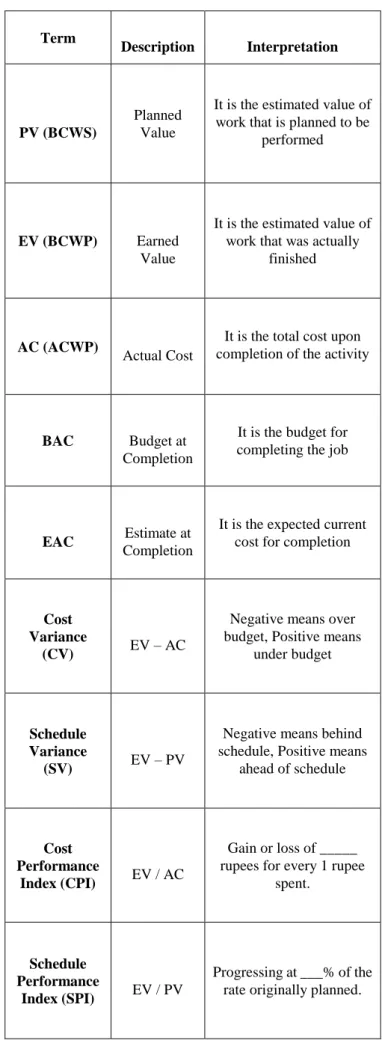
Table 1: Earned Value Terms
Term
Description Interpretation
PV (BCWS)
Planned Value
It is the estimated value of work that is planned to be
performed
EV (BCWP) Earned
Value
It is the estimated value of work that was actually
finished
AC (ACWP)
Actual Cost
It is the total cost upon completion of the activity
BAC Budget at
Completion
It is the budget for completing the job
EAC Estimate at
Completion
It is the expected current cost for completion
Cost Variance
(CV) EV – AC
Negative means over budget, Positive means
under budget
Schedule Variance
(SV) EV – PV
Negative means behind schedule, Positive means
ahead of schedule
Cost Performance
Index (CPI) EV / AC
Gain or loss of _____ rupees for every 1 rupee
spent.
Schedule Performance
Index (SPI) EV / PV
Progressing at ___% of the rate originally planned.
Fig 1 : Earned Value Analysis curve
Figure 3.1 shows the graphical representation of the costs with respect to time. It shows the expected budget and how there is a variation of actual cost from this expected budget or the planned value. The estimate of work which was actually performed is also shown as Earned value.
III. OBJECTIVESOFSTUDY
This study is done to to fulfill the following objectives To improve management control system of a
construction project by keeping the project on time and on budget.
To identify and control problems in potential risk areas.
IV. SCOPEOFTHEPROJECT
Earned Value Analysis as a performance evaluation tool can be used for any construction project. This paper focuses on the Earned Value Analysis done on a real time project. The analysis helped the project perform better through the cost and schedule indices.
V. LITERATUREREVIEW
Earned Value and Fuzzy concepts have been a subject of case studies and research. This has helped in understanding the concept clearly.
EVMS provides value to the project management team. It improves the project‟s ability to monitor cost and schedule. So the project team can foresee problems, plan corrective actions, and implement course corrections without causing significant adverse impact to the project. The studies have looked at what drives the cost of an implementation to meet the intent of the guidelines. Some of the cost drivers pointed out included excessive documentation; excessive levels of detail in the work breakdown structure, and written variance analysis reports. The key elements for success of the EVMS are related with the project teams‟ ability in planning, monitoring, and controlling the project with the right balance between process and results. EVMS also fostered an
environment that was effective in controlling against cost and schedule issues that arose. This level of control allowed the project to stay within its Contract Target Cost (Howard Hunter 2014).
Earned Value is an improvement over traditional accounting progress measures. Traditional methods focus on planned accomplishment (expenditure) and actual costs. Earned Value goes one step further and examines actual accomplishment. This gives managers greater insight into potential risk areas. With clearer picture, managers can create risk mitigation plans based on actual cost, schedule and technical progress of the work. It is an early warning project management tool that enables managers to identify and control problems before they become insurmountable. It allows projects to be managed better – on time and on budget (Sunil Ganpat Mahadik 2013).
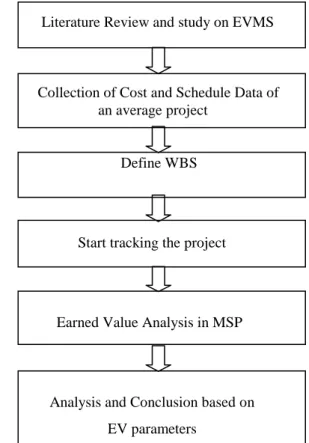
VI. METHODOLOGY
The Methodology for this paper is shown in a flow chart as follows.
Literature Review and study on EVMS
Collection of Cost and Schedule Data of an average project
Define WBS
Start tracking the project
Earned Value Analysis in MSP
Analysis and Conclusion based on EV parameters
The First approach is to collect the existing research and analysis that have been done on Earned Value Analysis.
The Second approach is to study the implementation of EV in various projects, how they have concluded based on the results.
The third approach is to collect schedule and cost data of an average project which is in progress so that EV analysis can be done and conclusions can be made regarding the future of the project.
The fourth approach is to start tracking the project and keep a note on the progress of different activities.
The fifth approach is to perform the analysis on a particular date after inputting the actual cost. The analysis is done using Microsoft Office Project software.
The sixth approach is to yield project progress report on different status dates. The report may include critical activities, activities in progress, budgeted costs, cost incurred etc
The final approach is to make suitable conclusions based on the Schedule and Cost indices obtained after Earned Value Analysis.
VII. APPLICATION
The project is the construction of a hospital building in Palakkad, in Kerala located in the southern part of India. Analysis is made after collecting schedule and cost data.
The project is expected to finish in June 2015. The EV analysis is done at certain points of progress of the project. Based on the results suitable conclusions are drawn regarding cost at the completion of the project and when the project will be completed.
The sequence of activities, their duration, start dates, finish dates and the predecessors for a part of the project is shown in Figure 3.
Fig 3: Scheduling in MSP
After developing a suitable MSP file, tracking of the project starts. The sequence of activities as in MSP is shown in figure 4. The progress of the project has been analyzed on different dates from December 2014 to February 2015. Till now 60 % of the project has been completed. Based on the cost and schedule analysis, conclusions have been drawn.
Fig 4: Sequence of Activities
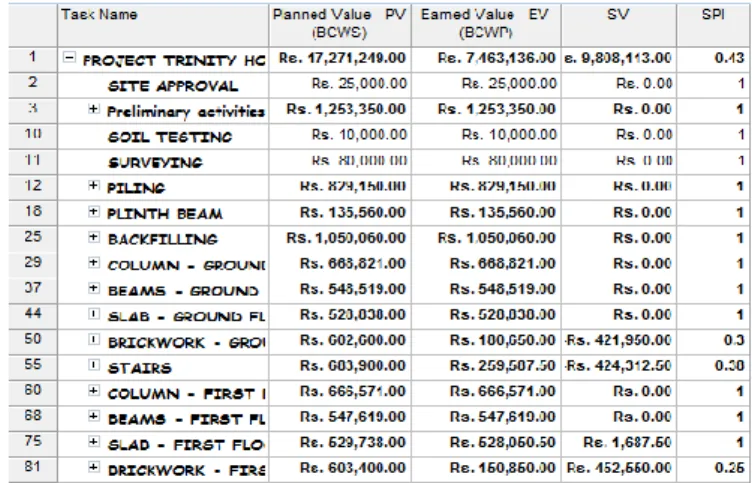
Cost and Schedule analysis have been done separately as shown in Figure 7 and Figure 8.
Fig 5: Cost analysis as on 13-02-2015
Fig 7 shows the analysis done on 13th February 2015. On this date activities till „Beams - First floor‟ have been completed. Thus all these activities have earned a value according to what they have planned. But it shows a Cost Variation of say Rs. 70,567.00 for the activity „Piling‟. The CPI is 0.92 which means for every 1 rupee that they have spent on activity „piling‟ they have earned only 0.92 rupee till completion. Same kind of variation can be seen till „Beams – First Floor‟. The activity in progress is „Brickwork – First Floor‟ which has earned for an equivalent work of Rs. 150850.00. This is how Cost analysis is interpreted. The schedule analysis is shown as below in Fig 6.
Fig 6 shows the schedule analysis. Take an example. The progressing activity which is „Brickwork – Ground floor‟ is behind schedule with a value of Rs. 421950.00. The SPI show 0.3 which means it is progressing at 30 % of what was originally planned.
VIII. ANALYSIS
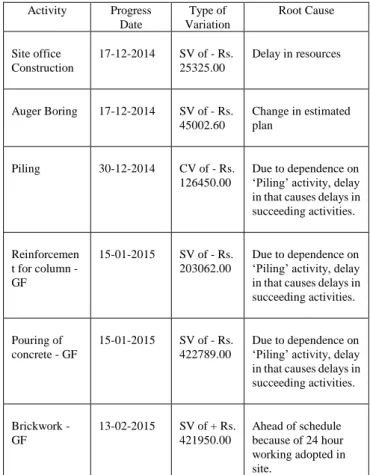
The main objective of this case study on this project is to study and analyze the EVM variables and come to a conclusion regarding how the values were arrived at. The Root Cause Analysis for activities where variation is large is tabulated and shown in Table 2.
Table 2: Root Cause Analysis
Activity Progress Date Type of Variation Root Cause Site office Construction 17-12-2014 SV of - Rs. 25325.00 Delay in resources Auger Boring 17-12-2014 SV of - Rs. 45002.60 Change in estimated plan Piling 30-12-2014 CV of - Rs. 126450.00 Due to dependence on „Piling‟ activity, delay in that causes delays in succeeding activities. Reinforcemen t for column - GF 15-01-2015 SV of - Rs. 203062.00 Due to dependence on „Piling‟ activity, delay in that causes delays in succeeding activities. Pouring of concrete - GF 15-01-2015 SV of - Rs. 422789.00 Due to dependence on „Piling‟ activity, delay in that causes delays in succeeding activities. Brickwork - GF 13-02-2015 SV of + Rs. 421950.00 Ahead of schedule because of 24 hour working adopted in site.
From the Cost Analysis, CV is showing a negative value which means it is over budget.
CPI = 0.97, which means the project is getting only 0.97 of every 1 rupee that it spends.
From the Schedule Analysis, SV when considered for the whole project is showing a positive value which means it is ahead of schedule. For the project, initial estimate was based on the plan of individual footings for each column. But there was a change in plan and pile foundation was adopted. This was because of future plans of further raise of this G + 2 level project. Because of this change in plan and a constraint of project deadline (June 2015), they had to work 24 hours a day in the site. This might be the reason for the SV showing a positive value thus telling that project is ahead of schedule. The billing is less than what was planned. The possible reasons can be :
Due to non availability of drawings during certain progress of activities resulting in delay.
Change in estimate as pile foundations were adopted instead of column footings planned initially. Productivity from the labor side.
The possible things that can be done to overcome this are: Adopt 24 hours per day working calendar. They have
done this as they have to finish the project within the deadline even after the design itself was changed. Include more skilled labors
IX. CONCLUSION
The main conclusion is that EVM can provide an important contribution in cost management of a construction project.
It can be sensitive to scope change.
Scheduling in MSP proves to ease the scheduling of projects.
It acts as a warning system to the project managers and thus helps in efficient project management.
The reports can be used in future projects as to possible hindrances that may well arise in other projects also.
Hence, EVM provides more perception about the costs and other elements of scope, risks, performance etc. It inspires the management team to pay more attention to cost, schedule and progress with more intensity and optimizes the project.
X. REFERENCES
[1] Ankur Verma1, K.K. Pathak2, R K Dixit2 , “Earned Value Analysis
of Construction Project at Rashtriya Sanskrit Sansthan, Bhopal” , International Journal of Innovative Research in Science, Engineering and Technology ( 2014 ) Vol 3.
[2] Guanrong Chen and Trung Tat Pham (2006), “Introduction to Fuzzy Systems”, Chapman & Hall/CRC Publications.
[3] Howard Hunter n, Richard Fitzgerald, Dewey Barlow, “Improved cost monitoring and control through the Earned Value Management System” , International Journal of Project Management 32 ( 2014 ) 709 – 716 .
[4] Leila Moslemi Naeni, Shahram Shadrokh, Amir Salehipour, “ A Fuzzy Approach for earned value management”, International Journal of Project Management 32 (2014)
[5] Raj Kumar Bansal, Ashok Kumar Goel, Manoj Kumar Sharma (2009), “MATLAB and its applications in Engineering”, Dorling Kindersley Pvt Ltd.
[6] Shatanand Patil*, Akshay Patil** and Prof.PramilaChavan***, “Earned Value Management for Tracking Project Progress”, International Journal of Engineering Research and Applications ( 2012 ) 1026 – 1029
[7] Sunil Ganpat Mahadik, Pankaj P. Bhangale, “Study & Analysis of Construction ProjectManagement with Earn Value Management System”, International Journal of Innovative Technology and Exploring Engineering ( 2013 ) Vol 3
Sandhya Suresh, Student, Department of Civil Engineering, SRM University,
Kattangulathur, Chennai.
Ganapathy Ramasamy N, Asst Professor Department of civil engineering, SRM University,