National Tax Journal Vol. LIII, No. 4, Part 2
Abstract - This paper presents our findings on the knowledge and use of the 1997 Earned Income Tax Credit (EITC) based on a sample of Chicago area households, with children, that filed tax returns in the winter and spring of 1998. Respondents reported in detail about using their federal tax refunds (including the EITC) to pay bills, purchase new items, or save. Data were also gathered on respon-dents’ prior knowledge of the EITC and their ability to make par-ticular expenditures without the help of the EITC. Uses of the EITC are divided into those that improve economic and social mobility (e.g., purchase a car, pay tuition, change residence) and those that primarily help to make ends meet (e.g., pay routine bills, purchase food). This is among the first papers to address these issues, despite the fact that the EITC is our largest refundable tax credit program targeted at low–income families.
INTRODUCTION
T
he largest targeted tax credit program for low–income families is the Earned Income Tax Credit (EITC). In 1997, the EITC cost the federal government $30.0 billion, more than was spent on food stamps or Temporary Assistance to Needy Families (TANF) in that year. Over 19.8 million taxpaying units benefited from the EITC in 1997. About 80 percent of the ben-efits were returned to claimants in IRS tax refund checks in 1998, and the remainder went directly to reduce tax liability (Internal Revenue Service, 1999b). Despite its fiscal size, very little is known about the impact of the EITC on the families who receive it.1 Unlike other income–transfer programs, theEITC is received by almost all families as an annual, lump sum, tax refund check paid sometime in the spring of the year after wages are earned (Internal Revenue Service, 1999a). Be-cause of the form and generosity of the EITC, it is liable to have very different behavioral and economic effects than if the benefits were received on a monthly basis throughout the year, as is the case with most other means–tested transfers.
This paper examines how the EITC influences recipients’ expenditure patterns by asking the following questions. Does expectation of a refund affect how EITC funds are used? Are
The EITC: Expectation, Knowledge, Use,
and Economic and Social Mobility
Timothy M. Smeeding
Center for Policy Research,
The Maxwell School, Syracuse University, Syracuse, NY 13244-1020
Katherin Ross Phillips
The Urban Institute, Washington, D.C. 20037
Michael O’Connor
Center for Urban Research and Learning, Loyola University, Chicago, Illinois 60611
1 Small ethnographic studies of the EITC include Rimer (1995) and Romich
and Weisner (1999). Barrow and McGranahan (1999) use the Consumer Expenditure Survey from 1982 to 1996 to examine the effects of the EITC on purchases of consumer durables by low–income households.
NATIONAL TAX JOURNAL
1188 EITC checks used to pay bills, to make new purchases, or are they primarily saved for later use? Does the EITC mainly help finance current consumption, or does it affect savings and investment behavior, helping low–income beneficiaries build assets and equity and therefore improve economic and social mobility?2
Before addressing these questions, the next section of the paper briefly reviews recent research that examines the eco-nomic and behavioral effects of the EITC. After describing the data collection pro-cess and our sample selection, the paper explains our classification of “use bundles.” We classify recipients’ planned uses for their refunds into two bundles: making ends meet, and improving eco-nomic and social mobility. The final sec-tions of the paper present our results, con-clusions, and suggestions for future re-search.
RECENT STUDIES OF THE EITC: BEHAVIORAL AND ECONOMIC EFFECTS
Program Basics
The EITC was enacted in 1975 to pro-vide refundable tax credits to low–income workers and, originally, to refund some fraction of their Social Security taxes (Eissa and Hoynes, 1998). The EITC was signifi-cantly expanded in the Tax Reform Act (TRA) of 1986 and the Omnibus Budget Reconciliation Acts (OBRA) of 1990 and, especially, of 1993. The most significant changes in the EITC have taken place in benefit generosity to families with two children.3 The 1993 OBRA expanded the
maximum credit for families with two children from $1,511 in 1993 to $3,556 in 1996. As a result, the earnings subsidy for
low earnings families with two or more qualifying children doubled over three years, from 19.5 percent of earnings in 1993 to 40 percent of earnings in 1996. Because of this growth, the EITC benefits a wide range of families, from those who might be cycling on and off welfare (TANF) to those with near median in-comes. Faced with this broad range of beneficiaries, we would expect to find dif-ferent types of behavioral and economic effects for different types of recipients.
Behavioral and Economic Effects
Most, if not all, previous studies of the behavioral effects of the EITC have con-centrated on labor supply, family forma-tion, or differential design of employ-ment–based subsidies. The EITC offers a powerful work incentive for low–income parents with children, e.g., the TANF population, with an earnings subsidy of 40 percent per dollar of pay up to $8,890 in 1996. One recent econometric study (Meyer and Rosenbaum, 1999) concludes that the EITC has been the primary driv-ing force in increasdriv-ing employment by single mothers over the 1984–96 period. Eissa and Liebman (1996) reach a similar conclusion for the 1984–90 period using different data, and the Council of Eco-nomic Advisers (1998, Chart 6) demon-strates that increased labor force partici-pation among low–income mothers closely tracks changes in the maximum EITC benefit level over the past decade. The federal EITC for families with two or more children in 1996 declines at a rate of 21.06 percent per dollar earned from $11,610 to $28,945, the phase out range. Eissa and Hoynes (1998) find that the phase out reduces work effort by married
2 A prior paper (Smeeding, Ross, O’Connor, and Simon 1999) used a different sample and concentrated on the
policy implications of EITC uses. Here we concentrate on families with children only and examine how use of refunds are related to expectations and other characteristics.
3 The EITC is also available to single persons but at a much lower level. In contrast to the treatment of families
with children, the level of EITC benefit for single filers has not changed in real terms since 1994. In our analysis, we focus on families with qualifying children.
women. Thus, higher earning families in the phase out region of the EITC may have different labor supply responses than do lower earning families in the phase in or plateau ranges.4
All of these studies treat the EITC as an income subsidy and, for the most part, do not deal explicitly with its delivery mecha-nism, timing, and form of benefit receipt, or its effects on expenditures. In fact, re-cent studies of the substantial antipoverty effect of the EITC (e.g., Greenstein and Shapiro, 1998; Council of Economic Ad-visers, 1998) estimate the effect of the EITC on poverty during the year earnings are received as income, not during the follow-ing year when the EITC tax refunds based on these earnings are actually received. Counting the EITC as income in one pe-riod when the benefit is not received un-til the following year suggests a degree of liquidity and consumption spreading that may be beyond the means of many recipi-ent families. Looking at the timing and form of benefit receipt also raises the ques-tion of whether the EITC should be viewed as an income transfer or as an as-set transfer.
Because of its unique administration through the income tax system and “lumpy” character, the EITC offers a rare opportunity to examine the economic im-pact of a tax refund program on recipi-ents. Souleles (1999) also studies the re-sponse of household consumption to in-come tax refunds from 1979 to 1990, but does not separate the EITC from other
re-funds. He finds that roughly 20 percent of all income tax refunds is used for pur-chases of durable goods.5
The lumpy nature of the EITC arises from several factors. First, only a portion of the EITC can be received as an ongoing transfer during the year when income is earned. Employees who submit W–5 withholding forms to their employers can receive an advanced payment of up to 60 percent of the maximum allowable amount of the EITC for a worker with one qualifying child. This translates into a maximum amount of advanced payment in 1998 of $26 per week (Internal Revenue Service, 1999a). A worker with two quali-fying children, however, could be eligible for as much as $72 per week, nearly three times the maximum advance payment amount.6 Over 99 percent of recipients do
not use the advanced payment option, and instead receive a lump sum amount when they file their income tax in the fol-lowing year (Scholz, 1994; Internal Rev-enue Service 1999a, 1999c).
There are several possible explanations for the observed preference for a lump sum transfer over the advance payment option, including: (a) employers’ unwill-ingness to participate in the program; (b) employees’ unwillingness to inform the employer of EITC eligibility due to stigma effects or fears of lower pre–tax wages; (c) instability and variability of earnings among the likely EITC population that raises the probability of having to repay the EITC advance at tax time; (d)
recipi-4 Other recent research suggests that the EITC has ambiguous effects on the decision of a female head to cohabitate
or to marry (Ellwood, 1999; Dickert–Conlin and Houser, 1998). Dickert–Conlin and Holtz–Eakin (1998) com-pare the EITC to employer–based wage subsidies and find that the EITC fosters high participation rates and produces increased labor force participation among groups at risk of long–run labor force detachment. Blank (1998) also finds the EITC is better targeted on low–income families than equivalent cost employer–based wage or earnings subsidies.
5 Souleles (1999, Table 5, p. 955) defines durables as “consumption minus strictly nondurables,” thus including
vehicles, appliances, education, and all other investment goods.
6 In 1998, an EITC eligible earner with two qualifying children and an expected annual income of between
$9,400 and $12,200 would ultimately receive a benefit averaging $72 per week ($3,756 divided by 52), once the tax return was filed and the EITC benefit check received. If the earner had one child and between $6,700 and $12,200 of earnings during this year, the maximum benefit could amount to $44 per week, or 70 percent more than the $26 maximum allowed by law.
NATIONAL TAX JOURNAL
1190 ent indifference between lump sum and monthly payments with the added cost of compliance with monthly payments tip-ping them in favor of the lump sum; and (e) employees’ desire for the forced sav-ings aspects of the EITC that result from receipt of the entire benefit in a lump sum. While there is some evidence that recipi-ents prefer the forced savings aspects of the EITC (Romich and Weisner, 1999; Olson and Davis, 1994), the relative im-pacts of each of these factors on the form of EITC receipt have yet to be thoroughly examined.
Regardless of the reason for type of ben-efit receipt, the lumpy nature of the EITC benefit and its benefit generosity create an opportunity to study the effects of the pro-gram on household expenditure patterns and on asset behavior (i.e., debt, credit, and savings).7 Very little has been
writ-ten about the way that households use EITC benefits, despite the fact that federal EITC benefits can be as high as 40 percent of the previous year’s income. One small study (200– to 300–person telephone in-terviews) shows that the EITC is used to pay overdue utility bills (e.g., Gallup Poll, 1993). A New York Times news story (Rimer, 1995) suggested that some recipients made interesting and creative use of the EITC to improve transportation to and from a job, to move to a safer neighbor-hood, or to put children into better schools. However, Rimer did not exam-ine the extent to which these uses are typi-cal or idiosyncratic. A recent ethnographic study of 42 low–income families in
Wis-consin examines the use of tax refunds (Romich and Weisner, 1999).8 The authors
conclude that families use lump sum tax refunds to improve family well–being and to make large purchases. Finally, Barrow and McGranahan (2000) find that the EITC induces changes in seasonal expenditure patterns for durable goods. Using survey data specifically designed to address these questions, our study describes how fami-lies plan to spend and/or save their EITC benefit.
THE CLHS STUDY
Our data are drawn from a sample of 5,000 low–income Chicago area taxpayers who utilized the free tax preparation ser-vices provided by the Center for Law and Human Services (CLHS) in the winter and spring of 1998. The CLHS has ten centers in the Chicago metropolitan area, almost exclusively in low–income neighbor-hoods. Any low–income taxpayer can re-ceive free assistance with tax return prepa-ration from professionally qualified vol-unteers at a CLHS center. We designed the survey instrument and employed five in-terviewers who visited seven of these sites from January 1998 through April 1998 to interview EITC beneficiaries at the time their tax returns were filed. More than 90 percent of taxpayers interviewed were willing to discuss their refunds, produc-ing a sample of 1,226 total respondents, 1,121 of whom were expected to receive a federal refund and 846 of whom expected to benefit from the EITC (Table 1).
7 Ideally, one would like to separate the economic effects of the EITC using a comparison group to parse out
behavioral effects. Because the EITC is a national program open to all low–income, low–wage taxpayers, there is no natural control group. One could examine year–to–year changes in outlays using, for instance, the Consumer Expenditure Survey (CEX), as in Barrow and McGranahan (1999). However, the CEX does not collect tax data and is not designed for assessing the effects of the EITC on its respondents. Further, nonpar-ticipants of the EITC are likely to be a nonrepresentative and biased group. As a substitute, we devised the questions regarding ability to make spending or saving decisions if the tax refund was not given. These results are reported on below and the questions are presented in the Appendix.
8 Romich and Weisner (1999) do not have access to tax returns but they estimate that 36 of their 42 families are
eligible for the EITC. While their conclusions rely on comments from only a sample of their families, addi-tional interviews are planned. Our larger sample and direct knowledge of EITC receipt complement the analy-ses of Romich and Weisner (1999) and Rimer (1995). It is encouraging that our findings are generally similar.
For this paper, we selected a sample of tax units that CLHS calculated would have a federal tax refund and also receive the EITC. These selection criteria pro-duced a sample of 823 returns. From these we excluded single persons receiving the EITC. Our main analytic group is the sub-set of the tax units that receive the EITC as part of a federal tax refund and that also have dependent children, 650 total re-spondents (Table 1).
The CLHS database contains two types of information. First, we have access to the federal tax returns of all recipients who filed through CLHS in 1998. For our sample this
includes filing status, number of depen-dents, and all sources of income reported to the IRS. In addition, we constructed an interview about the intended use of the EITC. The CLHS interview asked recipients about their knowledge of and expectation of the EITC, and their priorities and use of the EITC to pay bills (several categories), purchase items (several categories), or to save the EITC checks for future use. They were also asked about their ability to carry out their spending/saving priorities were it not for the EITC. A subset of the actual questions used in the survey is included as an appendix to this paper.9,10
9 About one–quarter (208) of the 823 families in our sample also completed a follow–up phone interview six
weeks after filing to verify their receipt of the EITC and to answer the same questions posed to them earlier on their use of the EITC. While we rely on the questionnaires filled out at the time of the tax filing, the 208 call– back interviews provide verification of intended use of the refunds. Call–backs were limited to those with refunds of $1,000 or more and we obtained a 50 percent response rate. About 90 percent of the call–backs received the refund amount calculated by the CLHS when the tax forms were submitted. Differences were due to federal inquiries regarding legitimacy of the returns, or lower refunds due to garnishment for school
TABLE 1
TAX REFUND AND EITC AMONG INTERVIEWEES BY DIFFERENT REFUND STATUS A. Total Tax Refund (Overwithholding plus EITC)
B. EITC Alone
Getting a Getting a Refund
Getting a Refund and EITC
Overall Refund and EITC with children
Minimum Median Average Maximum
N
Getting a Getting a Refund
Getting a Refund and EITC
Overall Refund and EITC with children
Minimum Median Average Maximum
N
C. EITC as Percent of Total Federal Tax Refund (Overwitholding + EITC)
Getting a Getting a Refund
Getting a Refund and EITC
Overall Refund and EITC with children
Minimum Median Average Maximum N 0 772 1,326 5,023 1,226 0 432 1,019 3,656 1,226 NA NA NA NA 1,226 1 927 1,450 5,023 1,121 11 1,351 1,477 3,656 846 0 76 65 1,884 1,121 17 1,724 1,800 5,023 823 11 1,403 1,502 3,656 823 1 88 87 1,884 823 40 2,240 2,173 5,023 650 14 1,898 1,850 3,656 650 1 91 90 1,884 650
NATIONAL TAX JOURNAL
1192
Sample Characteristics
In this study we restrict our analyses to families with children: single parents or two–parent filers. According to IRS data for 1996, of the 19.5 million filers who claimed the EITC, 7.8 million claimed one child while 8.0 million claimed two or more chil-dren (Internal Revenue Service, 1999c). Over 97 percent of the total cost of the credit for tax year 1996 ($28.2 billion) went to the 82 percent of the filers who claimed one or more eligible children (Internal Rev-enue Service, 1999c). Of our sample of EITC returns with children, 47 percent had one child; 53 percent had two or more children. These can be compared to national frac-tions of 49 percent with one child and 51 percent with two or more children.
Our sample of filers with children is 48 percent African American, 32 percent Latino/Hispanic, and 20 percent Cauca-sian or other. The 1990 Census indicates that among those families with children under 18 in the Chicago central city, 43 percent of families were African American, 27 percent Hispanic, and 30 percent white or other ethnic group (U.S. Bureau of the Census, 2000). About 65 percent of our to-tal interviewees who received the EITC and a refund were single parents (as de-termined by head of household filing sta-tus) while 15 percent were married filing a joint return and 19 percent were single person filers (Appendix Table A-1, middle
column). National samples from 1997 di-vide EITC beneficiaries into two major groups: (a) about 70 percent are single par-ents filing as heads of households or single persons; (b) almost 30 percent are low earning two–parent households (U.S. Con-gress, 1998, Table 13–13, p. 871). Other IRS data suggest that 18 percent of filers in 1996 were single filers without children (Internal Revenue Service, 1999b). Assum-ing the same fraction of sAssum-ingle filers in 1997 as in 1996, this means that 52 percent of national filers were single parent heads of households in 1997.
These characteristics suggest that our total sample population is more likely to be made up of single parents than the na-tional sample (65 percent for our sample versus 52 percent nationally). Our sample, however, is more restrictive than the IRS national sample; tax units in our sample not only receive the EITC, but also have a positive federal tax refund. We know of no national data on the ethnicity of EITC recipients, but our sample is representa-tive of the 1990 Census data on the racial and ethnic composition of the Chicago central city area.
Classification of Expenditure/Savings Bundles
In this study, we examine two impor-tant types of uses for the EITC:
loans or child support payments that were outstanding. Among this 90 percent there was a high (85 percent) correspondence between intended use of refund (sample used here) and actual use (once the check arrived), with no systematic change in the distribution of tax return use by type of use. Call–back interviewees were remarkably consistent in their preferences for EITC use in the phone interview compared to the face–to–face interview. Additional detailed comparisons across samples are available from the authors as is the entire survey instrument.
10 While the CLHS offers one venue for data collection of this type, it is not the only such venue or vendor. Two
types of paid tax preparers also help EITC recipients, 65 percent of whom used tax preparer services in 1990 (Scholz, 1994). One type are large, national, for–profit tax preparation services such as H&R Block. Another type are small, informal temporary services which are provided by self–employed persons. Both types differ from the CLHS in that they charge fees for tax preparation services while the CLHS does not. A second difference is that at least some of these services also charge customers for the right to receive their refunds in advance of the federal returns (which usually take four to six weeks to be processed). The CLHS does not provide this service. To the extent that clients differ by preparer type, our sample may be biased away from those with higher personal discount rates, and therefore perhaps away from those with greater immediate need for the EITC refund. And we obviously do not include those who file without a formal tax preparer’s assistance. Little, if anything, is known about this group.
• Making ends meet (or consumption use),
• Improving economic social mobility (or investment use).
The survey instrument permits us to go into considerable detail in classifying how recipients say they will use their EITC (see Appendix, Section C). Respondents were given several categories of future pur-chases for goods or services, for paying off existing bills, or for saving the refund for future anticipated or unanticipated needs. While several other bundles of cat-egories of uses could be created, we se-lected these two categories for reasons summarized below.
Making Ends Meet. The EITC is targeted on low–income working families with children, many of which also receive other means–tested transfers (seen Panel C of Appendix Table A–1). This suggests that much of our head of household popula-tion could be a populapopula-tion that is strug-gling to make ends meet. They may have unmet consumption needs or may use the EITC mainly to spread their consumption over the year. Barrow and McGranahan (2000) find some evidence that the EITC recipients smooth consumption. Hence, the EITC may provide the means for re-cipients to buy clothing, food, and durables, pay off outstanding bills, and meet other urgent consumption needs.
In the making ends meet bundle we in-clude payment of regular bills (rent, utili-ties, food, groceries, personal expenses), purchases of clothing, appliances or household furniture, as well as other per-sonal or regular household expenses. Ap-pendix Table A–2 lists all of the expendi-tures included in the making ends meet bundle. To the extent that the EITC helps meet current consumption needs, it may
be no different from other types of income subsidies, child care subsidies, and simi-lar benefits (e.g., food stamps) in terms of its impact on recipients’ expenditure pat-terns.
Improving Economic and Social Mobility. In a recent study of low–income working mothers, Edin (1998) found that a major-ity of her sample were credit constrained and had little leverage to borrow money. The recent literature on asset holdings by the poor and by minorities (e.g., Sherraden, 1991; Edin, 1998; Oliver and Shapiro, 1995; Shapiro, 1998; Ziliak, 1999) suggests that, when presented with incen-tives and opportunities to save, low– income families are willing to postpone current consumption to improve their long–run economic well–being.
The large size of the EITC relative to current income may present an opportu-nity for otherwise credit constrained low– income families to move beyond current consumption and to use the EITC to build assets. Shapiro (1998) refers to this as “as-set building” or “improving social mobil-ity.” We adopt the term “economic and social mobility” here to describe several equity enhancing uses of the EITC that improve longer term economic mobility and well–being. Most of these are consis-tent with Edin’s (1998) findings and those of Rimer (1995) and Romich and Weisner (1999) in their more limited set of inter-views. They are also consistent with the evidence on spending from general in-come tax refunds on vehicles (Souleles, 1999).
Our economic and social mobility bundle includes all forms of debt repay-ment, savings, and other expenditures that increase chances for improved mo-bility, including all forms of work–related expenses.11 These include payment of
11 Only in our call–back interviews did we ask savers what they intended to do with the savings. Only 44
percent said they were saving for expected future bills (a consumption spending use), while more than 60 percent were saving for at least one of the equity building purposes listed in Appendix Table A–2, some of whom were also saving to pay expected future bills (multiple responses were allowed). All forms of savings were classified as behavior that enhanced social mobility.
NATIONAL TAX JOURNAL
1194 credit card, automobile, or personal debt, as well as human capital building (e.g., tuition payments, medical bills), expenses for cars (purchases, repairs, insurance), moving expenses, and home improve-ments.12 Sharing money with family
mem-bers is also classified as an equity expense in that it builds bonds to family members who could help the donor unit in time of need. The complete bundles are listed in Table A–2.13
Results
In this section we present descriptive tables to help answer our three questions: Does expectation of a refund affect how EITC funds are allocated? Are EITC checks used to pay bills, to make new purchases, or are they primarily saved for later use? Does the EITC mainly help fi-nance current consumption, or does it af-fect savings and investment behavior, helping low–income beneficiaries build assets and equity and therefore improve economic and social mobility? In the tables, we categorize respondents by: (a) expectations of receiving a refund; (b) in-come levels; and (c) the three ranges of EITC benefit receipt—those with lower earnings that provide less than the maxi-mum benefit are in the “phase in” (or subsidy) range; those with the maximum benefit are at the “plateau”; and those
with higher incomes are in the “phase out” range. Expectations of refunds should be an important determinant of planned uses. Those with knowledge of the EITC should have made better long–run plans for spending and have a clearer set of prioritized uses than those who do not have such knowledge. Differ-ent income levels may help explain involvement with financial intermediar-ies. First, we examine the average size of the EITC and tax refunds among our sample.
Tax Refunds or EITC?
Due to over–withholding, our recipi-ents could receive tax refunds other than the federal EITC. Over–withholding, not the EITC itself, could be the driving fac-tor influencing the expenditure decisions that we observe. Table 1 presents informa-tion on the distribuinforma-tion of total refunds as well as EITC benefits for four groups: all CLHS tax interviews, all those getting a refund, all those getting a refund and the EITC, and our main sample (all of those with children getting both a posi-tive refund and the EITC). The EITC is the largest source of refund for all recipients, particularly those with larger refunds and for families with children (Panels B and C of Table 1). In our sample, the average EITC payment is $1,850 and, on average,
12 We consider repayment of debt, e.g., credit card debt, as increasing social mobility. We also believe that future
studies of the EITC should further investigate the issue of debt repayment. This topic is discussed more fully below.
13 Considerable time and effort were spent to reduce arbitrariness of creating the bundles. Some amounts of
EITC savings will no doubt be used to help make ends meet in coming months and hence may be misclassified. But even then, EITC savings become a form of self–protection and, for many low income EITC clients, may replace reliance on welfare to meet these expenses. Similarly, sharing benefits with extended family might be construed as continued reliance on traditional networks of support, and not on improved social mobility. In these cases we may overestimate items relegated to this category. In contrast, purchases of household appli-ances and other durables among low–income families, which are treated as making ends meet, often produce the physical capital necessary to start small businesses (Edin, 1998). In this case durable purchases classified as making ends meet are actually improving social mobility by providing opportunities for self–employment. However, these particularly controversial uses were not critical to the overall patterns that emerged from the analyses that follow. We checked the sensitivity of our results to the bundle classification by placing house-hold furniture and appliance purchases (durables) in the improving social mobility bundle and moving shar-ing money with family members into the makshar-ing ends meet bundle. The correlation between the original bundles and the reclassified bundles is 0.91 for improving social mobility and 0.93 for making ends meet.
the EITC constitutes 90 percent of the to-tal federal tax refund.14 We conclude that
the EITC is the main driving force in our analyses and the major source of the as-sociated economic impacts that we exam-ine below.
Expectation and Knowledge of the EITC
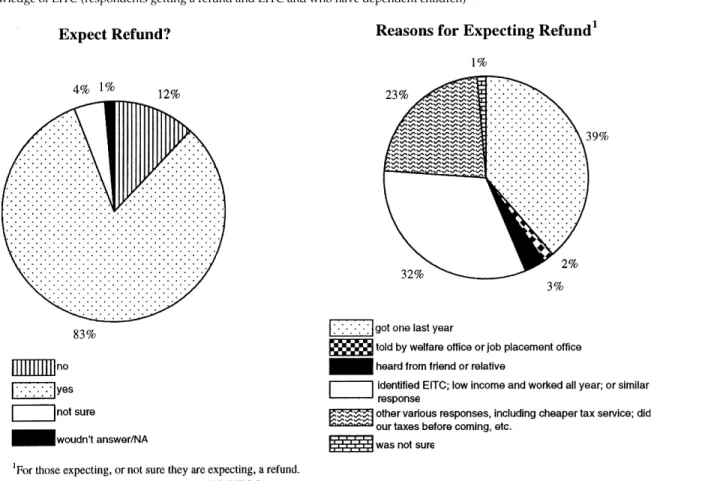
To some extent, many findings in this study are dependent on the belief that our clients expected to receive a refund and then considered how those refunds would be used.15 We find a surprisingly high
level of expectation of a tax refund and some evidence that the EITC program was the primary source of the expected tax refund (Figure 1). A full 83 percent of our sample expected to receive a refund when they came to the CLHS (left side, Figure 1). Among those expecting a refund, about one–third seemed to be familiar with the EITC itself (right side, Figure 1). That is, they used the term “EITC” for the refund or told the interviewer that the refund was “due to low income” or because they “worked all year and have a qualifying child,” or a similar response.16 We
delib-erately did not include EITC as a category in the survey, preferring that the
recipi-ents identify the program themselves. The remaining responses were scattered among other categories, particularly “re-ceived a refund last year” and others.17
Since respondents were only allowed to provide one reason for why they expected a refund, some who did not identify the EITC may also have had knowledge of the EITC but answered in other categories. Panel I of Table 2 indicates that the expec-tation of a refund increases across the EITC range; the greatest percent with ex-pectations are at the plateau level, where the refund level is highest both in dollars and as a percentage of income, and in the phase out range where incomes are higher. A large majority of recipients in our sample anticipated refunds and may have factored the refunds into their household financial planning. Panels II and III of Table 2 suggest how important the tax re-fund is to our sample of survey respon-dents.
Importance of the EITC
Respondents who received a refund of $200 or more were asked to prioritize up to three important uses of the refund. They were then asked if they could afford to
14 Due to over–withholding, the maximum amount of the refund can exceed $3,656 in Panel A of Table 1. Since
Illinois does not have a state EITC, the federal maximum of $3,656 is also the state maximum in Panel B. Unpublished tabulations indicate that even at the 25th percentile, the EITC was about 70 percent of the total refund received.
15 For the majority of our respondents we do not know if they received the EITC last year or not. We asked those
who were going to receive a refund this year whether they expected a refund. If they did expect the refund, we asked them why (see the Appendix). About 39 percent said they had received a refund last year. We did not, however, probe for whether the refund was the result of the EITC, from over–withholding, or for some other reason. Another 32 percent of the sample that expected a refund mentioned the EITC, low–income, or work as a reason for why they expected a refund (see below). We cannot be sure, however, whether any of these respondents, or those who did not expect the refund, received the EITC in 1996. About one–third of our respondents also used the CLHS in the previous tax year and many of these appear to have received the EITC as well. The majority of these repeat CLHS filers are among those who said they expected a refund because they received a refund last year; the rest are among those mentioning EITC or related reasons. As a result we chose to split the sample by whether or not clients expected a refund.
16 Those with “low income” could expect a refund based on low earnings and withholding from the regular
federal income tax withholding system, or from the EITC. Because the large majority of these expected a much larger refund than that due them for normal withholding, and because the EITC is 90 percent of the average refund received by our sample, we interpret this response as an indication of knowledge of the EITC.
17 Among “other,” many were not filled in. Two of the larger responses were: (a) already did taxes before
NA
TIONAL T
AX
JOURNAL
1196
carry out their first priority in the absence of the tax refund (Table 2).18 Almost half
of the respondents (48.7 percent) said that they could not meet their first priority unless they received the refund, with an-other 43 percent stating that without the refund they would be forced to spend (or save) a lesser amount or to delay their top priority for some time. Those with the lowest incomes (in the phase in or plateau region) are slightly more likely to have difficulty. The inability to carry out first priority objectives in the absence of the EITC, however, is evident across all three
EITC ranges (Panel III) and does not dif-fer by expectation of a refund (Panel II). Only 7 percent could definitely achieve their primary objective if they did not receive the EITC, and the ability to find alternative sources of income for the stated purpose increased in the phase out ranges. Respondents who did not expect a refund were less likely to be able to meet their first priority uses. The large major-ity of beneficiaries, whether expecting a refund or not, could not readily meet their priority uses unless they received the EITC.
I. Percent of Respondents, by EITC Range, Expecting a Refund TABLE 2
IMPORTANCE OF EITC BY EITC RANGE AND BY REFUND EXPECTATION (RESPONDENTS GETTING A REFUND AND EITC AND WHO HAVE DEPENDENT CHILDREN)
Expected a Refund
EITC Range Yes No Total
Phase in Plateau Phase out N 74.9 82.6 82.0 513 25.1 17.4 18.0 137 100.0 100.0 100.0 650
III. Importance of EITC by EITC Range Expected a Refund
Yes No Overall
Yes No Less Amount With Some Delay
Less Amount and Some Delay Not Sure Na 7.1 48.7 14.7 28.4 0.2 0.8 476 6.6 47.3 18.7 24.2 0.0 3.2 91 7.1 48.5 15.3 27.7 0.2 1.2 567
In absence of refund, could respondent do first priority
II. Importance of EITC by Expectation
EITC Range
Phase In Plateau Phase Out Overall Yes
No Less Amount With Some Delay
Less Amount and Some Delay Not Sure Na 5.4 49.8 18.2 24.7 0.0 1.9 259 5.6 47.7 13.1 32.7 0.0 0.9 107 7.1 48.5 15.3 27.7 0.2 1.2 567
In absence of refund, could respondent do first priority
10.0 47.3 12.9 28.9 0.5 0.5 201
aOver 12 percent of respondents did not answer this question (N=83).
Source: Authors’ tabulations of 1998 CLHS–EITC Survey; see Appendix questions B1 and B2.
18 The Appendix includes these questions as B.1 (priorities) and B.2 (importance). The reader should note that
only Figure 2 (priorities) is based on Question B.1, while only Table 2 (importance) is based on Question B.2. Our analysis of actual uses of the EITC in Tables 3 and 4 are based on the more detailed questions in Section C of the Appendix.
NATIONAL TAX JOURNAL
1198
Priority Uses of the EITC
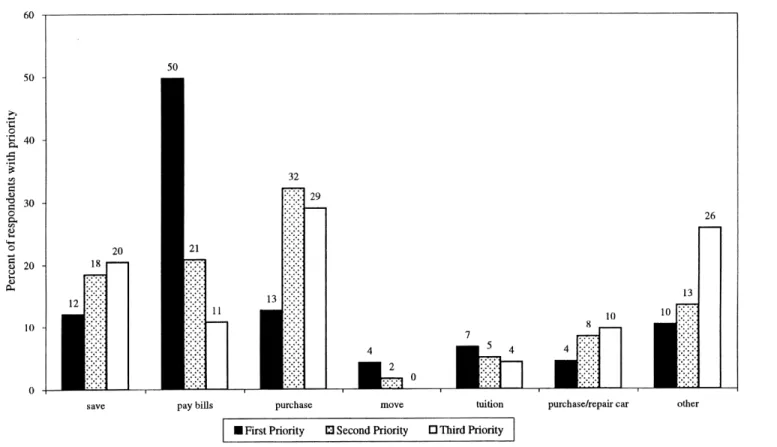
Of our sample, 81 percent had at least a first priority use for the EITC, while 46 percent also had a second priority and 14 percent a third priority use as well (Fig-ure 2). These priority declarations were separate from the detailed use of refund questions that followed (see the Appen-dix). These responses indicate that bill paying was the single most important use of the EITC for one–half of all beneficia-ries, with purchases coming in first across the smaller fraction of respondents who listed second and third priority use lev-els. Across all three priority levels, 83 per-cent of respondents had a priority use of the EITC to pay a bill, and 74 percent to make a purchase of some commodity. Clearly the EITC helps pay bills and to make ends meet.
However, fully one–half of all respon-dents with qualifying children also stated that their priorities included saving some or all of their EITC check. Moreover, in our earlier paper (Smeeding, Ross, O’Connor, and Simon, 1999) we identified three key uses of the EITC to enhance so-cial mobility: moving, paying tuition, or purchasing or repairing a car. Each of these uses is also summarized in Figure 2. While moving seems to be an all–or– nothing decision (with only 2 percent list-ing it as a secondary or tertiary priority compared to 4 percent who list it as a pri-mary priority), paying tuition or purchas-ing/repairing a car are more evenly spread across the priority ordering. Alto-gether, 16 percent of the sample stated they would use the EITC to pay tuition while 22 percent would make a car related use of the refund. These uses suggest that the EITC also plays a large role in
improv-ing economic and social mobility. All other priority uses of the EITC are summarized in the final columns and amount to only 10 percent of primary priorities and 13 percent of secondary priorities.
Bundles of Use
In addition to asking respondents to prioritize anticipated uses for their re-funds, we also asked them how they spe-cifically intended to use the EITC (Appen-dix, Section C). Respondents could, and usually did, have more than one expected use for their refunds. Because a first pri-ority use (e.g., paying an overdue bill) may differ from the largest source of ex-pense or use, these questions were de-signed to have the client give us as much detail about the categorical breakdown of the refund as possible. We then disagggated respondents by expectation of re-fund to arrive at our best overall snapshot of EITC use (Table 3).19
Almost 70 percent of all beneficiaries with children had an economic and social mobility related use for the EITC (Panel B of Table 3). Those who expected a refund were much more likely than those not ex-pecting a refund to have such a use (75 to 49 percent). Cars and schooling were the most important specific uses listed under mobility uses. Among respondents who had a mobility use but did not expect a refund, the majority planned to save at least a portion of their refund. Those not expecting a refund were also most likely to have no plans for the EITC (34.3 per-cent).20 Because expectations lead to very
high probability of mobility use (as well as making ends meet use), the EITC ap-pears to be more than a simple
“consump-19 See Appendix questions C.1, C.2, and C.3, which form the basis for Table 3. “Other uses” were not listed in
Table 3. They totaled 16.4 percent for improving social mobility uses and 11.2 percent for making ends meet uses.
20 Our earlier paper (Smeeding, Ross, O’Connor, and Simon, 1999) and DeParle (1999) find that those with no
plans for use of the EITC were those with smaller refunds, lower earned incomes, and are those on the phase in range of the EITC.
The EITC: Expectation, Knowledge, Use, and Economic and Social Mobility
1199
Figure 2. Self–Reported Important Uses of Refund1 (respondents getting a refund and EITC and who have dependent children)
1Number of priority uses mentioned as a percent of those responding. Eighty–one percent of our sample had a first priority use for their tax refund, 46 percent expressed a second priority, and 14 percent a third priority. Hence, some households have multiple priorities and other did not give any priorities.
NATIONAL TAX JOURNAL
1200 tion spreading” transfer.21 That is, the
EITC does seem to provide opportunities for investments that may not be as likely were those beneficiaries to receive a smaller but continuous transfer during the previous year.
About 65 percent of all EITC clients with children had a making ends meet use: 69 percent of those expecting a benefit and one–half of those not expecting a benefit (Panel C of Table 3). Utilities and rent were the most important expenditure catego-ries for both groups, followed by food and clothing. Only 13 percent mentioned pur-chasing a durable good (other than a car) as a specific use of the EITC. Almost one– half of all beneficiaries, and over one–half of those expecting a refund, had both types of uses planned for their refund (Panel D of Table 3). Among those choos-ing either mobility uses only or makchoos-ing
ends meet uses only, the former was a stronger preference, by a small margin, for those expecting a refund.
Use of the EITC by Number of Children
One important determinant of the use of the EITC may be the number of chil-dren in the family (Table 4). Among our sample of EITC clients with children, 19 percent had three or more, while 34 per-cent had two, and about 47 perper-cent had only one child. Larger families were more likely to have at least one making ends meet use and less likely to have an eco-nomic and social mobility use. A full 20 percent of those with three or more chil-dren had only making ends meet uses. This pattern suggests that larger families are more likely to spend the EITC on a consumption related use.
21 This breakdown is consistent with a recent study of Souleles (1999) of household consumption from income
tax refunds more generally, and with Barrow and McGranahan’s (1999) study of the effects of the EITC on durables purchases.
TABLE 3
IMPORTANT USES OF THE REFUND BY REFUND EXPECTATION1
(RESPONDENTS GETTING A REFUND AND EITC AND WHO HAVE DEPENDENT CHILDREN) Percent of Respondents by Refund Expectation
Panel Category Yes No Overall
A Households receiving EITC B Economic and Social Mobility Use
Move
Car/transportation Save
Tuition/school C Making Ends Meet Use
Utilities Rent Food Clothes Durables D Plans for EITC
None
Economic and Social Mobility Use Making Ends Meet Only Both Total N 78.9 75.4 6.4 18.7 34.3 11.1 68.8 40.0 36.5 23.0 23.0 10.2 7.4 23.8 17.2 51.7 513 21.1 48.9 0.0 5.8 25.6 6.6 49.6 24.8 24.8 12.4 19.7 14.0 34.3 16.1 16.8 32.9 137 100.0 69.9 5.1 16.0 32.5 10.2 64.8 36.8 34.0 20.8 22.3 13.2 13.1 22.2 17.1 47.7 650 Source: Authors’ tabulations of 1998 CLHS–EITC Survey. Totals may not add due to rounding.
1Number of households mentioning each specific use with a specified dollar amount allocated to each use.
Addi-tional questions were asked to further break down bill and purchase priorities into subcomponents. See survey questions C1 to C3 in Appendix.
Access to Credit
It is important to understand how EITC recipients relate to financial institutions. Low–income respondents who use check cashing services and who have no formal relationship to financial service providers, e.g., no checking or savings accounts and no credit cards, loans, or mortgages, are less likely to be able to keep a large EITC refund intact for future needs. Moreover, access to credit (debt) is important for con-sumption smoothing whether through credit cards or through formal loans. If we think of the EITC as an expected lump sum transfer, access to credit may be cru-cial to consumption smoothing behavior. In our sample it is not clear how debts and timing of purchases are related. Even if the recipient chooses the ongoing payment option for the EITC, the maxi-mum benefit may be as little as one–third of the actual refund, given the constraints of the “advanced payment” option ex-plained earlier. Therefore, access to credit and debt are an important aspect of EITC usage.
Access to financial and credit markets differs markedly across the income levels
of our sample population (Table 5). Only 42 percent of those with incomes below $7,500 had access to one or more of the types of financial services listed above. Only 27 percent had a checking account. In contrast, almost 81 percent of those with incomes of $15,000 or more had some con-tact with financial services, and 56 percent had checking accounts. Checking and sav-ings accounts, credit card use, bank loans, and mortgages all increase with income. In contrast, use of a check cashing service declined steadily across the income ranges, with 59 percent of those in the low-est income range using such services, and 25 percent in the highest income group. Most of our sample who have plans to save (64 percent) already have access to financial institutions.22 Very few (1 percent
of the sample) told us they planned to use the EITC to open a bank account. Tabular comparisons indicate that the breakdowns in Table 5 are similar to those found by other researchers using national samples to investigate use of credit cards and checking and savings accounts among low–income populations (e.g., Bird, Hagstrom, and Wild, 1998; Carney and Gale, 1998).
TABLE 4
INCOME, EITC RANGE, AND EITC USE BY NUMBER OF DEPENDENT CHILDREN (RESPONDENTS GETTING A REFUND AND EITC AND WHO HAVE DEPENDENT CHILDREN)
Percent of Respondents by Number of Dependent Children
1 2 3 or more Overall
Number of Dependent Children Plans for EITC
Any Economic and Social Mobility Use Any Making Ends Meet
Total
Plans for EITC None
Economic and Social Mobility Use Only Making Ends Meet Only
Both Total N 70.2 58.0 NA 13.1 28.9 16.7 41.3 100.0 305 72.3 70.9 NA 11.8 17.3 15.9 55.0 100.0 220 64.8 70.4 NA 15.2 14.4 20.0 50.4 100.0 125 69.9 64.8 NA 13.1 22.2 17.1 47.7 100.0 650
Source: Authors’ tabulations of 1998 CLHS–EITC Survey.
22 Our data indicate that there is a positive correlation between having a financial instrument and saving (0.453)
NATIONAL TAX JOURNAL
1202
CONCLUSION
This paper presents an exploration of how families use our largest targeted re-fundable tax credit, the EITC. The EITC is a unique income support program both because of its administration through the income tax system and its lump sum, once a year nature. While there is an option to have a portion of the EITC paid intra–year as a form of negative withholding (the “advanced” EITC option), only about 1 percent of taxpaying units receive the ad-vanced EITC. A once a year benefit may provide a key pathway for families to overcome a short–term liquidity crisis and to move beyond support of current con-sumption to meet more strategic longer term goals. This paper classifies uses of the EITC according to making ends meet (supporting consumption patterns) or improving economic and social mobility (strategic uses that can be expected to have longer term payoff). When our sample of EITC recipients with dependent children went to CLHS for tax assistance, they ex-pected to receive tax refunds, and they planned to use the EITC not only to fund current consumption, but also to invest in their families’ futures.
Most of our sample mentioned multiple uses when we asked about how they planned to use their tax refund. Nearly 65 percent plan for consumption spending (making ends meet) and almost 70 per-cent plan for economic and social mobil-ity uses. This is a larger response for durables expenditures than that found by Souleles (1999) for income tax refunds in general. The majority of recipients who expected refunds have plans for both con-sumption and mobility uses. Paying util-ity bills and rent, along with purchasing food and clothing, are the most commonly mentioned consumption uses. Spending on cars and schooling were the most fre-quently identified mobility uses of the EITC funds, though we can think of cars as having consumption– as well as work– related uses. Among respondents who did not expect a refund, but who plan to use the funds to improve economic and so-cial mobility, the majority planned to save at least a portion of their refund.
Family size appears to be associated with plans for EITC use. Families with more children are less likely to specify a mobility use and more likely to plan to use their EITC funds for consumption spending. This pattern reflects the greater TABLE 5
ACCESS TO FINANCIAL AND CREDIT MARKETS WITHIN INCOME RANGE (RESPONDENTS GETTING A REFUND AND EITC AND WHO HAVE DEPENDENT CHILDREN)
A. Access to Formal Financial and Credit Institutions Percent of Respondents within Income Range
Assests and formal credit Overall
AGI of $7,500 or less AGI $7,500 to $15,000 AGI of $15,000 or more Checking Account Savings Account Credit Card Bank Loan Mortgage
Opening Account with Refund Any of the above
N
(Average number of children)
B. Plans to Use a Check Cashing Service for EITC 26.5 14.2 19.2 1.9 3.5 1.2 41.5 260 (1.8) 42.0 31.5 32.9 4.1 8.7 1.4 66.2 219 (1.8) 56.1 51.5 40.4 5.3 11.1 0.0 81.3 171 (2.0) 39.5 29.9 29.4 3.5 7.2 0.9 60.3 650 (1.8)
Check Cashing Service
N 59.2 260 42.5 219 24.6 171 44.5 650
Source: Authors’ tabulations of 1998 CLHS–EITC Survey.
consumption needs of larger families. President Clinton’s recent proposal to ex-pand the maximum credit for families with three or more children may help larger, low–income families invest in eco-nomic and social mobility, as well as meet consumption needs, with their EITC funds.
Recipients with greater access to finan-cial institutions were more likely to save part of their EITC. The relationship be-tween financial service access and EITC use, however, remains unclear and puz-zling. For instance, we also found that about a quarter of our overall sample have credit cards and, of these, 80 percent have credit card debt averaging about $2,400.23
Yet only 18 percent of these respondents list paying off credit card debt as a prior-ity use for the EITC refund they receive. Because of growing interest in financial service access for low–income families, the effects of asset testing on savings, and the movement toward electronic benefit transfer, these topics should be high on the EITC–related research agenda.24
The results in this paper suggest that the EITC does more than spread con-sumption across time periods. It also al-lows recipients an opportunity to make changes in economic behavior. Without the EITC, almost one–half could not have met their first priority use for the EITC, while most of the rest could meet their need only to a lesser extent or with some delay. Many EITC recipients are explicitly aware of the program, and the vast ma-jority who expect a refund can articulate several specific uses for their refund, in-cluding investments in higher current and future earnings by such means as school-ing, transportation, and moving. Recipi-ents who did not expect a refund were the
most likely to have no plans for the EITC. Continued outreach and greater general knowledge of the EITC should increase both participation in the program and use of the benefit for upward economic and social mobility.
In order to move beyond our results, we would encourage further research of this type in a dynamic context. Many families who receive the EITC in one year receive it in the next. Indeed, about one–quarter of our sample indicated that they received the EITC last year while another 32 per-cent expected a refund because they got one last year. Our findings (and those of others) suggest that the EITC may play an important part in assisting families who are moving from welfare to work to move beyond “working poor” status, possibly to middle class status. Of course, many other factors also affect this transition. Following a sample of recipients over time would help identify the pathways from dependency on means–tested transfers to economic independence and the role of the EITC in these transitions.
Acknowledgments
The authors owe many thanks to Susan Lloyd and Caren Grown, and to the MacArthur Foundation for their support of this research. The Center for Law and Human Services provided the opportu-nity, site staffing, and encouragement to carry out the survey and assemble the data. Nada Eissa, Janet Holtzblatt, Jeff Liebman, Bruce Meyer, Lisa Barrow, Bob Greenstein, Doug Holtz–Eakin, Michael Wiseman, Eric Toder, and two anonymous referees provided helpful comments. Martha Bonney, Kati Foley, Esther Gray, Ann Wicks, and Jim Williamson provided
23 See also Hurst, Luoh, and Stafford (1998) on patterns of asset accumulation and debt, and changes in these
patterns over a ten–year period (1984 to 1994), among whites, blacks, and other groups.
24 For more on electronic benefits, see Stegman (1998). On using EITC benefits for subsidized savings uses such
as Individual Development Accounts or Universal Savings Accounts, see Boshara (1999) or Seidman (1998). And on the topic of means–tested benefits and negative effects on asset accumulation, see Hubbard, Skinner, and Zeldes (1995), Gruber and Yelowitz (1997), Powers (1998), and Ziliak (1999).
NATIONAL TAX JOURNAL
1204 excellent assistance in preparing the paper. The authors alone assume responsibility for all errors of omission and commission.
REFERENCES
Barrow, Lisa, and Leslie McGranahan. “The EITC and Durable Goods Purchases.”
National Tax Journal 53 No. 4, Part 2 (Decem-ber, 2000): 1211–1244.
Bird, Edward, Paul Hagstrom, and Robert Wild. “Credit Card Debts of the Poor: High and Rising.” Department of Public Policy, Uni-versity of Rochester. Mimeo, 1998. Blank, Rebecca.
“Enhancing Opportunities, Skills and Secu-rity of American Workers.” Council of Eco-nomic Advisers. Mimeo, 1998.
Boshara, Raymond.
“Individual Development Accounts: A Tool for Building Savings and Wealth.” Washing-ton, D.C.: Corporation for Enterprise Devel-opment, February, 1999.
Carney, Stacie, and William Gale.
“Asset Accumulation among Low Income Households.” Brookings Institution. Mimeo, 1998.
Council of Economic Advisers.
“Good News for Low Income Families: Ex-pansions in the Earned Income Tax Credit and the Minimum Wage.” A Report by the Council of Economic Advisors. Washington, D.C.: December, 1998.
DeParle, Jason.
“Life after Welfare—First Filers: On a Once Forlorn Avenue, Tax Preparers Now Flour-ish.” The New York Times, (March 21, 1999): 1. Dickert–Conlin, Stacy, and Douglas Holtz– Eakin.
“Employee–Based vs. Employer–Based Sub-sidies to Low Wage Workers: A Public Fi-nance Perspective.” Center for Policy Re-search, The Maxwell School, Syracuse Uni-versity. Mimeo, 1998.
Dickert–Conlin, Stacy, and Scott Houser. “EITC, AFDC, and the Female Headship Decision.” Center for Policy Research, The Maxwell School, Syracuse University. Mimeo, 1998.
Edin, Kathryn.
“The Role of Assets in the Lives of Low In-come Single Mothers and Non–Custodial Fathers.” Paper presented to the Ford Foun-dation Conference on Assets and the Poor, New York, December 10–12, 1998. Eissa, Nada, and Hilary Williamson Hoynes.
“The Earned Income Tax Credit and Labor Supply: Married Couples.” University of California Working Paper. Berkeley: Univer-sity of California, October, 1998.
Eissa, Nada, and Jeffrey Liebman.
“Labor Supply Response to the Earned In-come Tax Credit.” Quarterly Journal of Eco-nomics 111 No. 2 (May, 1996): 605–37. Ellwood, David, T.
“The Impact of the EITC and Social Policy Reforms on Work, Marriage, and Living Arrangements.” Joint Center for Poverty Re-search Working Paper #124. Chicago, IL: University of Chicago, November, 1999. Gallup Poll.
“Survey of EITC Hotline Users and HEAP Outreach Program.” Conducted for the Pub-lic Service Gas and Electric Company. Princeton, New Jersey: Gallup Organiza-tion, November, 1993.
Greenstein, Robert, and Isaac Shapiro. “New Research Findings on the Effects of
the Earned Income Tax Credit,” #98–022. Washington, D.C.: Center on Budget and Policy Priorities, March 11, 1998.
Gruber, Jon, and Aaron Yelowitz.
“Public Health Insurance and Private Sav-ings,” NBER Working Paper No. 6041. Cam-bridge, MA: National Bureau of Economic Research, 1997.
Hubbard, R. Glenn, Jonathan Skinner, and Stephen P. Zeldes.
“Precautionary Savings and Social Insur-ance.” Journal of Political Economy, 103 No. 2 (April, 1995): 360–99.
Hurst, Erik, Ming C. Luoh, and Frank P. Stafford. “The Wealth Dynamics of American Fami-lies.” Brookings Papers of Economic Activ-ity, Number 1 (1998): 267–337.
Internal Revenue Service.
“EIC Advanced Payment Allowances.” In-ternal Revenue Code Section 3705(c)(2)(B)i,
as amended by Public Law 103–66, Section 13131(d)(5)(i). Washington, D.C.: Internal Revenue Service, 1999a.
Internal Revenue Service.
Statistics of Income (SOI) Bulletin, 18 No. 4 (Spring, 1999b): Table 1.
Internal Revenue Service.
“All Individual Income Tax Returns: Se-lected Income and Tax Items, in Current and Constant 1990 Dollars.” Individual Income Tax Returns 1996, IRS Publication 1304, 05– 12–00. Washington, D.C.: Internal Revenue Service, 1999c.
Meyer, Bruce D., and Dan T. Rosenbaum. “Welfare, the Earned Income Tax Credit, and
the Labor Supply of Single Mothers.” De-partment of Economics, Northwestern Uni-versity. Mimeo, September 15, 1999. Oliver, Melvin, and Thomas Shapiro.
Black Wealth, White Wealth. New York: Routledge, 1995.
Olson, Lynn M., and Audrey Davis.
“The Earned Income Tax Credit: Views from the Street Level.” Center for Urban Affairs Working Paper Series. Evanston, IL: North-western University, 1994.
Powers, Elizabeth.
“Does Means–Testing Discourage Savings? Evidence from a Change in AFDC Policy in the United States.” Journal of Public Econom-ics 68 No. 1 (April, 1998): 33–53.
Rimer, Sara.
“Cutting Tax Credit Means Much to Those with Little.” The New York Times (October 16, 1995): 1.
Romich, Jennifer, and Thomas Weisner. “Earnings, Refund, Windfall, or Equity:
How Families View and Use the EITC.” Paper presented to the Population Associa-tion of America, New York, March 26, 1999.
Scholz, John Karl.
“The Earned Income Tax Credit: Participa-tion, Compliance, and Antipoverty Effec-tiveness.” National Tax Journal No. 46 No. 1 (March, 1994): 59–81.
Seidman, Lawrence.
“Assets and the Tax Code.” Paper presented to the Ford Foundation Conference on As-sets and the Poor, New York, December 10– 12, 1998.
Shapiro, Thomas.
“Assets and the Poor: An Introduction.” Pa-per presented to the Ford Foundation Con-ference on Assets and the Poor, New York, December 10–12, 1998.
Sherraden, Michael.
Assets and the Poor. New York: M.E. Sharpe, 1991.
Smeeding, Timothy, Katherin Ross, Michael O’Connor, and Michael Simon.
“The Economic Impact of the EITC: Con-sumption, Savings, and Debt.” Presented to the Conference on the Earned Income Tax Credit: Early Evidence, Northwestern Uni-versity, October, 1999.
Souleles, Nicholas.
“The Response of Household Consumption to Income Tax Refunds.” American Economic Review 89 No. 4 (September, 1999): 947–58. Stegman, Michael.
“Electronic Benefit Transfer’s Potential to Help the Poor.” Brookings Policy Brief No. 32. Washington, D.C.: Brookings Institution, 1998.
U.S. Bureau of the Census.
“1990 Census of Population and Housing Data.” http://venus.census.gov/cdrom/ lookup, accessed February 1, 2000. U.S. Congress.
Green Book: Background Materials and Data on Programs Within the Jurisdiction of the Committee on Ways and Means. U.S. House of Representatives. The Committee on Ways and Means, WMCP 105–7. Washington, D.C.: U.S. Government Printing Office, 1998. Ziliak, James.
“Income Transfers and Assets of the Poor.” Institute for Research on Poverty Working Paper No. 1202–99. Madison, WI: University of Wisconsin, November, 1999.
NATIONAL TAX JOURNAL
1206
APPENDIX
CLHS Questionnaire
The following questions were excerpted from the in–person interview and the phone back follow up survey. Both instruments in their entirety are available from the authors.
A. Expectations and Knowledge Questions (Figure 1 is based on responses to these questions)
A.1. Did you expect to receive a refund before you came to the tax center? a. ____ Yes (go to #A.2)
b. ____ No
c. ____ Didn’t know (wasn’t sure about receiving the refund or not) d. ____ Wouldn’t answer/not applicable
A.2. Why did you expect to receive a refund this year?
a. ____ Got one last year
b. ____ Was told I would get one by welfare office or job placement center c. ____ Heard from a friend or relative
d. ____ Other (specify and write EITC if that is mentioned; otherwise write their comment.) _________________________________
e. ____ Wasn’t sure
f. ____ Wouldn’t answer/not applicable
B. Priority Uses of the EITC (Figure 2 and Table 2 are based on responses to these questions)
B.1. Thinking of the next few months, what are the most important things you plan to do with your tax refund? (NAME UP TO THREE)
a. Most important use of tax refund: ________________________________ b. Second most important: ________________________________________ c. Third most important: _________________________________________ d. ____ Not sure/don’t know
e. ____ Wouldn’t answer
(Note: Question gets at priorities, not amounts.)
B.2. Would you have been able to . . . (read B.1.a., the first most important use) . . . anyway if you did not get this tax refund?
a. ____ No
b. ____ Yes, but of lesser amount c. ____ Yes, but with some delay
d. ____ Other __________________________________________________ e. ____ Don’t know/Not sure
e. ____ Wouldn’t answer/not applicable
(Note: Question repeated for second and third priority uses.) Vol. 53 no. 4 Part 2 (December 2000) pp. 1187-1210
C. Use of EITC (Tables 3 and 4 are based on responses to these questions)
C.1. Now we want to try to determine how you will allocate the refund among the important uses you have given us. Please identify one or more of the following options.
(Interviewer note: if more than one option is selected, prompt individual to make approximate percentage or dollar allocation among various options).
USE % or AMT. REFUND
a. ____ savings (for unexpected costs or a specific goal)___________________ b. ____ pay bills (or save refund to pay future expected bills)(see #C.2
after)____
c. ____ purchase household/personal items (see #C.3 after)_________________ d. ____ move/get new apartment______________________________________ e. ____ pay tuition for a family member________________________________ f. ____ purchase/repair car__________________________________________ g. ____ other (specify) _____________________________________________ h. ____ not sure (see question 14 after this)
i. ____ wouldn’t answer
C.2. What bills will you pay?
TYPE OF BILL % or AMT. PD. FOR EACH BILL
a. ____ rent________________________________________________________ b. ____ child care bills_______________________________________________ c. ____ utility bills__________________________________________________ d. ____ grocery bills_________________________________________________ e. ____ car payments________________________________________________ f. ____ bank loan___________________________________________________ g. ____ personal loan from family or friend_______________________________ h. ____ medical bills ________________________________________________ i. ____ other (Specify what: __________________________________________ j. ____ not sure (Go to question 14)
k. ____ wouldn’t answer (to go question 14)
C.3. What items will you purchase?
TYPE OF PURCHASE AMT. OF PURCHASE
a. ____ household furnishings , e.g., rugs, drapes (What____________)_______ b. ____ household appliances, e.g., T.V., dishwasher (What _________)_______ c. ____ clothing for family members____________________________________ d. ____ other (What _____________________________________)__________ e. ____ not sure
NA
TIONAL T
AX
JOURNAL
1208
APPENDIX TABLE A–1
SUMMARY DEMOGRAPHIC DATA
INTERVIEW AND SAMPLE
All Interviews Samplea Samplea with children
African American Hispanic/Latino Caucasian Asian/Pacific Islander Native American Other Missing Total Head of Household Married/Joint Married/Single Single Missing Total Male Female Missing Total TANF receipt Food Stamp receipt Medicaid receipt percent (non–missing) percent N percent (non–missing) percent N percent (non–missing) percent N A. Ethnicity B. Filing Status
aSample includes those receiving both the EITC and a net positive refund. Source: Author’s tabulations of 1998 CLHS–EITC Survey
C. Other Demographic Data
487 376 94 50 19 98 102 1,226 582 188 26 430 0 1,226 482 737 7 1,226 232 279 237 39.7 30.7 7.7 4.1 1.6 8.0 8.3 47.5 15.3 2.1 35.1 0.0 39.3 60.1 0.6 18.9 22.8 19.3 43.3 33.5 8.4 4.4 1.7 8.7 — 47.5 15.3 2.1 35.1 — 39.5 60.5 — — — — 384 239 60 25 10 47 58 823 539 125 0 159 0 823 260 558 5 823 217 251 206 46.7 29.0 7.3 3.0 1.2 5.7 7.1 65.5 15.2 0.0 19.3 0.0 31.6 67.8 0.6 26.4 30.5 25.0 50.2 31.2 7.8 3.3 1.3 6.1 — 65.5 15.2 0.0 19.3 — 31.8 68.2 — — — — 313 206 43 13 6 27 42 650 531 119 0 0 0 650 159 487 4 650 194 214 186 48.2 31.7 6.6 2.0 0.9 4.2 6.5 81.7 18.3 0.0 0.0 0.0 24.5 74.9 0.6 29.9 32.9 28.6 51.5 33.9 7.1 2.1 1.0 4.4 — 81.7 18.3 0.0 0.0 — 24.6 75.4 — — — —
APPENDIX TABLE A–2 COMPONENTS OF ‘IMPROVING SOCIAL
MOBILITY’ AND ‘MAKING ENDS MEET’ BUNDLES Improving Social Mobility Savings
Pay off bank loan Car payments Credit card bills Medical bills Purchase or repair car
Share money with family members Fix up home
Moving expenses Tuition/school expenses Child care bills Pay off personal loans Making Ends Meet Rent
Utility bills Other bills
Purchase groceries/pay grocery bills Purchase clothing for self or family Purchase household appliance Purchase household furniture Other personal or household expenses