Sharif University of Technology
Scientia IranicaTransactions B: Mechanical Engineering www.scientiairanica.com
Performance of piezoelectrically actuated micropump
with dierent driving voltage shapes and frequencies
E.M. Kolahdouz
a, K. Mohammadzadeh
b, E. Shirani
b;and S. Ziaei-Rad
c a. University at Bualo, Department of Mechanical Engineering, Bualo, NY, 14260.b. Foolad Institute of Technology, Fooladshahr, Isfahan, P.O. Box 84916-63763, Iran.
c. Department of Mechanical Engineering, Isfahan University of Technology, Isfahan, P.O. Box 84156-83111, Iran. Received 20 June 2012; accepted 26 February 2014
KEYWORDS Micropump; Nozzle-diuser; Waveform; Vorticity; Frequency.
Abstract. The eects of driving voltage waveform and frequencies on the performance of a piezoelectrically actuated micropump are investigated in detail. A full three-dimensional piezoelectric micropump was modeled numerically and tri electro-mechanical-uidic coupling eects have been taken into account on its interface boundaries. Standard excitation waveforms including sinusoidal, triangle, sawtooth and square shapes were implemented and the results were compared with each other. The real time pump ow behavior was studied in each case for dierent membrane positions. The analysis predicts that the more sharp jump in the wave form, the more pump ow can be attained at the outlet. Square shape excitation with the sharpest instantaneous slope has the most notable overall ow rate compared to the other types in the examined range of frequencies. The behavior can be explained by considering the generated vortices in the ow. Due to a sudden jump in membrane position, the ow forms strong vortices, which magnify the diodicty of the valves.
© 2014 Sharif University of Technology. All rights reserved.
1. Introduction
Microelectro mechanical systems (MEMS) have been one of the most favorite research topics over the last two decades. It is possible to fabricate compact and high performance systems for delivering, manipulating, analyzing or processing small amounts of liquid ow in chemical and biological applications. Micropump devices, especially, play a very important role in every microuidic network system. Among various types of micropump, the valve-less type is more attractive to scientists, due to its scalability, durability, and simplicity of fabrication.
*. Corresponding author.
E-mail addresses: [email protected] (E.M. Kolahdouz); [email protected] (K. Mohammadzadeh); [email protected] (E. Shirani); [email protected] (S. Ziaei-Rad)
Furthermore, a robust way to handle particle-laden ows is to use No-Moving-Parts (NMP) valves that allow the free passage of particles and rely on uidic instead of mechanical parts to inhibit reverse ow. The possibility of working under high frequency conditions is another advantage of using NMP valves. In summary, the valve-less micropump helps designers to test the pump condition under a wide range of frequency domain. It is also possible to choose dierent wave shape forms for periodic excitation. In this study, the main aim is to analyze micropump performance under dierent conditions of driving voltage waveforms and frequencies.
Incorporating nozzle-diuser microvalves was rst realized by Stemme and Stemme in 1993 [1]. Forster et al. [2], in 1995, used valvular conducts as check valves in the piezoelectric micropump. They also experimentally tested their micropump under harmonic and square wave excitation applied to the driver amplier, and the
importance of the waveform shape was indicated. It was proven that even the peak excitation voltage was the same for harmonic and square wave excitations; the pump output being signicantly larger for the latter. Olsson et al. [3], in 1998, used square wave excitation voltage; the resulting diaphragm motion was measured using a ber-optical detection system. Since the pump worked close to resonance frequency, the diaphragm vibration was sinusoidal in time, rather than a square wave.
Studies conducted by other researchers [4,5], in 2000 and 2001, analyzed the valveless piezoleectric micropump. They calculated the natural frequency and showed that there is a linear relation between the ow rate and head pressure at a constant driving voltage. As micropump design and analysis is a complicated multidisciplinary problem with various eld couplings, many research studies have been conducted to opti-mize the piezoelectrically actuated valveless microp-ump design [6,7,8]. Most of this research, however, underestimated the interaction eects of diaphragm vibration and uid ow. Yang et al. [9], in 2008, used the commercial software, ACE, and investigated the inuence of frequency, opening angle, geometric dimen-sion and membrane amplitude on the performance of a square chamber micropump. However the eects of the structural part, including piezoelectric inuence, were not directly simulated, and mesh displacement of the chamber was modeled using the multiplication of three harmonic functions of x, y and t. Hou et al. [10], in 2008, analyzed the mechanical properties of a diaphragm involved in the piezoelectric micropump. The displacement of the membrane center was reported under dierent driving voltage and PZT thickness. Nevertheless, a two-way interaction between the uid and solid parts was not studied. Cui et al. [11], in 2008, studied the whole micropump using ANSYS software. The completed coupled-eld simulation was studied for the valveless micropump using a nite element model. In their work, the eects of geometry on micropump characteristics were analyzed, even though the frequency was constant and far from the rst natural frequency of the system. Yanfang et al. [12], in 2009, introduced a piezoelectric micropump with a saw-teeth microchannel. They fabricated and tested this micropump against the traditional diuser and showed that their saw-teeth micropomp produces higher maximum ow rate. They also tested the pump with dierent driving voltages and frequencies under the sine, square and ramp signal. They were only able to show the maximum ow rate and maximum pressure head of the pump.
The pump's performance obviously depends on the shape of the waveform. As far as the authors of this work are concerned, there have been no numerical studies of the waveform eect on ow behavior in a
micropump. The experimental work, some of which are mentioned above, can only produce some global results, such as maximum ow rate or head, with some degree of accuracy. This is mainly due to limitations on the measurement devices and experiments. Thus, the details of the ow, such as instantaneous velocity and ow rate, and ow structure inside the micropump, cannot be obtained by experiments accurately and, thus, are not presented. The aim of this work is to simulate 3-D ow inside micropumps and study the ow structures to understand and obtain further insight regarding micropump performance when the driving voltage waveform and frequencies are changed. In this paper, the eects of driving voltage waveform on the performance of a piezoelectrically actuated microp-ump are investigated using a three-dimensional model, considering a tri electro-mechanical-uidic coupling. Details of the ow inside the micropump are presented and discussed.
2. Governing equations and numerical method 2.1. Fluid ow
The ow was assumed to be laminar, incompressible and Newtonian. Conservation equations for mass and momentum in the Cartesian coordinate can be expressed as unsteady three-dimensional Navier-Stokes equations:
f@U@ti+f@x@
j(UjUi) =
@P @xi
+@x@
j
f
@Ui
@xj +
@Uj
@xi
; (1)
and equation of continuity: @Uj
@xj = 0; (2)
where U is the velocity vector, x demands for direction, f is the density of uid, f is the uid viscosity, P is
the pressure, and indexes, i and j, indicate the 3-D coordinate directions. These equations are integrated over a control volume and discredited with the nite volume based technique to be used in the numerical solution process. Second Order Backward Euler is used for discretization of transient terms. Advection terms are discretized using a high resolution scheme, which is a bounded second-order upwind biased discretization. A co-located grid layout was used. However, various terms in the equations require solutions or solution gradients to be approximated at integration points. Finite element shape functions are, consequently, used to evaluate the solution and its variations within mesh elements.
2.2. Structural part
Considering transient dynamic analysis for the struc-tural part, the basic equation of motion can be ex-pressed according to Newton's second law:
ij;j+ fi= sui; (3)
where is the stress tensor, f is the body force, s
is the density and u is the displacement vector. The relationship between the strains and the displacements and charge equation of electrostatics, are:
"ij= (ui;j+ uj;i)=2; (4)
Di;i= 0; (5)
Ei= ;i: (6)
Here, " is the strain tensor, D is the electric displace-ment vector, E is the electric eld and is the electrical potential.
In linear piezoelectricity, the equations of elas-ticity are coupled to the charge equation of electro-statics by means of piezoelectric constants. Therefore, piezoelectric constitutive equations can be expressed in strain-charge form as:
i;j= CijklE "kl ekijEk; (7)
Di= eikl"kl+ "sikEk: (8)
In the above equations, CE
ijkl demands for elastic
material constants and ekij is the piezoelectric stress
constants.
The boundary conditions for uid-solid interac-tion consist of a no slip condiinterac-tion and interface conti-nuity in traction replaced by a conticonti-nuity of stresses:0
s
ijnsj+ Fijnsj = 0; (9)
where n is the outward unit vector, and s and F represent solid and uid properties, respectively. 3. Multi-eld analysis
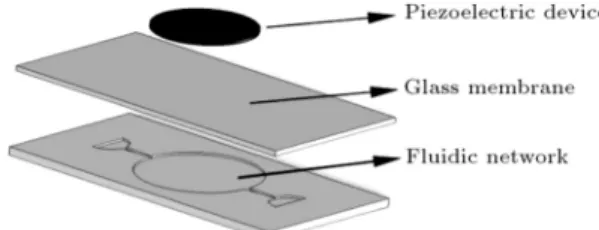
A schematic of the micropump components is shown in Figure 1. In this study, commercial software packages, Ansys and Ansys-CFX, were adopted for the simulation
Figure 1. A schematic of the micropump.
of the uid ow and the structural part, respectively. The generated grid for the uid domain consists of tetrahedral elements and it is smoothly adapted for high velocity gradient regions. The simulation in-cludes almost all the physical aspects of the working mechanism, such as the piezoelectric eect and two way uid-solid interactions. In other words, there are two dierent levels of multiphysics behavior contain-ing electrical-structural couplcontain-ing and structural-uidic coupling eects considered in this paper. A node-to-face mapping is used to interpolate loads between dis-similar meshes on either side of the coupling interface. Each eld solver advances through a sequence of multi-eld time steps and stagger (coupling) iterations within each time step. During every stagger iteration, each eld solver collects the loads that it requires from the other eld solvers and then solves its physics elds.
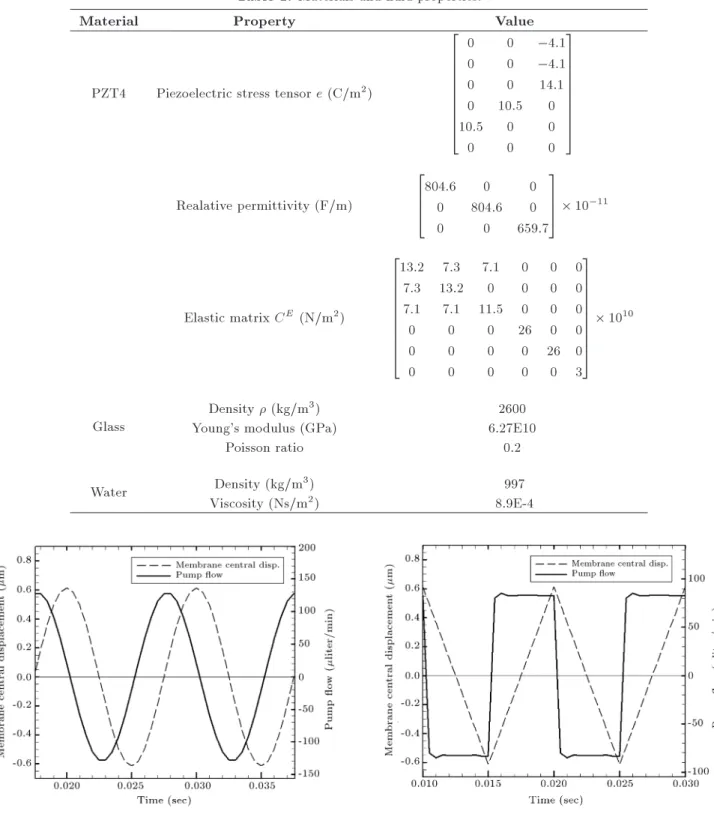
In the proposed micropump, the PZT is 5 mm in diameter and 200 m in thickness. The vibrating diaphragm is 6 mm in diameter and 300 m in thickess. The depth of the planar micropump is 120 m. The peak to peak driving voltage is the same for all cases and is equal to 80 V. The main dimensional parameters for the nozzle valves are shown in Figure 2, which are chosen for an optimized condition based on Olsson's experiments [3]. Material properties used in the analysis of the micropump are shown in Table 1. The pressures at the inlet and outlet of the micropump are atmospheric pressure. The time step was chosen as 1/25 of the period time and was checked to be independent from the nal solution.
4. Results and discussion
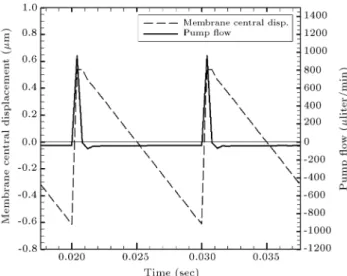
The solution is converged after 3 or 4 periods in most cases. The pump ow is calculated at the outlet valve. The maximum membrane displacement and net ow rate versus time are reported in Figures 3 to 6 for dierent wave shapes and a frequency of 100 Hz. The net ow rate is avraged over a period. For simplicity and better comparison, we assume that when the chamber is upward and the displacement is positive, the ow direction has also a positive sign, which causes the ow to stream into the chamber. Because the driving frequency is low enough, the membrane displacement follows the same manner as the input voltage, except
Table 1. Materials and uid properties.
Material Property Value
PZT4 Piezoelectric stress tensor e (C/m2)
2 6 6 6 6 6 6 6 6 6 4
0 0 4:1
0 0 4:1
0 0 14:1
0 10:5 0
10:5 0 0
0 0 0
3 7 7 7 7 7 7 7 7 7 5
Realative permittivity (F/m)
2 6 6 4
804:6 0 0
0 804:6 0
0 0 659:7
3 7 7
5 10 11
Elastic matrix CE (N/m2)
2 6 6 6 6 6 6 6 6 6 4
13:2 7:3 7:1 0 0 0
7:3 13:2 0 0 0 0
7:1 7:1 11:5 0 0 0
0 0 0 26 0 0
0 0 0 0 26 0
0 0 0 0 0 3
3 7 7 7 7 7 7 7 7 7 5
1010
Glass
Density (kg/m3) Young's modulus (GPa)
Poisson ratio
2600 6.27E10
0.2 Water Density (kg/m3)
Viscosity (Ns/m2)
997 8.9E-4
Figure 3. Pump ow and membrane displacement versus time for sinusoidal excitation.
for small deviations after sudden jumps in square and sawtooth excitations, as shown in Figures 5 and 6. For this reason, the voltage distribution is not included in the diagrams.
Figures 3 and 4 show that there is a phase dierence between displacement and ow rate for sinusoidal and triangle excitations. In other words,
Figure 4. Pump ow and membrane displacement versus time for triangle excitation.
the phase of pump ow lags behind the displacement phase by about a quarter of a period. This can be easily explained if one considers the derivative of the displacement diagram. Indeed, pump ow follows the same manner as membrane velocity. Even for sawtooth and square waves, the ow behavior is rather similar to the derivative of the displacement.
Figure 5. Pump ow and membrane displacement versus time for sawtooth excitation.
Figure 6. Pump ow and membrane displacement versus time for square excitation.
From Figure 6, it is also evident that there is a sudden change in ow rate at half the period time, while very low pump ow is attained along the cycle. For better understanding of this behavior, let us consider the ow inside the pump for a square wave and one period of time. Velocity vectors in the micropump centerplane at dierent times of one period is depicted in Figure 7. At t = 0:030 sec, there is a sudden upward movement for the membrane. It causes the ow to stream from both inlet and outlet into the chamber with maximum velocity. Therefore, ow velocity is high at the throat and entrance of the nozzles (that is, in regions A and C (Figure 7)). From velocity vectors, distribution at the middle part of the half cycle, e.g. t = 0:033 sec in Figure 7, it can be easily seen that high velocity is more prominent in region C just after the jet enters the chamber. While the membrane position is nearly constant during the
Figure 7. Top view of the proposed micropump and velocity vectors distribution at the centerplane for dierent times during a period.
half cycle between t = 0:030 and t = 0:035 sec, the vortices grow instantly in region C after the sharp rise in membrane displacement. The summit starts to move towards the center of the chamber with time increment. As a result, strong vortices block the jet ow, and backward streams start to produce. This is why the pump ow reaches a plateau with very low ow rate between t = 0:030 and t = 0:035 sec in Figure 4. For the next half cycle, the chamber behaves like a source and pushes the ow out of the pump. At this time, the ow velocity is high, mostly in region A.
In contrast to the sinusoidal waveform, whose membrane position changes dynamically with the time,
Figure 8. Pump ow versus driving frequency for dierent waveforms.
in square wave one, the ow has enough time to form the vortices at high velocity gradient regions because of consistency in membrane position. Consequently, strong vortices obstruct the ow in the region and backward streams grow rapidly. Considering the whole phenomena for a full cycle, one can conclude that the more sharp jump in wave form, the more pump ow can be attained at the outlet. In other words, sharp waveform excitation assists inlet and outlet valves in diodicity property. In the rst half cycle, large vortices are generated in region C, which result in a lower ow rate in comparison with the next half cycle in which the ow is in an opposite and favorite direction. The same scenario is repeated for region A during a cycle.
The mean pump ow versus working frequency is depicted in Figure 8 for dierent waveforms. This analysis is justied, implementing a wide range of driving frequency from 50 to 1000 Hz. It is seen that the upward trend of ow rate for square excitation is hastened at high frequencies and there is a large dierence in ow rate compared to sinusoidal and triangular ones.
The above mentioned phenomenon of vorticity generation can be used to explain what lies behind the maximum ow rate gained for square excitation. The sawtooth waveform also produces large amount of ow rate compared to the sinusoidal and triangle ones. Similarly, sharp edges with a steep slope cause the same phenomenon explained for the square wave.
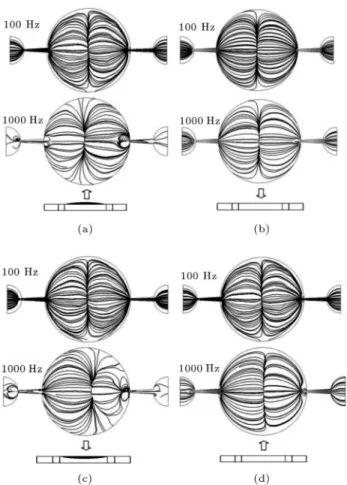
Figure 9 shows streamline patterns at dierent times for frequencies of 100 Hz and 1000 Hz. In this gure the sinusoidal signal is used for driving voltage, and the ow patterns were ploted for four major membrane positions during one period. As mentioned before, for square wave excitation, backward streams magnify the pump ability to push more ow out of
Figure 9. Streamline patterns for two dierent frequencies of sinusoidal excitation at several times: a) Membrane in crest position; b) membrane in medial position moving down; c) membrane in trough position; and d) membrane in medial position moving up.
the chamber. As seen in Figure 9, there are no major vorticies in the uid region for sinusoidal excitation and a frequency of 100 Hz. Meanwhile, the streamlines show that backward ow is more notable when the driving frequecy is 1000 Hz. Here, the ow behavior is the same as that explained for square excitation at 100 Hz. Therefore, considering the generated vortices in the ow will help to explain the increment of pump ow with frequency rising for sinusoidal excitation. Nevertheless, in this case, the vortex generation itself is due to larger membrane displacement at higher frequencies.
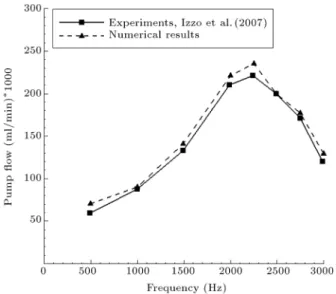
A micropump with a cylindrical chamber, like that reported by Izzo et al. [13], in 2007, was used to validate the accuracy of the developed model in simulation of micropump behavior. In Figure 10, the maximum ow rate versus driving frequency is depicted. It shows good agreement between experi-mental data and simulation results. It is also evident that numerical ndings have given a correct intuitive peak frequency value. Therefore, the coupled nite element-nite volume method can be used for further investigations in the future.
Figure 10. Pump ow versus driving frequency at zero pressure.
5. Conclusions
In this study, a three-dimensional model of a piezo-electric micropump with nozzle-diuser valves was modeled numerically. A transient analysis was carried out considering tri electro-mechanical-uidic coupling eects. However, the main concern is regarding wave-form inuence on the perwave-formance of the pump in a wide range of driving frequencies. The results are summarized as follows:
1. Square wave excitation causes the most remarkable amount of ow rate among all investigated cases for the entire range of frequencies studied. The story behind this behavior can be explained by the vortices generated in the ow.
2. Among studied waveforms, sinusoidal excitation seems to have a notable phase dierence between ow and membrane displacement at the working frequency.
3. At low working frequency, the membrane displace-ment mostly follows the same manner as excitation voltage. For higher frequency, the membrane may behave quite dierently.
4. Because a sawtooth wave also can pump a large amount of ow during a period, one can conclude that the deeper the sharp exists in the waveform, the more pump ow can be obtained.
5. As the working frequency increases, larger mem-brane displacement is gained. Consequently, it causes a steady rise in net pump ow rate. The upward trend in ow rate for square excitation is hastened at high frequencies and there is a large dierence in the ow rate compared to sinusoidal and triangle ones.
6. At higher frequencies, vortices grows in uid ow and magnify the ability of the pump to push more ow out of the chamber.
7. The validation process shows that the present model can predict the resonance behavior of mi-cropumps with good accuracy.
Abbreviations
MEMS Micro-Electro-Mechanical Systems NVP No-Moving-Part
PZT Lead Zirconate Titanate References
1. Stemme, E. and Stemme, G. \A valveless diuser/nozzle-based uid pump", Sensors and Actuators A, 39, pp. 159-167 (1993).
2. Forster, F.K., Bardell, R.L., Afromowitz, M.A., Sharma, N.R. and Blanchard, A. \Design, fabrication and testing of xed-valve micro-pumps", Proc. ASME Fluids Eng. Div. ASME, 234, San Francisco, pp. 39-44 (1995).
3. Olsson, A., Larsson, O., Holm, J., Lundbladh, L., Ohman, O. and Stemme, G. \Valve-less diuser mi-cropumps fabricated using thermoplastic replication", Sensors and Actuators A, 64, pp. 63-68 (1998).
4. Olsson, A., Stemme, G. and Stemme, E. \Numerical and experimental studies of at-walled diuser ele-ments for valve-less micropumps", Sensors and Actua-tors A, 84, pp. 165-175 (2000).
5. Ullmann, A., Fono, I. and Taitel, Y. \A piezoelectric valve-less pump-dynamic model", Journal of Fluids Engineering, 123, pp. 92-98 (2001).
6. Ahmadian, M.T. and Mehrabian, A. \Design optimiza-tion by numerical characterizaoptimiza-tion of uid ow through the valveless diuser micropumps", Journal of Physics: Conference Series, 34, pp. 379-384 (2006).
7. Li, S. and Chen, S. \Analytical analysis of a circular PZT actuator for valveless micropumps", Sensors and Actuators A, 104, pp. 151-161 (2003).
8. Ahmadian, M.T., Saidi, M.H., Mehrabian, A., Bazargan, M. and Kenarsari, S.D. \Performance of valveless diuser micropumps under harmonic piezo-electric actuation", 8th Biennial ASME Conference on Engineering Systems Design and Analysis, Torino, Italy, pp. 693-699 (2006).
9. Yang, K.S., Chen, I.Y., Chien, K.H. and Wang, C.C. \A numerical study of the nozzle/diuser micropump", J. Mechanical Engineering Science, 222, pp. 525-533 (2008).
10. Hou, W., Das, B., Jiang, Y., Qian, S., Zheng, X., Pi, X., Yang, J., Liu, H., Zheng, J. and Zheng, Z. \Sim-ulation of the diaphragm properties of a PZT-based valveless micropump", Proceedings of the 3rd IEEE Int. Conf. on Nano/Micro Engineered and Molecular Systems, Sanya, China, pp. 449-452 (2008).
11. Cui, Q., Liu, C. and Zha, X. \Simulation and op-timization of a piezoelectric micropump for medical applications", Int. J. Adv. Manuf. Technol., 36, pp. 516-524 (2008).
12. Yanfang, G., Guoxian, Z., Jicun, R. and Zhihua, G. \Fabrication and experiment studies of the piezoelec-tric micropump with saw-tooth microchannel", CORD Conference Proceedings, 2, Shanghai, China, pp. 733-737 (2009).
13. Izzo, I., Accoto, D., Menciassi, A., Lother, S. and Paolo, D. \Modeling and experimental validation of a piezoelectric micropump with novel no-moving-part valves", Sensors and Actuators A, 133, pp. 128-140 (2007).
Biographies
Ebrahim Kolahdouz obtained his MS degree in Mechanical Engineering from Isfahan University of Technology, Iran. His thesis was on the numerical sim-ulation and experimental validation of a piezoelectric micropump with modied Tesla valves. He is currently completing his PhD degree studies on Modelling the Electro-hydrodynamics of Lipid Vesicles, at SUNY, Bualo, USA.
Kazem Mohammadzadeh was born in 1988, in Iran.
He received his BS degree in Fluid Mechanics from the University of Birjand, in Iran, and his MS degree in Thermo Fluids from Isfahan University of Technology, Iran. He is currently instructor at Foolad Institute of Technology, Iran, and a PhD degree student of Mechanical Engineering at Tarbiat Modares University, Tehran, Iran. His research interests include microu-idics, heat transfer, micropumps, and PEM fuel cells. Ebrahim Shirani obtained his PhD degree in Me-chanical Engineering from Stanford University, USA, in 1981. He is currently faculty member at Foolad Institute of Technology, Iran, and Professor Emeritus in the Mechanical Engineering Department at Isfahan University of Technology, Iran. His research interests include CFD, micro-nano uid ows, turbulence, tur-bomachinery and biouid mechanics.
Saeed Ziaei-Rad obtained his PhD degree in Me-chanical Engineering from Imperial College, London, UK, in 1997, and is currently Professor in the Me-chanical Engineering Department at Isfahan University of Technology, Iran. His research interests include vibration of smart structures and rotating machinery, experimental and analytical modal analysis, computa-tional micro and nano-mechanics, advanced composite materials.