INSTALLATION INSTRUCTIONS
Web-Mon Screen Reference Guide
E-Mon
1985 Douglas Drive North Golden Valley, MN 55422
(800) 334-3666 www.emon.com [email protected]
Dear Valued Customer,
We are pleased that you chose to buy one of our products, and want you to be just as pleased with owning it. Before installing your new E-Mon product, please read the information on the following pages carefully.
We believe that you will find the E-Mon D-Mon meters easy to install and to use for monitoring and evaluating your electrical usage.
To be sure that you are 100% satisfied with your products, we provide toll-free technical and sales support Monday through Friday, 8:00 am to 7:30 pm, EST:
(800) 334-3666. You may also reach us via email at [email protected].
If you have questions, we can handle them quickly and effectively with a telephone call. Please let us try to help you BEFORE you remove your meter. And to help us help you, we ask that you have all relevant information on hand when you call (model or part numbers, nature of difficulty, etc.)
Be sure to forward this manual to the owner after installation is complete, so that they may use it as a reference guide when reading the E-Mon D-Mon meter.
SCREEN REFERENCE
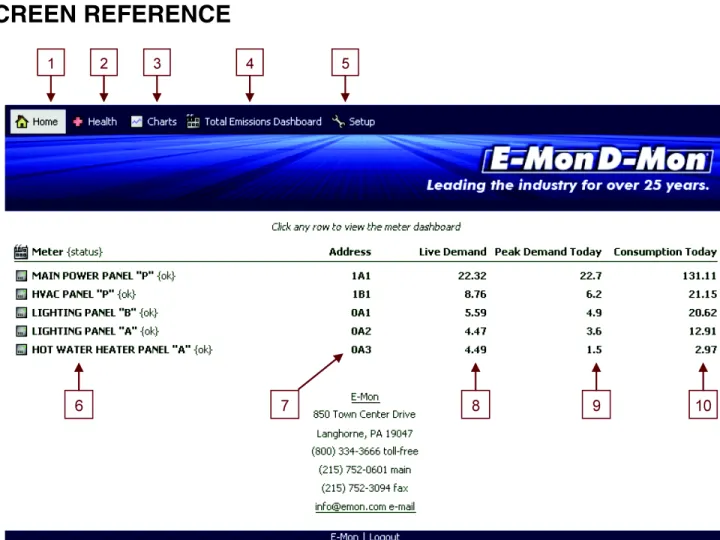
Fig. 1. Screen Reference 1. Home __ Link to this page.
2. Health __ Link to health and diagnostics. This link will blink when there are open alarms.
3. Charts __ Link to comparison charts.
4. Total Emissions Dashboard __ Link to the emissions dashboard for all meters in system.
5. Setup __ Link to the setup screen. Only available to administrative users.
6. Meter title __ Each row represents a meter and links to a meter dashboard. This column displays the title and status of the meter. The following are possible status values:
(a)OK __ The meter has no problems. (b)Fault __ There is an error condition.
(c)Disabled __ The meter has been disabled in this application. (d) Down __ Communications with the meter are down.
(e) Alarm / Unacked Alarm __ The meter has an alarm on the alarm console. Unacked means an alarm is unac-knowledged.
7. Address __ The E-Mon address of the meter.
8. Live Demand __ The approximate real time demand.
9. Peak Demand Today __ The peak demand of the day.
HEALTH
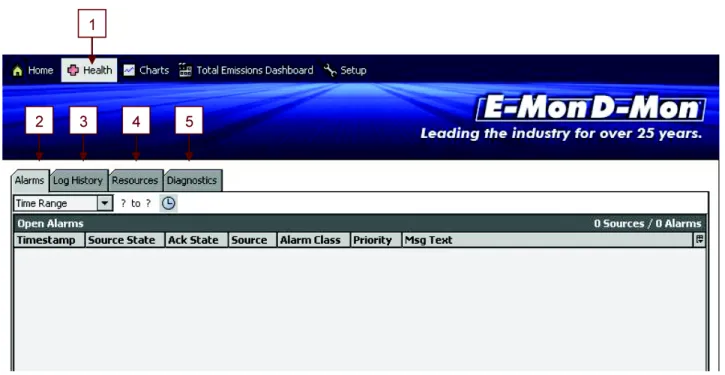
The Health page provides information that can be used to diagnose problems with your Web-Mon.
Fig. 2. Health Page
1. Health __ The health link will blink with red text when there are open alarms. An alarm is “open” if it is unacknowledged or is still in an abnormal state.
2. Alarms __ The alarm console.
1. Log History __ The system event log.
2. Resource __ Resource utilization such as memory and CPU.
ALARMS
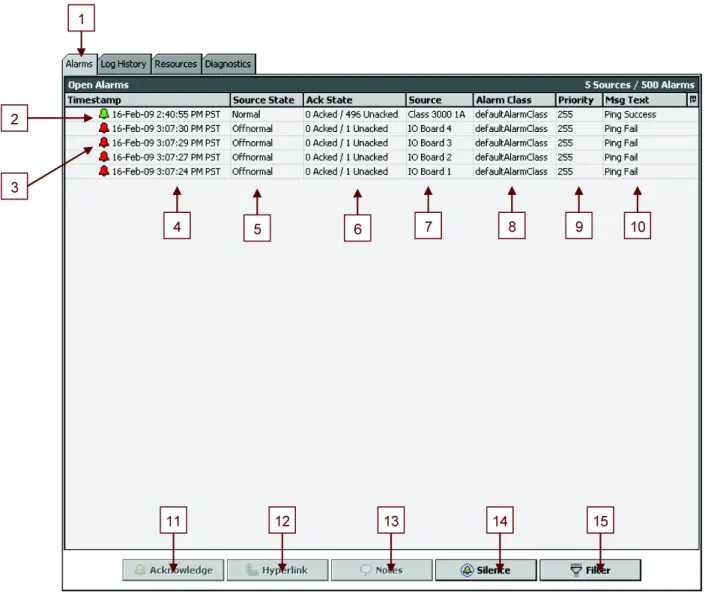
The alarm console allows you to view everything that is, or was an abnormal condition. The main intent of the page is to alert you to the fact that something is wrong. All you need to do on this page is acknowledge alarms to close them out.
Each row represents the most recent alarm from a single source. If there are multiple alarms for a single source, double clicking the row will show all of the alarms. Double clicking a single alarm will then show more details about a specific alarm.
Fig. 3. Alarm Screen
1. Alarms __ The alarm console is accessible on the Alarms tab on the Health page.
2. Green Icon __ The alarm source has returned to a normal state.
3. Red Icon __ The alarm is in an abnormal state.
4. Timestamp __ The time the alarm was created. If a row represents multiple alarms, it is the time of the most recent alarm.
5. Source State __ Whether or not the alarm source has returned to a normal state.
6. Ack State __ How many alarms have been acknowledged, or not, for the alarm source.
7. Source __ The source of the alarm.
8. Alarm Class __ At this time, only default Alarm Class is used.
9. Priority __ This will always be 255.
10. Msg Text __ Description of the most recent alarm in the row.
11. Acknowledge Button __ Use this to acknowledge alarms. Acknowledged alarms will remain in the alarm console if they are still in an abnormal condition.
12. Hyperlink Button __ Always disabled at this time.
13. Notes __ Notes can be added to alarms.
14. Silence __ Silences continuous sounding alarms. This application does not have any at this time.
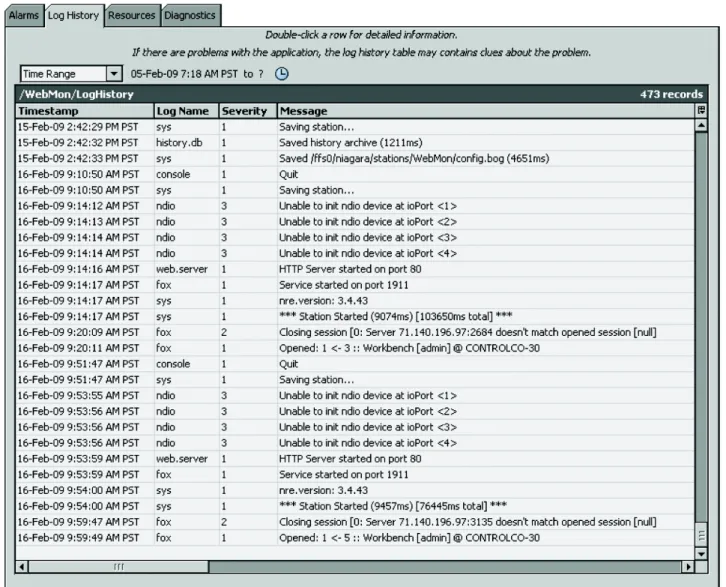
LOG HISTORY
The log history table contains significant events which could be useful when trouble shooting problems.
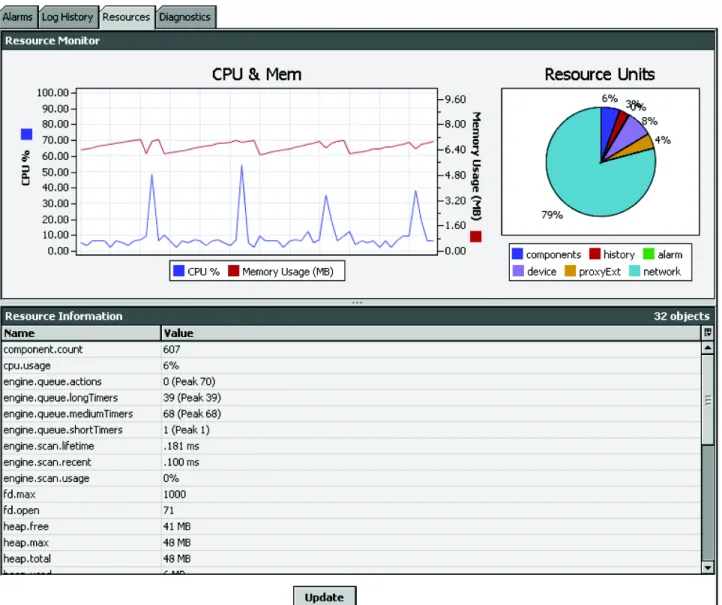
RESOURCES
This tab displays information such as CPU and memory utilization.
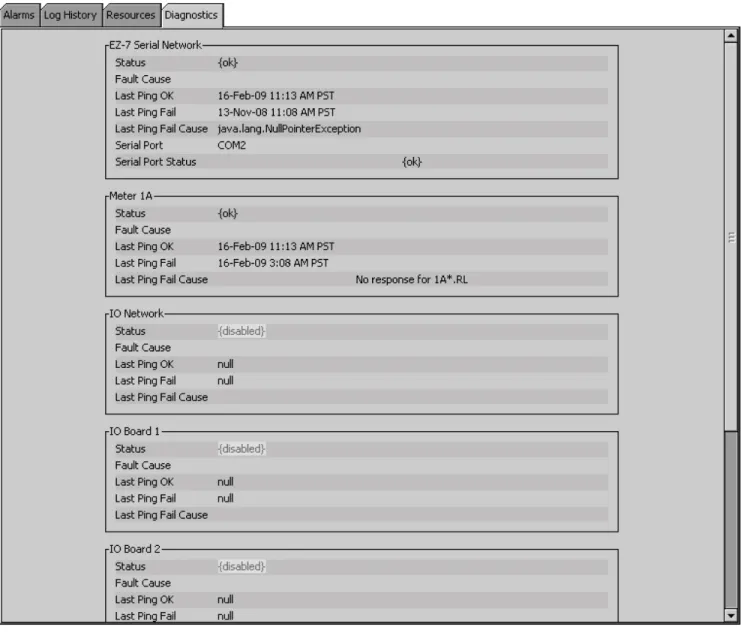
DIAGNOSTICS
This tab displays the status of integrated hardware such as meters and IO modules.
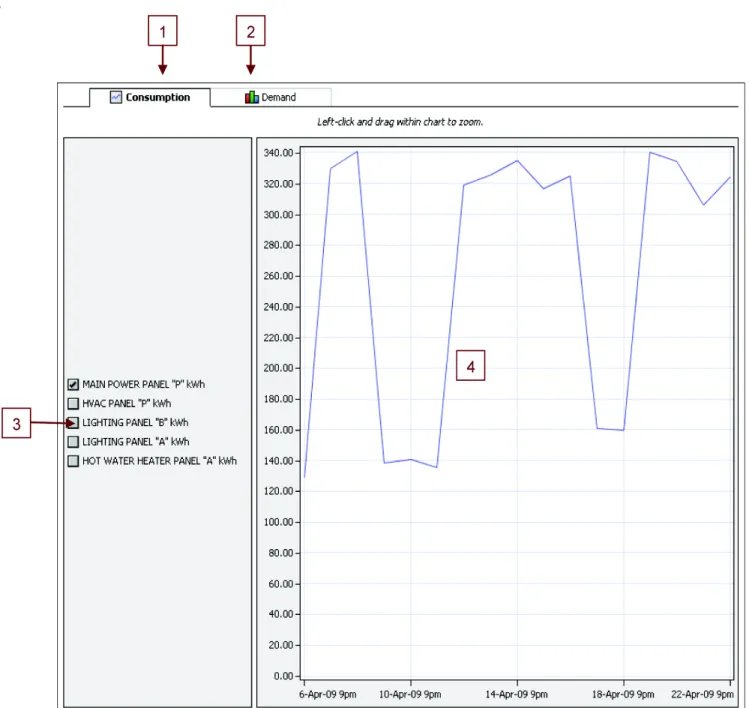
CHARTS
Consumption
This chart allows you to compare the daily consumption of selected or all meters. The chart shows all data available; left-click within the chart to zoom
.
Fig. 7. Consumption Chart Screen 1. Consumption __ The current page.
2. Demand __ Links to demand comparison chart.
3. Meters __ Check or uncheck meters to draw them on the chart. The consumption units are added to the meter title.
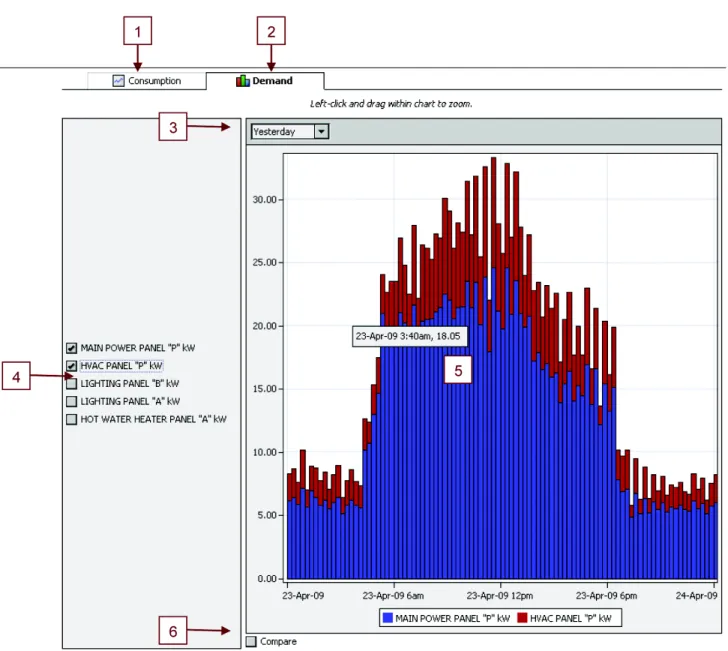
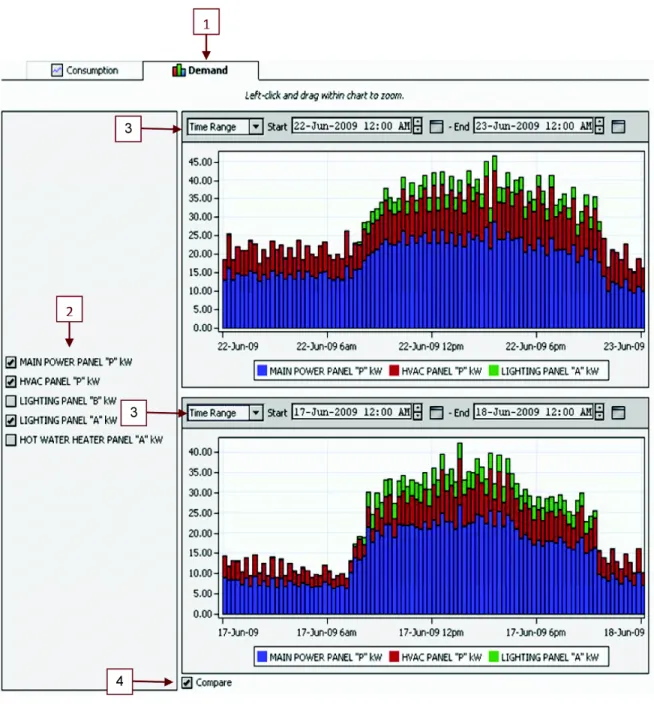
DEMAND
This chart allows you to view demand of one meter or coincidental demand for multiple meters.
DEMAND CONTINUED
Checking the compare box at the bottom of the demand chart screen will display two charts allowing you to compare the same set of meters but for different time ranges.
Fig. 9. Demand Screen 1. Demand __ The current page.
2. Meters __ Check or uncheck meters to include them on the chart.
3. Time Range __ Many time range options are available in the drop down.
TOTAL CARBON FOOTPRINT EMISSIONS
This page allows you to view the environment impact of all the electrical meters being monitored by Web-Mon.
Fig. 10. Emission Screen
1. kWh Today __ Consumption of all electric meters for the current day. Meters not designated as “electric” in their setup screen are ignored.
METER DASHBOARD
This page provides a snapshot view of a single meter in both tabular and graphic formats. To view a meter dashboard, go to the Home page and click the desired meter to view.
Fig. 11. Meter Dashboard Screen 1. Meter Dashboard __ This page.
2. Interval Data __ Link to 15 minute interval data table. 3. Daily Data __ Link to daily data table.
3. Emissions Dashboard __ Link to the emissions data for the specific meter. Only available for electrical meters.
4. Settings __ Link to settings page for the meter. Only available to admin level users.
5. Demand Dial __ Real-time demand of the meter. The max value is the max ever recorded. Right-click the max value to reset it.
6. Description __ On the settings page, this is the description field of the meter.
7. Meter Title __ This is the title field from the meter setup page. The E-Mon address of the meter is automatically appended in parentheses.
8. Statistics Table __ The “Last X Days” do not include the current day. The Demand column is the peak 15 minute average.
9. Consumption Dial __ Daily consumption of the meter. The max value is the max ever recorded. Right-click the max value to reset it.
10. Meter Power Quality Table __ Additional data available only to Class 3000, Class 5000 and V-Class meters.
11. Time Period __ Many standard time period options are available along with user defined options in this drop down. The dif-ference between the “previous” and “current” options is that current includes the current day; previous does not.
INTERVAL DATA
This page displays a table of 15 minute interval records containing the demand, consumption and VARH (when applicable). The time range of the table is customized and the data can be exported in a variety of formats.
Fig. 12. Interval Data Screen 1. Meter Dashboard __ Link to the meter dashboard.
DAILY DATA
This page displays a table of daily records containing the total consumption of each day, the peak demand and the timestamp of the peak demand. The time range of the table is customizable and the data can be exported in a variety of formats.
Fig. 13. Daily Data Screen 1. Meter Dashboard __ Link to the meter dashboard.
2. Interval Data __ Link to Interval Data page.
3. Daily Data __ Table of daily data including consumption, peak demand and peak time stamp.
4. Emissions Dashboard __ Link to the emissions data for the specific meter. Only available for electrical meters.
5. Settings __ Link to settings for the meter. Only available to admin level users.
6. Time Period __ Many standard time period options are available along with user defined options in this drop down. The dif-ference between the “previous” and “current” options is that current includes the current day; previous does not.
7. Meter Description __ This is the description field from the meter setup page.
8. Meter Title __ This is the title field from the meter setup page. The E-Mon address of the meter is automatically appended in parentheses.
9. Table Export __ This button gives you the option to export the table in various formats.
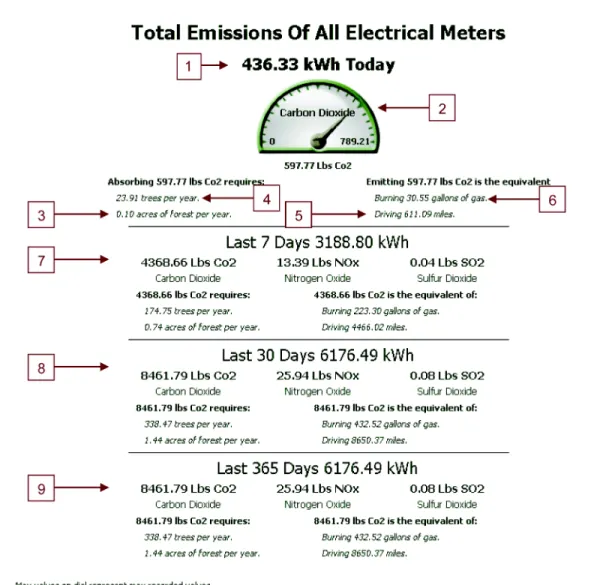
METER CARBON FOOTPRINT EMISSIONS DASHBOARD
This page allows you to view the environmental impact of a specific meter based on consumption.
Fig. 14. Emissions Screen
1. kWh Today __ Consumption of specified electric meters for the current day. Only available for electric meters.
2. Carbon Dioxide Dial __ The equivalent Carbon Dioxide emissions for the day. The max value represents the max value ever recorded. Right click on the max value to reset it.
3. Forest Acres __ Acres of forest required to absorb the Carbon Dioxide in one year.