© 2009, Markov Processes International, LLC Introduction
Since its introduction in the early 1990’s returns-based style analysis (RBSA) has been mainly applied to equity portfolios with researchers citing high correlation among fixed income factors as the major obstacle in obtaining robust results. In this paper, we demonstrate how using RBSA and high-frequency data can help improve the speed and accuracy of quantitative analysis.1 The result is a more robust and confident fixed income due diligence process.
An analysis of Oppenheimer Core Bond is used to introduce each part of the recommended quantitative approach as if it were applied ex ante.2 This fund has received considerable public attention due to its poor performance and prevalent use in several 529 college saving plans. As reported in the April 14, 2009, Wall Street Journal article, “Oregon Sues Over Risk Taken in its 529 Fund,” a class action lawsuit was filed against Oppenheimer Funds Inc. charging that the firm understated the risk of the bond fund. Our analysis shows how an investment research analyst equipped with proper tools and methodologies could have been alerted to the fund’s risks long before its collapse.
The Approach
Establish Baselines: Market Factors, Quantitative and Qualitative Measures
Careful consideration in determining which market factors, quantitative measures and qualitative characteristics to use requires time and experimentation. Some investment products and asset classes may share similar market factors and quantitative measures, while others require completely
1 All research, tables and charts were produced with MPI Stylus™.
Mutual fund data source: Morningstar, Lipper/Reuters.
2 “Red Flag” markers are displayed where more aggressive action
may have been warranted.
different ones. To begin, however, one should map each product to a pre-assigned set of factors and measures. A very simple mapping matrix is shown below for Oppenheimer’s Core Bond (the qualitative
portion is illustrative and not addressed in this analysis).
CATEGORY ASSIGNMENTS
Peer Group Benchmark
Intermediate-Term Bond BC Aggregate
FACTOR AND MEASURE ASSIGNMENTS RBSA Factors Quantitative Qualitative Fixed 12* VaR, Std. Dev,
Dist. Properties
People, Compliance, Operations, Liquidity
* See Appendix section for specific market factors.
Once the mapping is completed for all required product segments, more automation and systematic analysis can be initiated across larger data sets.
Step 1: Top Down Risk/Return Profile
A typical top-down approach involves analyzing a fund’s risk/return characteristics versus its benchmark and peer group. Oppenheimer Core Bond Fund is benchmarked against Barclays Aggregate Bond Index (formerly Lehman Brothers Aggregate Bond Index) and a peer group benchmark that is an average of all funds classified by Morningstar as “intermediate-term bond”.
In the summary table below, the first four moments are computed for risk/return and distribution measures for the period between 1/05 and 12/07. Sharpe Ratio and max-drawdown statistics are included to measure risk-adjusted returns and extreme risk, respectively. Daniel Li, PhD
Research Analyst June 2009 Markov Processes International Tel +1 908 608 1558 www.markovprocesses.com
Quantitative Due Diligence of
Fixed Income Portfolios
A case study of the Oppenheimer Core Bond Fund
June 2009 Markov Processes International Tel +1 908 608 1558 www.markovprocesses.com
© 2009, Markov Processes International, LLC Page 2 Based upon Table 1, the fund underperforms the
benchmark and has lower total risk, but has return distribution characteristics almost identical to its peer-group average. Thus, in this case, traditional static distribution measures3 don’t provide any warning signs that could have alerted an investor of the fund’s
future woes. Trend-oriented analytics can further refine the narrative. Figure 1 indicates the fund’s return began deviating from its benchmark and peer group beginning in 2008. The trend continued, and the fund ended the year with a staggering loss of 35% relative to a gain of 5% and a loss of 3% for the benchmark and peer group, respectively.
Figure 1
Fund Return vs. Benchmark/Peer Return
Created with mpi Stylus
Cumulat ive Performance
60 70 80 90 100 110 120 130 Gr ow th o f $100
Dec-04 Dec-05 Dec-06 Dec-07 Mar-09
Oppenheimer Core Bond A BC Aggregate Bond Peer Benchmark
Step 2: Returns-Based Style Analysis: Comparison to “Baseline” Market Factors
Running style analysis for peer group averages and associated benchmark return streams can help determine a meaningful set of baseline market factors to use as a starting point.
3
Static measures, such as Sharpe Ratio, do not depend on the sequence of observations in the sample and their values don’t change if the sequence is altered. Dynamic process control statistics, such as CUSUM, can also be integrated at this level but it is outside the scope of this case review.
In this case, a set of generic Merrill Lynch fixed-income indices representing major fixed fixed-income market segments were used to run a monthly style analysis on both the fund and a peer group average benchmark through Dec 2007. The factor exposures of the peer group benchmark average returns shown below represent the baseline factor exposures for a typical “intermediate-term bond fund”.
As illustrated in Figure 2, the fund’s style exposure shows certain similarities with its average peer, but deviates by showing exposures to commercial mortgage-backed securities (CMBS). Higher exposure to CMBS’ beginning in 2006 stand out relative to the fund’s historic average and peer average (red flag). High R-Squared values of 92.5% and 97% for the fund and peer average indicates that the model has strong explanatory power.
Figure 2
Style Exposures: Fund vs. Peer Benchmark
Created with mpi Stylus His torical Fixe d-Incom e Style Expos ure s
0 20 40 60 80 100 We ig h t, %
Oppenheimer Core Bond A
0 20 40 60 80 100 We ig h t, %
Jan-98 Dec-99 Dec-01 Dec-03 Dec-05 Dec-07
Peer Benchmark
High_Yield Corporates Structured_CMBS Structured_ABSFloating Mortg_FNMAFHLMC Mortg_GNMA Gov _Agency _AAA Gov _Notes_Bonds
Step 3: Monitoring of the Fund’s Performance
Ongoing monitoring and comparing the fund’s performance to its peers and benchmark, as shown in Figure 1, have their limitations as they do not provide insight into whether observed deviations in performance are the result of the fund’s composition being different than its benchmark and peer average or if structural changes are occurring within the fund itself. A better way to monitor the fund’s deviations for potential signals is to compare its performance, out-of-sample, to its own ex ante dynamic style portfolio.4
A simulated portfolio is constructed by using the factor exposures from month-end 12/07 (shown in
4 The same methodology can also be used for hedge fund risk
management. See Li, Markov, Wermers (2009).
Table 1
Summary Statistics
Name Opp. Core
Bond
Peer. Avg. BC Agg Bond Return 3.89 3.82 4.56 Std Dev 0.70 0.71 2.80 Skewness -0.10 -0.17 -0.17 Kurtosis -1.13 -1.10 -1.07 Sharpe Ratio -0.19 -0.21 0.08 Max Drawdown -1.54 -1.67 -1.81
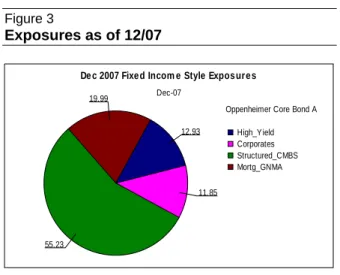
© 2009, Markov Processes International, LLC Page 3 Figure 3 below).Those returns are then compared with
actual fund returns through calendar 2008.
Figure 3
Exposures as of 12/07
Created with mpi Stylus De c 2007 Fixe d Incom e Style Expos ure s
Dec-07 19.99
55.23
11.85 12.93
Oppenheimer Core Bond A High_Yield Corporates Structured_CMBS Mortg_GNMA
Actual returns versus simulated returns (the projected returns of the “style” or “tracking” portfolio) should be expected to track one another closely provided that the exposures remain relatively stable throughout 2008. Figure 4 indicates otherwise. Dispersion between simulated and actual returns dramatically widened in the third quarter of 2008. This indicates that exposures further changed from the end of 2007.
Figure 4
Actual Returns vs. Simulated Returns
Created with mpi Stylus Actual Re turns vs . Sim ulate d Re turns
55 60 65 70 75 80 85 90 95 100 105 Gr ow th o f $10 0
Nov -07 Mar-08 Jun-08 Sep-08 Dec-08 Mar-09
Oppenheimer Core Bond A Simulated Returns with Dec. 2007 Exposures
In order to further understand what changes occurred in the fund’s portfolio that eventually led to the fund’s losses in Sep-Nov of 8%, 12%, and 19% consecutively, we extend the style analysis through August 2008.
In this portion of the analysis, we adjust a model parameter to include “leverage”. By doing this, the model can compute negative cash exposures and help to detect leverage inside an investment portfolio. As
shown in Figure 5, the model detects negative cash exposure along with proportionate increases in the fund’s other exposures. At the end of August 2008, fund exposures totaled 170% of net assets on a dollar basis. In other words, the returns-based analysis indicates that $1.70 worth of shareholder capital was exposed to movements in a very risky portion of the credit markets (red flag). At this point, one might conclude that the fund not only made a bad sector bet, but applied leverage to this bet – keeping in mind that this analysis is not looking at actual holdings.
Figure 5
Style Analysis through August 2008
Created with mpi Stylus His torical Fixe d-Incom e Style Expos ure s
-70 -50 -30 -10 10 30 50 70 90 110 130 150 170 W e ight , %
Sep-03 Dec-04 Dec-05 Dec-06 Dec-07 Aug-08
Oppenheimer Core Bond A
High_Yield CMBS Fixed Rate AA CMBS Fixed Rate AAA Corporate Master Mortgage Master Index Cash
It is important to note that leverage in this case refers to “implied leverage” rather than the traditional leverage as borrowing on margin. Implied leverage could be a result of holding fixed-income derivatives (i.e. leverage products) such as total default and return swaps (instruments held by the fund).5
Step 4: Identify Risks with More Accuracy and Speed – Incorporate Daily/Weekly Data
In the class-action lawsuit filed against the Oppenheimer Core Bond Fund, analysts claimed that rapid changes in the fund’s risk profile, along with delays of publicly available SEC holdings made attribution and detection of the fund’s risks difficult. High-frequency data, such as daily and weekly, can enhance analysis and be used as an effective method to improve the timeliness of getting such information.
As the first step, using the fund’s daily return data through the end of May 2008, a conventional value at risk chart is constructed in Figure 6. As illustrated, the fund’s daily risk nearly doubled and continued to
5 For detailed holdings information, please refer to Oppenheimer
Core Bond Fund Management Commentaries and Annual Report, Dec. 31, 2008.
© 2009, Markov Processes International, LLC Page 4 increase entering 2008 (red flag), indicating a strong
loss potential for the fund’s portfolio. Therefore, just the volatility of the fund’s daily NAVs in Jan-Feb 2008 could have provided an early warning.
Figure 6
Historical Daily VaR
Created with mpi Stylus 95% Rolling VaR 0 1 2 3 95% VaR , % 05/05/06 12/29/06 06/29/07 12/28/07 05/23/08 Total
Oppenheimer Core Bond A BC Aggregate Bond
Interestingly, during this same period, the fund’s manager, Angelo Manioudakis, noting excessive market volatility, expressed optimism regarding the CMBS performance potential. He was quoted in a March 2008 Wall Street Journal article stating, “The implied losses are so severe that under any reasonable scenario you can’t justify these levels. There is still huge value.”
The daily VaR number, while being a useful measure, does not provide an indication of the fund’s inner risks. The fund’s holdings are not very helpful either because its derivative positions are very complex and are reported with a significant delay.
Figure 7
Weekly Style Analysis through May 2008
Created with mpi Stylus His torical Fixe d-Incom e Style Expos ure
-50 -30 -10 10 30 50 70 90 110 130 150 W e ight , % 01/07/05 12/30/05 06/30/06 12/29/06 06/29/07 05/23/08 Oppenheimer Core Bond A
High_Yield CMBS Fixed Rate AA CMBS Fixed Rate AAA Corporate Master Mortgage Master Index Cash
Insight into the fund’s implied bets and leverage is best achieved by performing a returns-based style analysis of the fund using high frequency data6. Figure 7 depicts the result of such an analysis using weekly return series of all the indices used in the monthly analysis in the previous section. Note that the results of the weekly analysis are very similar to the monthly one as of August 2008. In Figure 5, the fund significantly increased its CMBS exposures through leverage in the first days of 2008. Weekly data was able to detect this pattern several months before the monthly data.
Summary
After a fund blows up, it is often useful to look into the past to identify warning signs that investors might have been able to identify – albeit from the comfort and ease of already knowing what happened. The lesson of such an exercise is not to berate professionals for missing such warnings, but to learn how such red flags can lead to quicker action in the future. Monthly and quarterly data can make it more difficult to reliably spot the magnitude, direction and reinforcing nature of a particular trend in a timely way.
In addition, there is a prevailing tendency to resist overreacting to early warning signs. False positives can be costly in terms of resources and reputation.
The Holy Grail in the investment due diligence world is to establish and deploy methods that identify and detect problem funds ex ante with accuracy and speed. Not all approaches are created equal; some are far too complex and expensive and others simply provide limited predictive power.
This is by no means an easy task. Considerable time, experimentation, experience and judgment are required to assign and continually adjust the baselines across product types. When this is achieved, a combination of high-frequency data (i.e., daily, weekly), returns-based style analysis, and risk monitoring techniques such as value-at-risk can improve the quantitative assessments within the due diligence framework. In the case of Oppenheimer’s Core Bond fund, such techniques may have allowed investment practitioners to detect that the fund’s risk/return profile and associated exposures had changed in a more timely way. This information could have potentially been used to take more aggressive action and avoid severe losses.
6 Weekly data was used for this analysis, instead of daily, as the
results proved to be more reliable due to pricing irregularities of illiquid fixed income products, such as CMBS.
© 2009, Markov Processes International, LLC Page 5 Appendix
Historical Correlations (Jan. 06-Dec. 08)
Fixed income style analysis has sometimes garnered skepticism because many fixed income indices are highly correlated. High correlations between independent variables can influence the explanatory power and reliability of the model. In this case, however, the correlation levels were acceptable.
Opp.
Core Bond Cash
ML US Corp. Master CMBS Fixed Rate AAA CMBS Fixed Rate AA BC Aggregate Bond
Opp. Core Bond A 1.00 0.49 0.36 0.92 0.89 0.11
Cash 0.49 1.00 0.14 0.30 0.34 -0.08
ML U.S. Corp. Master 0.36 0.14 1.00 0.46 0.03 0.87
CMBS Fixed Rate AAA-Rated 0.92 0.30 0.46 1.00 0.86 0.33
CMBS Fixed Rate AA-Rated 0.89 0.34 0.03 0.86 1.00 -0.13
BC Aggregate Bond 0.11 -0.08 0.87 0.33 -0.13 1.00
Market Indices used as Factors in the Model
Index Definition M.L. Ticker
Cash M.L. U.S. 3Month Treasury Bill Index G0O0
Corporates M.L. U.S. Corporate Master C0A0
Gov_Notes_Bonds M.L. U.S. Treasury Master G0Q0
Gov_Agency_AAA M.L. AAA U.S. Agency Master G0P0
Convertibles M.L. All US Convertibles Index V0A0
Mortgage ML Mortgage Master Index M0A0
Structured_ABS M.L. Asset-Backed Securities Master Index R0A0
Structured_CMBS M.L. CMBS Fixed Rate Index CMBS
High_Yield M.L. High Yield U.S. Master II H0A0
Municipal M.L. Municipal Master Index U0A0
Preferred M.L. U.S. Preferred Stock Fixed Rate Index P0P1
References
1. W.F. Sharpe. Asset Allocation: Management style and performance measurement. The Journal of Portfolio Management, Winter 1992, pp. 7-19.
2. Frederick E. Dopfel. Fixed-Income Style Analysis and Optimal Manager Structure. The Journal of Fixed Income September 2004.
3. D. Li, M. Markov and R. Wermers. Monitoring Daily Hedge Fund Performance When Only Monthly Data is Available. SSRN Working Paper 2009.
4. S. Brown, Fraser and Liang. Hedge Fund Due Diligence: A Source of Alpha in a Hedge Fund Portfolio Strategy. SSRN Working Paper 2008.
5. Wall Street Journal. Oregon Sues Over Risks Taken In Its '529' Fund (by S. Anand and C. Karmin). 6. Wall Street Journal. 'Doomsdays' and Bargains in CMBS. March 22, 2008
© 2009, Markov Processes International, LLC Page 6 Markov Processes International, LLC (MPI) is a global provider of investment research and technology solutions. MPI’s analytical tools and methodologies are employed by the finest institutions and financial services organizations to enhance their investment research, reporting, data integration and content distribution. MPI offers the most advanced platform available to analyze hedge funds, mutual funds, portfolios and other investment products, as well as asset allocation and portfolio optimization tools.
MPI’s Stylus Pro software is utilized by alternative research groups, hedge fund of funds, family offices, institutional investors, consultants, private banks, asset managers, diversified financial services organizations as well as marketing, product development and IT departments around the world. MPI also offers solutions for investment advisors and private wealth professionals. For more information on past MPI research articles visit http://markovprocesses.com/company/research.htm
Media Contacts
Loretta Mock/Paul Damon Cognito
+1 646 395 6300