Optimization of Air Distribution Mode Coupled Interior Design for Civil
Aircraft Cabin
Pang Liping1, Li Pei1, Bai Lizhan1*, Liu Dong1, Zhou Yue2, Jun Yao3
1. School of Aviation Science and Engineering, Beijing University of Aeronautics and Astronautics (BUAA), Beijing 100191, China.
2. Jincheng Nanjing Mechanics-Electronics-Hydraulics Engineering Research Center, Aviation Industry of China, Nanjing 211102, China.
3. School of Engineering, University of Lincoln, Brayford Pool, Lincoln LN6 7TS, United Kingdom
Abstract
The airflow distribution and thermal comfort of human beings in civil aircraft cabin are influenced by many factors such as the ventilation mode, ventilation air volume, and supply air temperature and so on. Among these factors, the choice of ventilation mode in the civil aircraft cabin is also restricted by the interior and aesthetic designs. Yet few researches noticed the impact of these designs on cabin air distribution. In this paper, an optimization design method for the air distribution mode of civil aircraft will be discussed based on Computational Fluid Dynamic (CFD) method and Micro-Genetic Algorithm (Micro-GA). Two interior design structures with different luggage bin and light band will be used to investigate their influence on the design of air distribution mode. In this optimization, the position of air supply inlets and the supply air angle are defined as the optimization variables. The Predicted Mean Vote (PMV) and the air age are specially chosen as the objective functions. The relevant regulations for cabin temperature uniformity are determined as the thermal constraint conditions. The study results show that the presented method can ensure the convergence of optimization process. The Pareto Optimal Frontiers (POFs) can be obtained from this multi-objective optimization. The POFs can present the relationship of two objective functions. The preferred air distribution mode coupled different interior designs can be efficiently recommended from the optimization
results.
Keywords: Cabin interior design, Air distribution system, Thermal comfort, CFD,
Optimization Nomenclature Symbol definition ρ density t time x, y, z index of coordinates
u, v, w flow velocity in the directions of x, y and z axis
V velocity vector
p pressure
μ dynamic viscosity
S external source term
T temperature
λ thermal conductivity
cp constant pressure ratio heat capacity k kinetic energy of turbulence
ε dissipation rate of the turbulent kinetic energy
Γk2 effective diffusivity of k Γε2 effective diffusivity of ε
Gk2 generation of k due to mean velocity gradients Gb generation of k due to mean buoyancy
C1ε, C3ε, C2* constants
YM fluctuating dilatation in compressible turbulence K turbulence kinetic energy
Z*, U*, K*, T* normalized values of z, v, K, T
θ, relative error and average relative error
KSim,USim,TSim simulation values of K, v and T KExp,UExp,TExp experimental values of K, v and T
l projected length
α supply air angle
P detective point
ϕ, air age and its average value
PMV, PMV PMV and its average value ΔTH horizontal temperature difference
ΔTV vertical temperature difference
Subscripts
i ith passenger
j jth detective point location
1 Introduction
The cabin environmental comfort is becoming an important factor for passengers to choose their travailing airline [1~3]. Under this trend of development, the study of cabin environmental quality is pain more attention. In recent years, two famous research projects, Friendly Aircraft Cabin Environment (FACE) and Ideal Cabin Environment (ICE), were carried out by Europe governments [4]. Moreover, many airline companies including Airbus and Boeing also considered the cabin environment as a key competition factor. Therefore, the study of cabin environment comfort in the civil aircraft cabin is becoming a significant work for the designer of civil airlines.
The thermal environment has a very important influence on the comfort sensation of passengers. The thermal model of civil aircraft is very complex because it includes high crew density and different heat exchange patterns [5]. Consequently, many experimental and numerical researches were conducted under the assumption of static state. Based on this assumption, the air distribution in cabin is usually influenced by position of inlets, air supply angle and air temperature and other ventilation parameters [6~7].
There are many indexes to evaluate the cabin thermal environment [8]. The PMV index is the most widely used thermal comfort index. The PMV model is proposed on the base of the body heat balance theory and a lot of experimental data in an artificial climate laboratory. It is a model including many key factors such as air pressure, humidity, temperature and velocity. The PMV equation for thermal comfort is a steady-state model. The equation uses a steady-state heat balance for the human body and postulates a link between the deviation from the minimum load on heat balance mechanisms and thermal comfort vote. The International Standards Organization (ISO) 7730: 2005 uses limits on PMV as an explicit definition of the comfort zone [9].
Beside experimental way, the CFD technology is also another way to obtain the
min minimum value
field function of PMV [10]. Early scholars studied the indoor air flow and distribution in the cabin without human models. Experimental data sampled from empty cabin was used to certify their studies [11~12]. Singh et al. used some cylinder models to represent human beings and inserted them into the cabin [13]. They compared airflow in the cabin with human models with that in an empty cabin. The results presented a huge difference which indicated that airflow in an empty could not be adopted to simulate the air distribution in a real airplane.
Nowadays almost all the researchers would build the human models when they conducted experimental and numerical researches in the cabin environment. Kana Horikiri et al even assembled furniture to calculate their radiation effect to human models in the indoor environment [14]. Zhao Zhang et al. investigated the contaminant transport in a double-channel aircraft cabin [15]. Their paper concluded that the numerical result quantitatively agreed with the experimental result, while the complete consistency was very hard to be realized.
In recent years, scholars proposed some new air distribution patterns for the civil aircraft cabin and some new patterns also present a great performance. Zhang and Chen proposed a ventilation pattern that injected the fresh air from the inlets at the bottom of cabin and exhausted it at the ceiling zones [16]. Pang conducted an experiment and employed a flow visualization method with green laser to verify the performance of this air distribution pattern [17]. While new patterns often have a requirement for the adjustment of pipeline system in the airplane, and it dramatically restricts their application when considering the economic efficiency.
The best way to design an air distribution system is to start with the design objectives. An inverse design method can achieve the desirable enclosed environment with a series of evaluation [18]. The inverse design can be further divided into backward methods and forward methods. The Genetic Algorithm (GA) is a typical forward optimal method. In recent years, many scholars focused on the research of CFD inverse optimization. Their results are rich and constructive. Chen, Zhai, Zhang, Liu, et al. carried on pioneering researches about the inverse design of enclosed environments [19~21].
The air environment design in an aircraft cabin should follow some standards. The airworthiness standards are mandatory standards [22]. But it only roughly specifies air parameters in its 25.831 section. The cabin environment comfort is not forcibly regulated in the airworthiness standards. With the market competition, this factor really needs to be considered carefully. Therefore, some non-mandatory standards are often adopted. The well-known ASHRAE 55 and ISO7730 standards can evaluate the indoor thermal comfort [8][23]. The SAE ARP 85 and the ASHRAE 161-2007 are often used for the civil aircraft [24~25]. They specify cabin air parameters in detail. Some countries also use their own aviation industry standards.
Beside the heat comfort, the airflow uniformity is another important index to evaluate the design of cabin environment. The horizontal and vertical temperature differences are often used as the evaluation basis. The SAE ARP 85 only requires that the variation in temperature in a cabin zone with stabilized conditions should not exceed 2.8℃, measured in a vertical plane from 5cm above floor level to seated head height. The ASHRAE 161-2007 requires that the horizontal operative temperature variation across each temperature control zone:<4.4℃, and the vertical operative temperature variation within a seat (seat centerline):<2.8℃ variation in temperature measured at 100mm, 610mm and 1090mm. In the reference [26], the vertical temperature difference in any cabin zone should not exceed 3.5℃, and the horizontal temperature difference should not exceed 2℃.
Recently, the aesthetic and interior decoration is fast developed. This trend promotes the designers considering the influence of the aesthetic and interior decoration on the ventilation design. These two design works have a strong coupling relationship. However, there is little any effective coupling design method. In this paper, a CFD optimization method will be discussed fully considering the coupling design.
2 Research methods
The main objective of our study is to optimize the air distribution mode for civil aircraft cabin. The following describes the research methods used in the CFD
modeling and optimization process.
2.1 Numerical method
The air flow and energy transportation are controlled by a series of governing equations. In the cabin environment, the velocity and turbulence of airflow keep at a relatively low level. The Reynolds-Average Navier Stokes (RANS) equations together with the RNG k-ε turbulence model are suitable to solve the air flow and energy transportation [27~28]. The basic control equations are as follows.
Continuity equation: 0 u v w t x y z (1) Momentum equation: ( ) ( ) ( ) ( ) ( ) ( ) ( ) ( ) ( ) grad grad grad x y z u p uV u S t x v p vV v S t y w p wV w S t z (2) Energy equation: ( ) ( ) ( grad ) T p T TV T S t c (3) RNG k-ε turbulence equation[24]: 2 2 2 * 2 1 2 3 2 ( ) ( ) [ ] ( ) ( ) [ ] ( ) grad grad M k k b k b k kV k G G Y t V C G C G C t k k
(4)For the RNG k-ε model in the Fluent software, the SIMPLE algorithm is used to solve the pressure and velocity in the Fluent software. The PRESTO! scheme is adopted for pressure discretization and the first-order upwind scheme for all the other variables. The constant terms in the above equations are clearly listed in some literatures [28~29].
2.2 Micro-GA
The time consume of CFD calculation will be very enormous. In order to efficiently obtain the final optimization results, an optimization algorithm named Micro-GA is adopted in our study [30]. It will greatly decrease the working load and calculating time. Different from the other genetic algorithms, the Micro-GA includes fewer individuals in each generation and has a higher convergence rate.
In this study, the Micro-GA is programed in the modeFRONTIER software. The Micro-GA will analyze the objectives of individuals in the last generation automatically, and then generate and import new optimization variable into the CFD software. In this process, only five individuals are generated in each generation. The position of ceiling inlets, li, is taken as the optimization variable. Fig.1 shows the
integrated optimization procedure controlled by the Micro-GA. The aim of optimization process is to obtain the optimal position of inlets.
1 2 ( ) , f l f l f l 5 1, , , ,2 3 4 ll l l l l i l
Fig.1. Optimization procedure of the Miro-GA
By analyzing CFD calculation results, the Micro-GA automatically picks the local optimal individual in the father generation and transports it directly to the off-spring generation. The remainder four individuals of father generation generate
four new individuals for the off-spring generation by crossover and mutation. The whole program will run automatically until it obtains its global optimal solution.
2.3 Optimization method for air distribution system
The comprehensive environmental comfort is a subjective feeling of passenger, and it will be influenced by many factors. Among these influential factors, the thermal comfort and the interior design have main effects. The two aspects have a close relationship during their design process. The cabin thermal environment is formed by the air distribution system. But its inlet position and air supply angle are strongly constrained by the cabin interior design. The interior design of civil aircraft cabin mainly contains internal layout, luggage bin type, lighting solution and other factors. These factors will conversely impact on the design of air distribution system.
The cabin internal structure may be a single-aisle structure or a twin-aisle structure. The luggage bin type can be classified a pushing-up type or pulling-down type according to its open way, as shown in Fig.2(a) [31]. In recent years, the ceiling lighting design has become an essential part for the interior aesthetic design. Innovative lighting aesthetic solutions are gradually applied to some modern aircrafts. In turn, they influence the design of air distribution mode strongly, as shown in Fig.2(b).
(a) Luggage bin types
(b) Innovative aesthetic solutions Fig.2. Internal designs of civil aircraft
mode is gradually restricted by the above design factors [32]. Improper design of air distribution mode will lead to a bad thermal environment in aircraft cabin. Hence, the inlet position and supply air angle need to be considered carefully. In this paper, an optimization method of air distribution mode coupled interior design for civil aircraft will be presented considering these requirements. This method is shown in Fig.3.
Fig.3 Optimization method of air distribution mode
The optimization method of air distribution mode mainly includes the following three steps:
Step 1: Cabin interior structure analysis
Before to optimize an air distribution mode for a civil aircraft cabin, its cabin internal structure and luggage bin type should be analyzed firstly, and then the preliminary optimization interval of inlet positions of air distribution system should be determined in this step.
Step 2: CFD cabin model with parameterized ceiling inlets
and surface function needs to be used to realize the parameterization of ceiling inlet positions, which will support the automatic implementation of optimization process.
In addition, the boundary conditions of CFD model should be also carefully determined according to the airworthiness and other regulations.
(1) Velocity boundary condition: The mass flow rate of fresh air is determined by the airworthiness standard and the number of passengers [33]. The inlet velocity values can be accordingly calculated when the inlet area and the air supply amount are given.
(2) Temperature boundary conditions: The inlet temperature can be calculated when the heat loads have known. The temperature values of floor, ceiling, window and sidewalls can specified according to the measured data.
(3) Heat sources: The main heat sources include passengers, lights and so on. The metabolic rate of human bodies in a civil aircraft cabin is close to the value of sitting state.
Step 3: Optimization of air distribution mode
In this step, it is very important to determine the objective functions and optimization variables, reasonably. In this study, the minimization of the average air age and the minimization of the average absolute PMV are chosen as the objective functions. The optimization variables are the position of inlets and the air supply angle.
The Micro-GA will be used to obtain the solution set 1 of this optimization question [21~22]. Then some extra CFD simulation results of specified air distribution modes will be added in the solution set 1 to form the solution set 2, which will be the final pareto optimal solutions. The Pareto Optimal Fronts (POFs) will also be obtained correspondingly.
Although the preferred air distribution mode can be determined from the POFs, it should satisfy multiple design constraints at the same time. In this optimization study, there are three types of constraint conditions. They are thermal, structure and interior design constraint conditions. The internal structure and interior design will be coupled
to determine the optimization interval of inlet position, l∈[lmin, lmax]. Thermal
constraint conditions are specified by the SAE ARP in this paper [24]. In our study, the horizontal and vertical temperature differences are specially focused on.
In the next section, some typical cabin configurations of single-aisle B737-800 aircraft will be used to explain the above optimization method for air distribution mode coupled interior design.
3 CFD model of civil aircraft cabin with parameterized inlets
3.1 Geometric models of civil aircraft cabin
Two typical cabin configurations of single-aisle B737-800 aircraft will be illustrated as an example in this paper [34]. Only a symmetric half passenger cabin is established due to the calculation load of optimization process. As shown in Fig.4, the two models have same shell configuration and different structures of luggage bin, Bin 1 and Bin 2. Bin 1 is a traditional pushing-up type and its bottom is horizontal structure, which makes the cabin space low and cramped. Bin 2 is a new pulling-down type and its bottom is upward arc structure, which makes the space large and spacious. The number of passengers is 15 in our model.
(a) Bin 1 (b) Bin 2 Fig.4 Cabin geometric model
For the air distribution mode in a single-aisle aircraft, there are two kinds of air inlets, the ceiling inlets and the lateral inlets, as shown in Fig.5. A discontinuous air supply inlet structure is adopted in our study to avoid the Coanda effect in fluid mechanics. The size of every ceiling inlet is 87mm length and 20mm width. The
center distance between two air outlets is 87mm. Two columns of air supply inlets are symmetrically arranged along the ceiling axis. Air supply angle, α, will be used in the following analysis, and it is the angle between the supply air direction and the Z axis. The two rows of lateral inlets are symmetrically arranged on both sides of cabin. The size of every lateral inlet is 100mm length and 10mm width. Cabin air is exhausted from the outlets at the bottom of each side wall. The size of outlet is 4400mm length and 330mm height.
Fig.5 Cross section diagram
3.2 Grid data and convergence conditions
In this paper, an unstructured grid is used to mesh the CFD model. The cost of computing time caused by the increase of grid is very huge. Therefore, the basic grid size is finally determined as 0.02m after the grid independence test.In this case, y+ value is less than 30. In order to ensure the accuracy of numerical calculation around the air inlets, the refined grids are used for these positions at air inlets and its change regions. The refined grid sizes for the inlets and their change regions are 5% and 10% of the basic grid size, respectively. The number of grids is finally about 4.15million.
The solutions are considered to be converged when the sum of the normalized residuals for all the cells become less than 10-6 for energy and 10-3 for all other variables.
3.3 Boundary conditions
For every mode, the boundary and initial conditions are strictly same. Three types of boundary conditions will be used as follows.
1) Conditions of inlets and outlets
Normally, the ventilation system should provide at least 250 grams of fresh air per passenger per minute [22]. The supply air is composed by 50% of the fresh air and 50% of the recirculation air. Hence, the volume flow rate of total air can be determined when the number of passengers is given. Then the velocity boundary can be determined when the inlet area and distribution ratio are known. In our study, the velocities of ceiling inlets and lateral inlets are finally calculated as 2.9m/s and 0.7m/s, respectively. Since the air inlets were set as the boundary condition of velocity, the outlets were defined as the boundary condition of free outflow.
2) Temperature boundary conditions
The temperature of supply air is 19℃ in all modes. The cabin walls are set as the condition of constant wall temperature according to our measured data on board. The temperature values for floor, ceiling and sidewalls are specified as 24℃, 22℃ and 23℃, respectively.
3) Heat flux boundary conditions
The heat sources in the cabin mainly include passengers, lights, and so on. During a cruise process, passengers mostly keep in sitting state. The metabolic rate of human bodies in the simulation cases should be close to the value of sitting state. Considering some walking passengers in the cruise phase, the human metabolic rate is set as 65W/m2 in this paper [35]. The heat dissipation of lights is 12.5W. The surfaces of 15 human models and lighting will conduct convection heat transfer and radiation heat transfer with the cabin air.
3.3 Verification of numerical model
Although modern CFD technology can efficiently shorten the time and economic cost, it still needs to verify its accuracy using the experimental results [25~26]. Since the experimental data from our previous experiment were insufficient for the validation, the data derived from a cabin experiment of Purdue University is used to verify the numerical model in this study [36~37]. This experiment proceeded in a cubic cabin. Its length, width and height were 244mm, 244mm and 244mm, respectively. The whole
cabin, shown as Fig.6(a), was built with insulation materials. The inlet slot with 30mm height and 244mm length located at the top of the wall. On the opposite wall, an exhaust slot with 80mm height and 244mm length was set near the floor. Supply air was ejected into the cabin with a volume flow rate of 0.01m3/s and a temperature of 22.2℃. A small cube with 122mm×122mm×122mm was put in the center of the cabin to simulate occupants and chairs. Its dissipate heat was 700W, and the temperature of the cub surface was kept at 36.7℃. Ten detective lines perpendicular to X-Y coordinate plane were set to monitor the temperature, air velocity and turbulence kinetic energy of corresponding locations, as shown in Fig.6(b).
(a) Cabin structure (b) Main view (b)Top view Fig.6. Structure of experiment cabin and distribution of detective lines
Same simulation model was built with an adiabatic condition for the cabin wall boundaries. Simulation data on the ten detective lines was compared to the respective experiment data. For a clear display of each parameter, height value Z, air velocity V
and turbulence kinetic energy K were all normalized by their maximum values, which were 2.44m, 1.5m/s and 0.05m2/s2, respectively.
Since the temperature, turbulence and velocity can characterize the main features of air flow in the cabin [38], they will be analyzed in details. The temperature, T, is normalized by the following formula:
*
min / max min
T TT T T (5)
Tmin is the inlet air temperature, 22.2℃. Tmax is the surface temperature of the box
36.7℃. The normalized values were presented as Z*, U*, K* and T*. Only comparison results of detective line 1 are demonstrated in Fig.6 because the results of other
Inlet slot Exhaust slot Insulation materials Insulation materials Insulation materials Insulation materials 700W Z Y Heat flux Heat flux Heat flux
detective lines are similar to it. Fig.7 shows that our simulation results have a good agreement with the experimental results, which illustrates that our CFD model is feasible to simulate the thermal environment in aircraft cabin.
(a) Temperature (b) Turbulence kinetic energy (c) Velocity Fig.7. Comparison results of detective line 1
The relative error can be represented as:
(6)
where is the relative error at point j of line 1; represents KSim, USim and TSim
at point j of line 1; represents KExp, UExp and TExp at point j of line 1; j
represents the point index, j=1,2,3…16.
16 1 1 16 j j θ θ
(7) when represents the average relative errors.The results of error analysis show that the average relative errors of the air flow velocity, the turbulent kinetic energy and the air temperature are 26.2%, 22.1% and 4.4%, respectively. Because the air velocity and turbulent kinetic energy are relatively small, the order of magnitude is 10-2 and 10-3, respectively. So a small disturb will produce a relatively large relative error. But the above value is not more than 30%. The maximum temperature error is only 1.5℃, and its relative error is very small.
0 0.2 0.4 0.6 0.8 1 0 0.5 1 Sim Exp Z * T* 0 0.2 0.4 0.6 0.8 1 0 0.5 1 Sim Exp Z * K* 0 0.2 0.4 0.6 0.8 1 0 0.5 1 Sim Exp Z* U* j Exp Sim Exp j Sim Exp
3.4 Optimization position interval of inlets
The positions of lateral inlets are usually above the window and down the bin. It is unnecessary to optimize its position. The position of ceiling inlets will essentially affect the air distribution and thermal environment in the cabin. As illustrated in Fig.8, the possible design position of ceiling inlets in the half of cabin may be from the ceiling boundary to the ceiling axis. This ceiling curve is an irregular curve. In order to show the design position of ceiling inlets clearly, the irregular curve is projected to the horizontal axis and forms a projected length, l. Although l∈[0,700mm] in our study, the ceiling inlets cannot very near the ceiling boundary and the ceiling axis. In addition, the supply air angle and the internal structure will together decide the final optimization interval of inlet position, l∈[lmin, lmax]. Hence, l∈[lmin, lmax] will be
used in the following discuss.
(a) Main view (b) Top view Fig.8 Position range of ceiling inlets in the half of cabin
The position parameters of ceiling inlet will be built using the special module of wireframe and surface design in CATIA to realize their parameterization, which can ensure that the inlet positions can be automatically adjusted in CFD simulation by the optimization method.
3.5 Preliminary air distribution modes
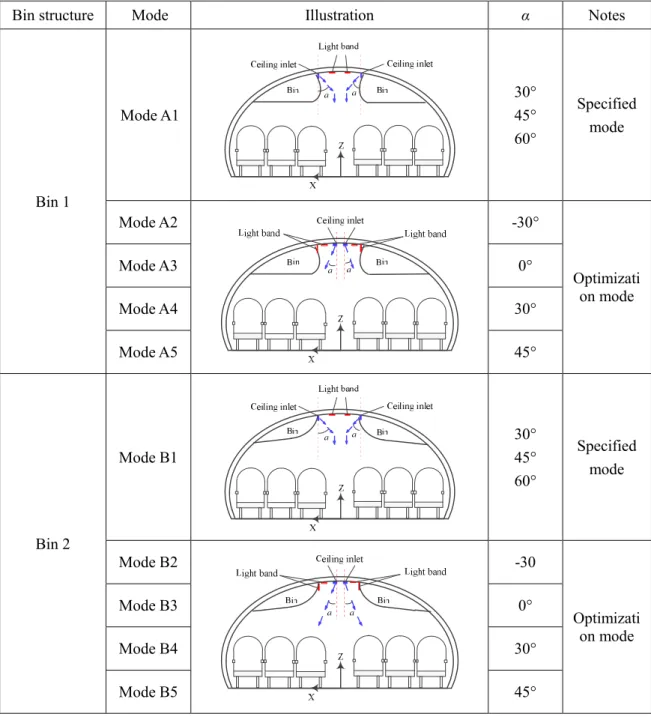
Two types of luggage bins with different lighting solutions will be used to discuss the optimization method. The preliminary air distribution modes, as shown in Table 1, will be considered in the following study. The lateral inlets are same in these modes, and are not shown in Table 1.
For Bin 1, five modes will be discussed according to the possible light bands and internal design.
Mode A1 is a specified traditional air distribution mode. The fresh air is supplied into the cabin from the ceiling inlets just above the bin. α can be 30°, 45° and 60°, respectively.
In Mode A2 to Mode A5, the ceiling inlets are placed on the ceiling, and α can be -30°, 0°, 30° and 45°, respectively.
The preliminary air distribution modes for Bin 2 are same as the ones in Bin 1. Table 1 Studied modes
Bin structure Mode Illustration α Notes
Bin 1 Mode A1 30° 45° 60° Specified mode Mode A2 -30° Optimizati on mode Mode A3 0° Mode A4 30° Mode A5 45° Bin 2 Mode B1 30° 45° 60° Specified mode Mode B2 -30 Optimizati on mode Mode B3 0° Mode B4 30° Mode B5 45°
4 Optimization procedure
The optimization in this study aims at finding the optimal position for ceiling inlets under different interior design conditions and different supply air angles. The optimization method of Micro-GA is adopted to obtain the preferred results.
4.1 Optimization variable
Position of air supply inlets, l, and supply air angle, α, are defined as the optimization variable. Because of a huge computing load for the CFD simulation optimization, two optimization variable ranges are different in our study. The range of
l is continuous and the range of α is discrete.
l∈[lmin, lmax]
α=(α1, α2, α3, α4)= (-30°, 0°, 30°, 45°)
The supply air angle, the internal structure and the other interior design will be coupled to determine the optimization interval of inlet position, l∈[lmin, lmax]. The
influence of the first two terms on [lmin, lmax] is shown in Table 2.
Table 2 Relationship between a, bin type and [lmin, lmax]
Bin 1 Bin 2
Mode α [lmin, lmax] Mode α [lmin, lmax]
Mode A2 -30° 10-610 Mode B2 -30° 10-670
Mode A3 0° 30-670 Mode B3 0° 10-670
Mode A4 30° 100-670 Mode B4 30° 50-670
Mode A5 45° 200-670 Mode B5 45° 100-670
For a well-designed optimization program, l should be regulated automatically. l
has to be parameterized. This function will be realized by the special module of wireframe and surface design in the CATIA. After parameterization, the inlet positions can be automatically adjusted in CFD simulation by the optimization
method.
4.2 Objective functions
The choice of evaluation objective functions is very important for the optimization of cabin thermal environment. In our study, two objective functions are chosen for the evaluation. One objective function is the famous PMV [39]. It includes many key factors such as humidity, temperature and velocity, but does not involve the air quality factor. Another objective function is chosen as the air age, ϕ, which represents the residence time of the airflow at specific position. With the passive scalar concept in CFD [40~41], air age can be easily obtained.
The PMV model can be established to assess thermal sensation with sea level pressure and a proper RH. But for an aircraft cabin environment, its cabin pressure and RH are lower than normal specified standard [23][42]. Therefore, a corrected PMV model is used in this paper [43]. The value of RH is assumed as 30% considering the relatively dry cabin environment in our study. The thermal insulation of clothing is set as 0.9clo in a spring flight condition. The radiation temperature is finally set as 21℃ for our PMV calculation.
The optimization objective functions will be calculated by the detective points that are built around the occupant models. Six occupants in the middle row are specially chosen to set these detective points. For every occupant, there are three detective points, Pij. The subscript i represents the passenger index, i=1, 2,…, 6. The
subscript j represents the location of detective points as shown in Fig.9, j=1, 2, 3. The heights of Pij are 50mm, 690mm and 1100mm [25].
Pi1 100mm Pi2 100mm Pi3 100mm 50mm 1100mm 690mm
In the same way, ϕij and PMVij can be defined. Further, PMVij represents the
absolute value of PMVij. The objective functions can be described as follows:
(1) Minimization of average air age, min( ) :
6 2 1 1 1 1 1 ( ) min( ) min 6 i 2 j ij f l
(8)(2) Minimization of average absolute PMV, min PMV :
6 3 2 1 1 1 1 ( ) min min 6 i 3 j ij f l PMV PMV
(9) 4.3 Optimization stepOur numerical model has a same size with the real aircraft cabin. Five rows of passengers in the cabin are built in this study, and its quantity of mesh is more than five million. The quantity of surface mesh is very huge even just for once CFD simulation in the Fluent software. This will be a huge calculation load for the studied CFD simulation optimization.
The calculation time costs five hours just for one numerical model with 5 million grids. However, there will be hundreds of numerical models in an optimization process. Therefore, the time consume will be very enormous. In order to efficiently obtain the final optimization results, the Micro-GA in modeFRONTIER software is combined with the Fluent software in our optimization study. For a given air supply angle, α, the whole program will run automatically until it obtains its global optimal solution. The global optimal solution is the solution set 1 in Fig.3. Then the extra CFD simulations will be conducted for the specified air distribution modes. Their simulation results will be added in the solution set 1 to form the solution set 2 in Fig.3.
4.4 Constrain conditions
For the multi-objective optimization, it usually has a series of optimal solutions, that is the solution set 2. Its POFs can be determined accordingly. Next, the designers will determine the preferred designer points according the constrain conditions.
In this study, the thermal constraint conditions are chosen according to the specification in the HB 7489-2014 and the SAE ARP 85-2012 [27][30]. Two temperature differences are adopted to evaluate the thermal performance of optimization results. They are the horizontal temperature difference, ΔTH, and the vertical temperature
difference, ΔTV. As shown in Fig.9, three passengers from one side of the cabin in the
middle row are taken to obtain the detective values, and the above indicators are refined as follows:
ΔTH1 =|T12-T22|, ΔTH2 =|T22-T32|, ΔTH3 =|T12-T32| (10)
ΔTV1 =|T11-T13|, ΔTV2 =|T21-T23|, ΔTV3 =|T31-T33| (11)
The temperatures in Eq. (3) and (4) can be uniformly explained with the definition of Tij, as shown in Fig.9. The SAE ARP 85-2012 requires ΔTH ≤ 2 ℃ and
ΔTV ≤ 2.8 ℃, then:
ΔTH =max(ΔTH1, ΔTH2, ΔTH3) ≤ 2 ℃ (12)
ΔTV =max(ΔTV1, ΔTV2, ΔTV3) ≤ 2.8 ℃ (13)
Interior design constraints include the location of the light band and the aesthetic design of ceiling, and so on. The location of the light band and the aesthetic design requirement for the ceiling will be used together to select the final preferred design points from the solution set 2 of POF.
5 Optimization result analysis
5.1 Solution set 2 of Bin 1
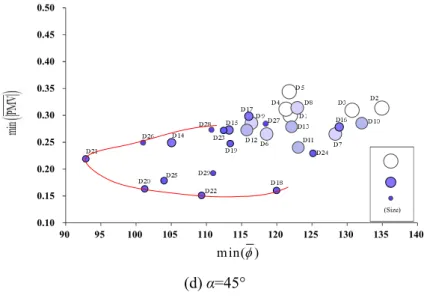
Optimization procedure conducted 7 generations and nearly 40 optimal calculations in every case from Mode A2 to Mode A5. Fig.10(a) ~ Fig.10(d) show the optimization results of Bin 1 when α=-30°, 0°, 30°and 45°, respectively. In these figures, X-axis expresses min( ) and Y-axis expresses min PMV . The numbers near circles represent the design point index in the optimization. The size of circle denotes the generation index of optimization. The smaller the circle is, the higher its generation number. The red lines indicate the POFs.
0.1 0.2 0.3 0.4 0.5 0.6 100 110 120 130 140 150 160 170 180 (Size) a1 a2 a3 a4 a5 a6 a7 a8 a9 a10 a11 a12 a13a15 a17 a18 a19 a21 a22 a24 a25 a26 a27 a28 a29 a33 a30 a32 a16 (a) α=-30° (b) α=0° 0.0 0.1 0.2 0.3 0.4 0.5 0.6 75 85 95 105 115 125 135 145 155 165 (Size) c1 c2 c4 c5 c6 c8 c7 c9 c10 c11 c12 c3 c13 c14 c15 c16 c17 c18 c19 c20 c21 c25 c23 c22 c24 c36 c27 c28 c29 c30 c31 c32 c33 c34 c35 c26 c37 (c) α=30° 0.0 0.1 0.2 0.3 0.4 0.5 0.6 85 95 105 115 125 135 145 155 165 175 (Size) d1 d2 d3 d4 d5 d6 d7 d8 d9 d10 d13 d11 d12 d14 d15 d16 d17 d18 d19 d20 d21 d22 d23 d25 d26 d27 d28 d29 d30 d31 d32 d33 d24 (d) α=45°
From Fig.10, the following conclusions can be drawn:
(1) The objective function values keep decreasing along with the proceeding of optimization. This demonstrates that the Micro-GA method can efficiently promote the optimization procedure to obtain the optimal solution.
(2) The value range of min PMV in the above optimization cases is very close from 0.1~0.6. However, the value range of min( ) in the above optimization cases are obvious different.
(3) The red lines in the sub-graphs are the POFs. Those design points on and near the POFs might be the possible optimization solution. The final preferred design points should be chosen from those design points coupling with the constrain conditions.
(4) The difference of optimization results between Fig.10(c) and Fig.10(d) is not obvious, and their optimization results are in good agreement.
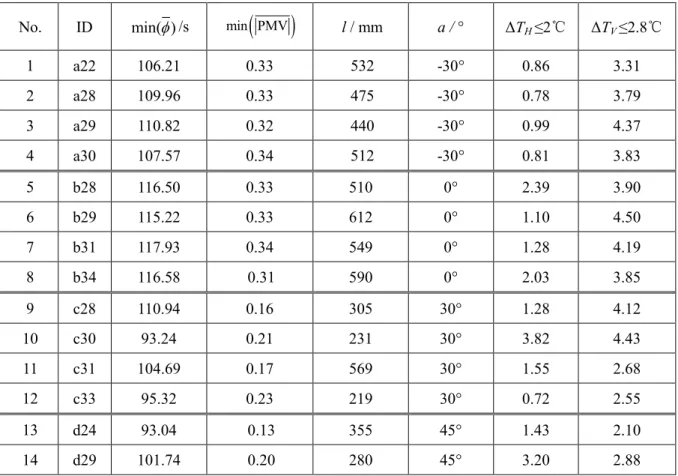
(5) The optimal points are a22, a28, a29 and a30 in Fig.10(a). The optimal points are b28, b29, b31, b33 and b34 in Fig.10(b). The optimal points are c28, c30, c31 and c33 in Fig.10(c). The optimal points are d24, d29, d32 and d33 in Fig.10(d).
The chosen optimal points should be further refined using the constrain conditions. The horizontal temperature difference, ΔTH, and the vertical temperature
difference, ΔTV, are used firstly. The information is shown in Fig.11 and listed in
Table 3. In this table, S30, S45 and S60 represent three results of the specified traditional
air distribution modes in Mode A1 when a=30°, 45° and 60°, respectively.
Fig.11 ΔTH and ΔTV for the chosen optimal points.
0.0 0.5 1.0 1.5 2.0 2.5 3.0 3.5 4.0 4.5 5.0 0 1 2 3 4 5 6 7 8 9 10 11 12 13 14 15 16 17 18 19 Δ T No. ΔTH ΔTV a22 a28 a29 a30 b28 b29 b31 b34 c28 c30 c31 c33 d24 d29 d32 d33 S30 S45 S60
From Fig.11 and Table 3, we can observe that:
(1) No design points satisfy the constrain conditions in Mode A2 and Mode A3, and their vertical temperature differences are bigger than 2.8℃. These two design modes are inadvisable. Hence, supply air angles, -30° and 0°, are not recommended for the luggage structure of Bin 1 when ceiling inlets are arranged from the ceiling boundary to the ceiling axis.
(2) For Mode A4 and Mode A5, the design points, c31, c33 and d24, are finally chosen as the preferred design points. The three design points are also satisfied the constrain conditions. Hence, supply air angles, 30° and 45°, are recommended for the luggage structure of Bin 1 when the ceiling inlets are arranged from the ceiling boundary to the ceiling axis.
The traditional design condition in Mode A1, S60, is specially recommended for
its good performance. It is a pity that its min( ) is little bigger than those of c31, c33 and d24.
Table 3 Chosen optimal points for Bin 1
No. ID min( ) /s min PMV
l / mm a / ° ΔTH≤2℃ ΔTV≤2.8℃1 a22 106.21 0.33 532 -30° 0.86 3.31 2 a28 109.96 0.33 475 -30° 0.78 3.79 3 a29 110.82 0.32 440 -30° 0.99 4.37 4 a30 107.57 0.34 512 -30° 0.81 3.83 5 b28 116.50 0.33 510 0° 2.39 3.90 6 b29 115.22 0.33 612 0° 1.10 4.50 7 b31 117.93 0.34 549 0° 1.28 4.19 8 b34 116.58 0.31 590 0° 2.03 3.85 9 c28 110.94 0.16 305 30° 1.28 4.12 10 c30 93.24 0.21 231 30° 3.82 4.43 11 c31 104.69 0.17 569 30° 1.55 2.68 12 c33 95.32 0.23 219 30° 0.72 2.55 13 d24 93.04 0.13 355 45° 1.43 2.10 14 d29 101.74 0.20 280 45° 3.20 2.88
15 d32 99.30 0.23 317 45° 1.64 4.72
16 d33 100.75 0.24 330 45° 1.72 3.12
17 S30 95.92 0.32 / 30° 1.07 3.50
18 S45 121.68 0.37 / 45° 1.71 4.18
19 S60 119.49 0.32 / 60° 0.89 2.60
According to the above analysis and comparison, the four referred design points are c31, c33 and d24 and S60, are finally recommended for the first luggage bin
structure. The design positions and simulation results are shown in Fig.12.
If the other interior design constraints are given, such as the light band location and the aesthetic ceiling design, and then these preferred design points can be refined further to satisfy all design requirements.
(a) c31
(b) c33
(c) d24
(d) S60
Fig.12 Simulation results of the preferred design points for Bin 1
5.2 Solution set 2 of Bin 2
This optimization procedure conducted 7 generations and nearly 40 CFD calculations in every case from Mode B2 to Mode B5. Fig.13(a) ~ Fig.13(d) show the optimization results of Bin 2 when α=-30°, 0°, 30°and 45°, respectively.
From Fig.13, the following conclusions can be drawn. The optimal points are A23, A27, A31 and A33 in Fig.13(a). The optimal points are B22, B23, B24 and B33 in Fig.13(b). The optimal points are C24, C25, C28 and C30 in Fig.13(c). The optimal points are D20, D21, D25 and D26 in Fig.13(d). The chosen optimal points should be further refined by using the constrain conditions of ΔTH and ΔTV. The information is
0.10 0.15 0.20 0.25 0.30 0.35 0.40 0.45 0.50 90 95 100 105 110 115 120 125 130 135 (Size) min( ) (a) α=-30° 0.10 0.15 0.20 0.25 0.30 0.35 0.40 0.45 0.50 90 95 100 105 110 115 120 125 130 135 (Size) B1 B3 B4 B2 B5 B6 B7 B8 B9 B10 B12 B11 B13 B14 B16 B15 B17 B18 B19 B20 B21 B22 B23 B24 B25 B27 B26 B29 B28 B30 B31 B32 B33 (b) α=0° 0.10 0.15 0.20 0.25 0.30 0.35 0.40 0.45 0.50 90 95 100 105 110 115 120 125 130 135 140 145 (Size) min( ) (c) α=30°
0.10 0.15 0.20 0.25 0.30 0.35 0.40 0.45 0.50 90 95 100 105 110 115 120 125 130 135 140 (Size) m in( ) (d) α=45°
Fig.13 2-D scatter plot of solution set 2 of Bin 2
Fig.14 Conditions of ΔTH and ΔTV for the chosen optimal points.
Table 4 Chosen optimal points for Bin 2
No. ID min( ) /s min PMV
l / mm a / ° ΔTH≤2℃ ΔTV≤2.8℃1 A23 99.30 0.28 186 -30° 1.79 2.01 2 A27 93.88 0.34 10 -30° 3.33 1.67 3 A31 99.08 0.32 262 -30° 1.88 2.47 4 A33 100.05 0.34 549 -30° 0.51 3.03 5 B22 96.60 0.31 52 0° 1.68 4.35 6 B23 101.40 0.35 291 0° 2.01 2.88 7 B24 101.19 0.27 81 0° 1.24 2.72 8 B33 99.81 0.35 38 0° 3.76 2.26 9 C24 95.72 0.23 586 30° 1.64 2.76 10 C25 104.25 0.20 447 30° 2.06 2.72 11 C28 103.64 0.28 170 30° 1.39 1.76 0.0 1.0 2.0 3.0 4.0 5.0 6.0 0 1 2 3 4 5 6 7 8 9 10 11 12 13 14 15 16 17 18 19 Δ T No. ΔTH ΔTV
12 C30 108.30 0.26 490 30° 1.63 2.22 13 D20 101.26 0.16 123 45° 1.21 2.75 14 D21 92.84 0.22 146 45° 0.48 5.78 15 D25 103.91 0.18 158 45° 0.83 1.97 16 D26 101.00 0.25 468 45° 1.36 2.38 17 S30 100.94 0.30 / 30° 2.45 2.07 18 S45 130.57 0.37 / 45° 1.47 4.00 19 S60 115.87 0.29 / 60° 1.41 2.05
From Fig.14 and Table 4, we can observe that:
(1) A23 and A31 in Mode B2 satisfy the requirements. For Mode B3, only B24 satisfies the requirements. But because its supply air directly blows to the passengers near the aisle, it will cause a strong draft sensation. Therefore, this operating condition is not recommended.
(2) For Mode B4 and Mode B5, the design points, C24, C28, C30, D25 and D26, are finally chosen as the preferred design points. In addition, the results of C30 and D26 are very similar. C28 and D25 are very similar. These design points are all satisfied the constrain conditions.
(3) The traditional design point in Mode 1, S60, is specially recommended for its
good performance. It is a pity that its min( ) is little bigger than the other chosen points.
According to the above analysis and comparison, the following referred design points are finally recommended for the second luggage bin structure, and they are A23, A31, C24, C28, C30, D25, D26 and S60. Considering the similar air distribution
performance, the design positions and simulation results of only A31, C24, C30, D25 and S60 are given in Fig.15.
(a) c24
(b) c30 (c) d25 (d) S60
Fig.15 Simulation results of the preferred design points for Bin 2.
If the other interior design constraints are given, such as the light band location and the aesthetic design for the ceiling, these preferred design points can be further refined to satisfy all design requirements.
5.3 Discussion on constraint of aesthetic lighting design
design of air distribution system if the other interior aesthetic design constraints are given. In this section, an implement example will be used to explain the application of optimization results.
Fig.16(a) shows a single-aisle B737-800 aircraft with the luggage bin of Bin 2. In order to improve its cabin aesthetic effect, the ceiling boundary is designed with aesthetic light bands. Hence, the ceiling is divided into three zones in its front and back, respectively. The strips of light bands are separately arranged on both sides of the cabin in Zone 1 and Zone 3. The long elliptical light band is centrally arranged in Zone 2 and it will produce soft blue lighting.
We can pick up the optimal design solution from Section 5.2. The preferred design points, A23, C28 and D25, can be recommended to be applied in Zone 1 and Zone 3. The preferred design points, C24 and D26, can be recommended to be applied in Zone 2. Fig.16 (b) gives the flow field distributions in the cabin when C24 is adopted in Zone 2 and D25 is adopted in Zone 1 and 3.
Light
Zone 1 Zone 2 Zone 3
Possible installation interval for inlets
Ceiling boundary
(a) Aesthetic lighting design in front cabin ceiling
(b) Air distribution modes in different zones and their PMV simulation results Fig.16 Optimization results application example.
6 Conclusions
The cabin interior design could greatly influence the air distribution design. The airflow field will be very different for individual bin structures and light bands positions. It is very necessary to optimize the air distribution mode. In this paper, a multiple-objective optimization method coupled interior design is presented to search the preferred air distribution modes for civil aircraft cabin. The Micro-GA method is adopted to solve this time-consuming CFD optimization problem. Two typical cabin configurations of single-aisle B737-800 aircraft are used to illustrate the optimization process in this paper. Some conclusions can be drawn from our study:
(1) The objective function values keep decreasing along with the proceeding of optimization. The presented optimization method can efficiently promote the optimization procedure to obtain the optimal solution.
(2) The range of min PMV in the optimization cases is close, but constrain conditions and the value ranges of min( ) are obvious different. Hence, the constrain conditions and min( ) become the key indexes to choose the final preferred results.
(4) For the luggage bin of Bin 1, the -30° and 0° supply air angles are not recommended when ceiling inlets are arranged from the ceiling boundary to the ceiling axis. Most of optimization points in Mode A2 and Mode A3 do not satisfy the constrain condition of vertical temperature difference. While the 30° and 45° supply air angles are recommended for the luggage structure of Bin 1. The design points, c31, c33 and d24, are finally chosen as the preferred design points from Mode A3 and Mode A4. In addition, the traditional design condition in Mode A1, S60, is also
recommended, but its min( ) is little bigger than those of c31, c33 and d24.
(5) For the luggage bin of Bin 2, the 0° supply air angle is not recommended because it will produce uncomfortable drafts feeling. Hence -30°, 30° and 45° supply air angles are recommended for the luggage structure of Bin 2 when ceiling inlets are arranged on the ceiling. The design points, A23, A31, C28, C30, D25 and D26, are
finally chosen as the preferred design points from Mode B2, Mode B4 and Mode B5. In addition, the traditional design condition in Mode B1, S60, is also recommended,
but its min( ) is little too big.
Acknowledgments:
The authors are grateful to the anonymous reviewers for their critical and constructive review of the manuscript. Their comments helped to increase quality and readability of the manuscript.
References
[1] Muijdenj V. Modeling the impact of aircraft cabin pressure and humidity on thermal comfort. Amsterdam: National Aerospace Laboratory (NLR), 2011.
[2] Uchiyama E, Aronowicz J D, Butovich I A, et al. Increased evaporative rates in laboratory testing conditions simulating airplane cabin relative humidity: an important factor for dry eye syndrome. Eye & Contact Lens, 2007, 33(4): 174-176.
[3] Marggraf, Piewald C, Winzen J, et al. Thermal comfort in the aircraft cabin—research in the Do 728 mock-up [AR]. Hamburg: German Aerospace Center, 2010.
[4] Parks, Hellwig R T, Grun G, et al. Local and overall thermal comfort in an aircraft cabin and their interrelations. Building and Environment. 2011, 46: 1056-1064.
[5] Mazumdar S, Chen Q. Impact of moving bodies on airflow and contaminant transport inside aircraft cabins. Proceedings of Room vent. 2007, Helsinki, June 13-15.
[6] Zhang T, Chen Q. Novel air distribution systems for commercial aircraft cabins. Building and Environment. 2007,42: 1675-84.
[7] Zhang Y, Sun Y, Wang A, Topmiller JL, Bennett JS. Experimental characterization of airflows in aircraft cabins, Part II: Results and research recommendation. ASHRAE Transactions. 2005, 111: 53-9.
[8] ISO 7730 Ergonomics of the thermal environment. Analytical determination and interpretation of thermal comfort using calculation of the PMV and PPD indices and local thermal comfort.
[9] ISO 7730:2005 Ergonomics of the thermal environment -- Analytical determination and interpretation of thermal comfort using calculation of the PMV and PPD indices and local thermal comfort criteria.
[10] Nielsen PV. Flow in air conditioned rooms. PhD thesis. Copenhagen: Technical University of Denmark; 1974. [11] Mizuno T, Warfield MJ. Development of three-dimensional thermal airflow analysis computer program and verification test. ASHRAE Transactions. 1992, 98(2): 329-38.
[12] AboosaidiF, Warfield MJ, Choudhury D. Computational fluid dynamics applications in airplane cabin ventilation systemdesign. Proceedings-Society of Automotive Engineers. 1991, 246: 249-58.
[13] Singh A, Hosni MH, Horstman RH. Numerical simulation of airflow in an aircraft cabin section. ASHRAE Transactions. 2002, 108(1):1005-1013.
[14] Kana Horikiri, Yufeng Yao, Jun Yao. Numerical optimization of thermal comfort improvement for indoor environment with occupants and furniture. Energy and Buildings. 2015, 88: 303-315.
investigation of airflow and contaminant transport in an airliner cabin mockup. Building and Environment. 2009, 44: 85-94.
[16] Tengfei Zhang, Qingyan Chen. Novel air distribution systems for commercial aircraft cabins. Building and Environment. 2007, 42(4): 1675-1684.
[17] Liping Pang, JieXu, Lei Fang, Mengmeng Gong, Hua Zhang, Yu Zhang. Evaluation of an improved air distribution system for aircraft cabin. Building and Environment. 2013, 59: 145-152.
[18] Wei Liu, Tengfei Zhang, Yu Xue, Zhiqiang Zhai, Jihong Wang, Yun Wei, Qingyan Chen. State-of-the-art methods for inverse design of an enclosed environment. Building and Environment. 2015, 91: 91-100.
[19] Yu Xue, Zhiqiang Zhai, Qingyan Chen. Inverse prediction and optimization of flow control conditions for confined spaces using a CFD-based genetic algorithm Building and Environment. 2013, 64: 77-84.
[20] Wei Liu, Ran Duan, Chun Chen, Chao-Hsin Lin, Qingyan Chen. Inverse design of the thermal environment in an airliner cabin by use of the CFD-based adjoint method. Energy and Buildings. 2015, 104: 147-155.
[21] Wei Liu, Jizhou Wen, Chao-Hsin Lin, Junjie Liu, Zhengwei Long, Qingyan Chen. Evaluation of various categories of turbulence models for predicting air distribution in an airliner cabin. Building and Environment. 2013, 65: 118-131.
[22] Federal Aviation Regulations, Part 25: Airworthiness Standards.
[23] ASHRAE, ANSI/ASHRAE Standard 55-2010: Thermal Environment Conditions for Human Occupancy. Atlanta, GA, American Society of Heating, Ventilating and Air-Conditioning Engineers, Inc., 2011.
[24] SAE ARP 85 Revision E, Air Conditioning Systems For Subsonic Airplanes. https://sae.nufu.eu/group/ARP. [ASHRAE161-2007
[25] ANSI/ASHRAE Standard 161-2007. ANSI/ASHRAE Standard 161-2007. Air Quality within Commercial Aircraft American Society of Heating, Refrigerating and Air-Conditioning Engineers, Inc. 1791 Tullie Circle NE, Atlanta, GA 30329. www.ashrae.org.
[26] General requirements for environmental control system of civil aircraft. HB 7489-2014. People's Republic of China Aviation Industry Standard. ICS49.090. V44.
[27] Srebric J, Chen Q. An example of verification, validation, and reporting of indoor environment CFD analyses. ASHRAE Trans. 2002, 108(2): 185-94.
[28] Mohammad Aliahmadipour, Morteza Abdolzadeh, Khosro Lari. Air flow simulation of HVAC system in compartment of a passenger coach. Applied Thermal Engineering. 2017, 123: 973-990.
[29] Ruoyu You, Jun Chen, Chao-Hsin Lin, Daniel Wei, Qingyan Chen. Investigating the impact of gaspers on cabin air quality in commercial airliners with a hybrid turbulence model. Building and Environment. 2017, 111: 110-122.
[30] Muhammad Burhan, Kian Jon Ernest Chua, Kim Choon Ng. Sunlight to hydrogen conversion: Design optimization and energy management of concentrated photovoltaic (CPV-Hydrogen) system using micro genetic algorithm. Energy. 2016, 9915: 15-128.
[31]http://www.boeingimages.com/C.aspx?VP3=SearchResult&VBID=2JRSN2P1YTM4PL&SMLS=1&R=1280 & RH =559W
[32] Kok J C, Muijden J, Burgers Ss. Enhancement of aircraft cabin comfort studies by coupling of models for human thermoregulation, internal radiation and turbulent flows. Delft University of Technology. Proceedings of European Conference on Computational Fluid Dynamics. Delft: Delft University of Technology. 2006, 1-19. [33] Federal Aviation Regulations, Part 25: Airworthiness Standards: Transport Category. https://www.faa.gov/aircraft/air_cert/airworthiness_certification/std_awcert/std_awcert_regs/regs/
[34]http://www.boeing.com/commercial/737ng/
Environment.
[36] Wang M, Chen Q. Assessment of various turbulence models for transitional flows in enclosed environment (RP-1271). HVAC & Research. 2009, 15: 1099-1119.
[37] Blocken B, Janssen WD, van Hooff T. CFD simulation for pedestrian wind comfort and wind safety in urban areas: general decision framework and casestudy for the Eindhoven university campus. Environ Modell Softw. 2012, 30:15-34.
[38] Zhao Yingjie, DaiBingrong, Yu Qi, Si Haiqing, Yu Gang. Numerical simulation study on air quality in aircraft cabins. Journal of Environmental Sciences. 2017, 56: 52-61.
[39] Fanger PO. Thermal comfort analysis and application in environment engineering. Copenhagen: DanishTechnology Press, 1970.
[40] Warhaft Z. Passive scalars in turbulent flows. Annu Rev Fluid Mech. 2000, 32:203-240. [41] Shraiman B I, Siggia E D. Scalar turbulence. Nature. 2000, 405: 639-646.
[42] W. Cui, Q. Ouyang, Y. Zhu, S. Hu. Prediction model of human thermal sensation under low-air-pressure environment, in: Proceedings of the Eighth International Symposium on Heating, Ventilation and Air Conditioning, Springer, Berlin Heidelberg. 2014, 329-336.
[43]Pang Liping, Wang Yingjie, Liu Meng, Zhang Helin, Wang Jun. Method to predicting optimal cabin operative temperature for civil aircraft. Building and Environment. 2013, 69: 160-170.
![Table 2 Relationship between a, bin type and [l min , l max ]](https://thumb-us.123doks.com/thumbv2/123dok_us/8685402.2349397/18.892.134.767.738.959/table-relationship-bin-type-l-min-l-max.webp)