Intel® Business Center Case Study
Pilot Study:
Optimum Refresh Cycle and
Method for Desktop Outsourcing
Business Intelligence
The Challenge
IT organizations working with reduced budgets often delay
refreshing their desktop hardware. And to avoid lump-sum
hardware costs, companies often refresh only a portion of
their PCs at one time. But delaying the PC refresh can lead
to higher support and productivity costs, and staggered
refreshes can result in higher deployment costs for
companies that outsource their IT infrastructure. Therefore,
a question IT decision makers are inclined to ask is, “What
is the optimum PC refresh cycle, and what is the optimum
refresh method?”
The Solution
The Optimum Refresh Cycle and Method for Desktop
Outsourcing pilot study indicates that refreshing all PC
desktop hardware at once (the “forklift” method) every three
years provides the best cost savings all around.
The Results
The pilot study participant company decided to perform a
forklift upgrade and adhere to a three-year refresh cycle as a
result of the study.
SOLUTION SUMMARY
Introduction
As IT organizations are under continual pressure to reduce costs, many companies may choose to delay their PC refresh to decrease the frequency of spending for PC hardware. However, this study again validates what others have previously indicated, that there is strong evidence suggesting that delaying PC refresh increases support costs and reduces user productivity.
Beyond that, this study went on to evaluate a new IT management dynamic, that for companies with outsourced PC environments, the common conception that a smooth refresh cycle — even over a 3 year period — is not the lowest cost approach. Although staggering the refresh may reduce upfront cash requirements by spreading them out over several years, there is also an associated increase in support and productivity
Failing to refresh a PC after its maintenance costs have risen above a certain level can cause TCO to rise. Therefore, it is important to determine the point on the TCO curve where it is incrementally less expensive to replace a PC rather than to continue using it.
In addition to considering the TCO curve, companies must also decide whether using a staggered refresh or a forklift refresh will result in overall lower costs. While a forklift refresh can result in higher PC cash acquisition costs for the first year, the deployment costs will be lower and the resulting PC environment will be almost totally homogenous, absolutely minimizing the costs associated with managing multiple PC platforms. Because both the timing and the method for PC refresh affect a company’s TCO, the pilot study team decided to analyze the real-life working environment at an actual (non-laboratory) deployment site.
Pilot Study Methodology
A large financial services company in the UK was selected as the pilot study site. The bank had recently signed a desktop outsourcing agreement with a major company, and both teams were interested in developing refresh plans based on actual data obtained in the course of the pilot study.
The population of the pilot study included
approximately 200 employees. Those chosen for the pilot study had PCs that ranged from brand new to more than five years old.
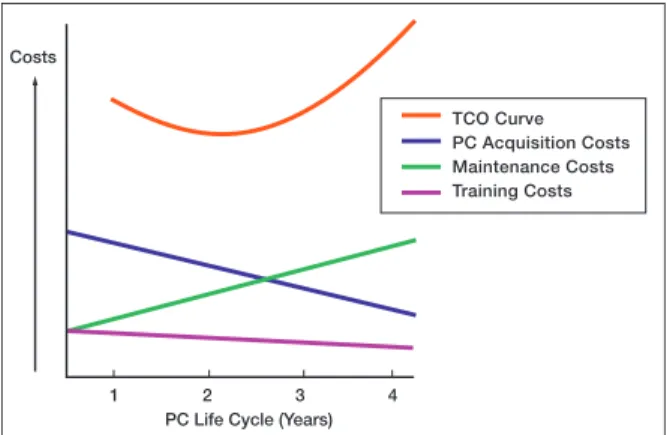
Figure 1. Total Cost of Ownership (TCO) Curve Based on PC Life Cycle with Three Cost Variables
Costs
PC Life Cycle (Years)
1 2 3 4
TCO Curve PC Acquisition Costs Maintenance Costs Training Costs
costs versus utilizing the “forklift” approach, where all PCs are refreshed at the same time. In addition, deployment costs (the average cost to deploy a PC) are reduced by the outsourcer’s ability to employ massive economies of scale, scale that an IT organization could never approach. Faced with this critical IT decision, companies with an outsourced PC infrastructure must answer the following two questions:
How often should a company refresh its PCs? What method of refresh should be used?
To objectively find answers to these questions, Intel Corporation and A.T. Kearney, a management consulting firm, conducted a six-week pilot study at a leading financial services company in the UK. The study used the total cost of ownership (TCO) model to determine the optimal timing and mechanism of client refresh.
During the pilot study, a survey was administered to 200 employees to collect data on the current computers they were using. The collected data was used to better understand some of the non-hardware cost elements, such as support and user productivity. It also helped determine how the age of the computer impacts hidden cost elements. Our user survey consisted of two components that looked at the following criteria:
Historical performance.
Current performance during the pilot study time
period.
Pilot Study Background
TCO over the life of a PC tends to follow a U-shaped curve, as shown in Figure 1.
Figure 1 shows the relationships between three components of TCO and how they relate to PC refresh timing:
PC acquisition costs, which are typically
amortized and decrease (or stay flat) over the life of the PC.
Maintenance costs, which tend to rise over the
life of the PC.
Training costs, which tend to decrease slightly
The pilot study team collected both historical and current data; current data was collected bi-weekly over the course of six weeks. The elements of the current data included down time in the previous week, number of help desk calls and ‘hourglass’ wait time. For the historical data collection, users were asked to comment on the performance of their PCs over the previous 12 months.
When gathering current and historical data, we collected current “hard” costs at the pilot study site, as well as additional cost information based on current and historical account costs, for the following areas:
hardware and software acquisition
consistent office environment (COE) development application management
deployment support.
We also validated costs against current and historical outsourcer negotiated internal costs.
When generating the outsourcer cost models, we collected data from the deployment costs model that was developed for the study participant by the outsourcer. We also reviewed additional outsourcer
costs models (such as TCO models) for similarly sized companies to determine cost estimates.
Total Cost of Ownership (TCO)
Cost Model
The data obtained from the pilot study was fed into a detailed TCO cost model. The model was developed using multiple sources including more than
50 interviews with desktop outsourcing experts and 20 or more detailed reports on desktop management costs. Several Intel and A.T. Kearney subject matter experts, as well as the outsourcer, contributed to the development of the TCO cost model.
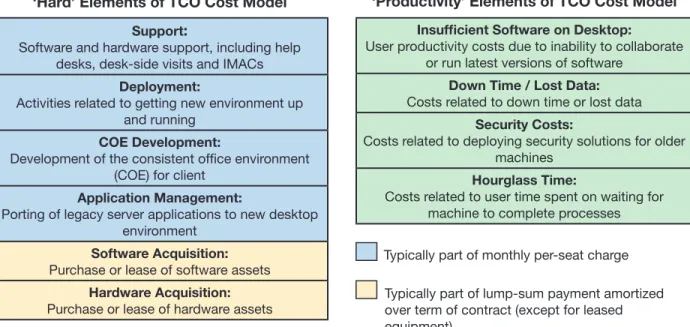
The TCO cost model considered two broad cost categories:
“Hard” costs — hardware acquisition costs,
maintenance costs and other quantifiable costs
“Soft” costs — user productivity, down time,
security breaches, delays, etc. Figure 2 summarizes these cost elements.
Once the cost variables in the TCO cost model were defined, the team proceeded to conduct the pilot study and input the data into the TCO cost model.
Figure 2. Cost Elements of the TCO Cost Model Support:
Software and hardware support, including help desks, desk-side visits and IMACs
Deployment:
Activities related to getting new environment up and running
COE Development:
Development of the consistent office environment (COE) for client
Application Management:
Porting of legacy server applications to new desktop environment
Software Acquisition:
Purchase or lease of software assets
Hardware Acquisition:
Purchase or lease of hardware assets
Insufficient Software on Desktop:
User productivity costs due to inability to collaborate or run latest versions of software
Down Time / Lost Data:
Costs related to down time or lost data
Security Costs:
Costs related to deploying security solutions for older machines
Hourglass Time:
Costs related to user time spent on waiting for machine to complete processes Typically part of monthly per-seat charge Typically part of lump-sum payment amortized over term of contract (except for leased equipment)
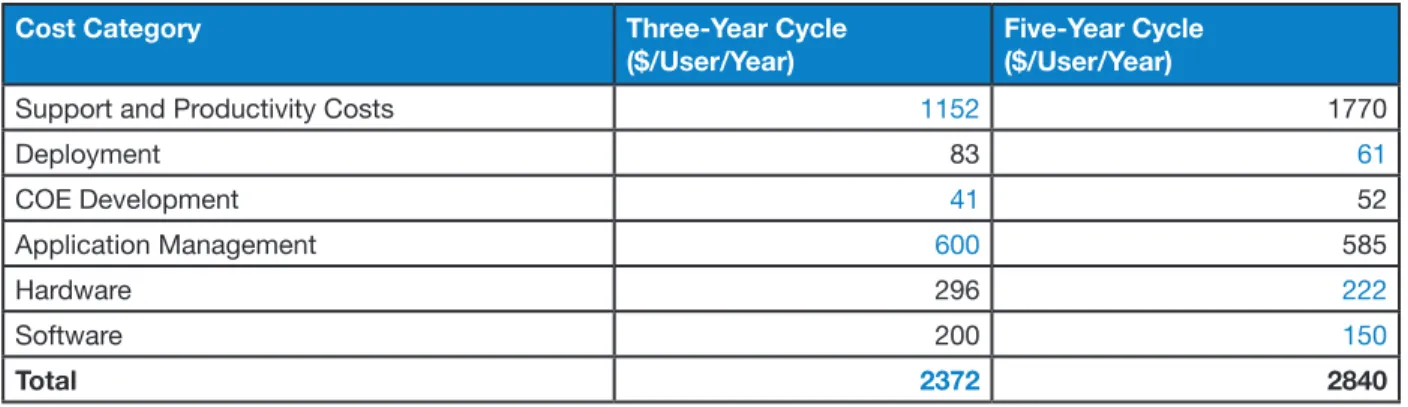
Table 2 presents the quantitative comparisons between a three-year and a five-year refresh cycle. The cost-advantaged numbers in the table are blue.
Note that the total cost for a three-year refresh cycle saves between $450 and $500 per user per year
Pilot Study Results: Timing of Refresh
The results of the pilot study showed that a three-year refresh has a demonstrably lower TCO than a five-year refresh. Table 1 analyzes the various cost elements and how refresh timing relates to them.Cost Component Three-Year
Cycle Cost Advantage Five-Year Cycle Cost Advantage Notes Support
Frequency of help desk calls increases significantly in year 5. Therefore, the three-year cycle has a cost advantage.Deployment
Deployments occur once per refresh. The five-year cycle reduces the frequency of deployments and hence lowers costs. Consistent Office Environment(COE) Development: Engineering
consistent disk images
COE support costs tend to rise in year 5. Thus, the three-year cycle has a slight cost advantage.
Application Management
Applications need to be tested and in some cases ported once per refresh. The five-year cycle reduces the frequency of this process and is therefore lower cost. Hardware &and
A staggered refresh has a reduced effect on cash flow.Productivity Costs
All productivity costs favor a three-yearcycle.
Table 1. Cost Advantage Comparison with Respect to Refresh Cycle
Table 2. Quantitative Comparisons between Three-Year and Five-Year Refresh Cycles
Cost Category Three-Year Cycle
($/User/Year)
Five-Year Cycle ($/User/Year)
Support and Productivity Costs 1152 1770
Deployment 83 61 COE Development 41 52 Application Management 600 585 Hardware 296 222 Software 200 150 Total 2372 2840
compared to the five-year cycle. A company that employed 50,000 people could save up to $25M per year by using a three-year refresh cycle instead of a five-year refresh cycle — a significant savings!
Table 3. Cost Advantage Comparison with Respect to Refresh Method
Cost Component Forklift Cost
Advantage Staggered Cost Advantage Notes Support
Support costs are higher in the staggered refresh due to an inconsistent fleet.Deployment
Deployments occur once per refresh, allowing outsourcers to take advantage of massive econo-mies of scale resulting in “production line” level of ef-ficiencies in deploying PCs. Also, the forklift refresh reduces the frequency of deployments and hence lowers costs.
Consistent Office Environment (COE)
Development
COE support costs are significantly higher in the staggered refresh due to the several environments that must be concurrently maintained. w
Application Management
Applications need to be tested, and in some cases ported, once per refresh. Therefore, the forklift re-fresh has a cost advantage.Hardware and Software
*
A staggered refresh has a reduced effect on cash flow.
*However, this effect can be eliminated by leasing the hardware.
Productivity Costs
All productivity costs slightly favor the forklift refresh.Pilot Study Results: Refresh Method
— Staggered versus Forklift
The results of the pilot study showed that the forklift refresh has an advantage over the staggered refresh method. Table 3 analyzes the various cost elements and how the refresh method relates to them.
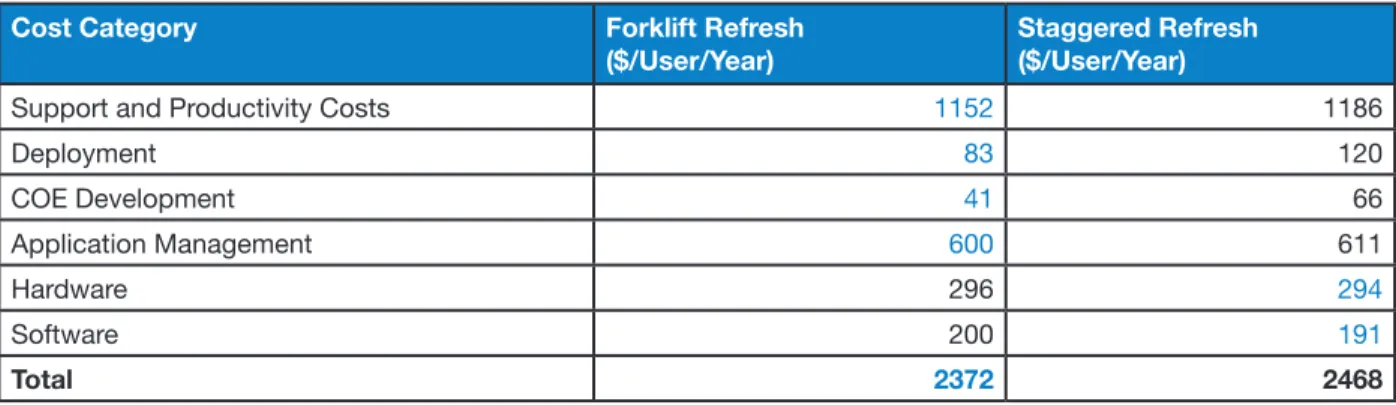
Table 4 presents the quantitative comparisons between a staggered and a forklift refresh. A staggered refresh
assumes refreshing one-third of the fleet refreshed every year for three years, while the forklift refresh assumes the entire fleet is replaced every three years. The cost-advantaged numbers in the table are blue. The differential represents a net present value (NPV) of $275 per PC over three years (utilizing a 10% discount rate).
Table 4. Quantitative Comparisons between Forklift and Staggered Refresh
Cost Category Forklift Refresh
($/User/Year)
Staggered Refresh ($/User/Year)
Support and Productivity Costs 1152 1186
Deployment 83 120 COE Development 41 66 Application Management 600 611 Hardware 296 294 Software 200 191 Total 2372 2468
0.9 0.8 0.7 0.6 0.5 0.4 0.3 0.2 0.1 0.0 <12 24-36 36-48 >48 0.3 0.3 0.5 0.8 Age of PC (Months) Approximately 3 out of 10 users had a computer down in last 12 months
Figure 4. Computer Down Time Related to Age of PC
0.35 0.30 0.25 0.20 0.15 0.10 0.05 0.00 0.07 0.04 0.23 0.32 Age of PC (Months) <12 24-36 36-48 >48
Figure 5. Loss of Data Related to Age of PC
Principal Cost Factors
The principal drivers for costs associated with older PCs include:
Calls to the help desk, and length of call. PC down time.
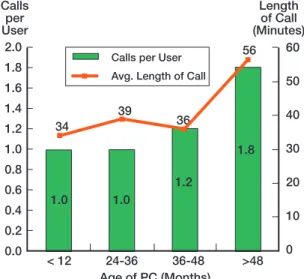
Figure 3 shows how help desk calls increase significantly as a PC ages.
As displayed in Figure 3, users with desktop PCs more than four years old made twice as many help desk calls as did users with desktop PCs that were less than three years old. Users with older PCs also spent more time on the phone with the help desk. However, the number of help desk calls remained essentially constant for users with PCs that were between one and three years old.
Similarly, computer down-time increased significantly in year 5, as displayed in Figure 4.
2.0 1.8 1.6 1.4 1.2 1.0 0.8 0.6 0.4 0.2 0.0 < 12 24-36 36-48 >48 Age of PC (Months) 60 50 40 30 20 10 0 Calls per User Length of Call (Minutes) 34 39 36 56 1.0 1.0 1.2 1.8
Calls per User Avg. Length of Call
Figure 3. Number of Help Desk Calls Related to Age of PC
Figure 4 shows that for computers older than four years, down time was twice that of three-year-old computers. However, the down time remained constant for users with PCs that were between one and three years old.
Other cost factors, although not as significant as help desk calls and computer down time, include the following:
Loss of data Security breaches
Figure 5 and Figure 6 illustrate how these cost factors relate to PC age.
As displayed in Figure 5, users with PCs older than four years lost data three times more often than users with PCs that were less than three years old. In fact, the lost data occurrence rate was actually less in year 3 than it was in year 1.
Figure 6 shows that users with PCs older than four years had security breaches three times more often than users with PCs less than three years old.
0.30 0.25 0.20 0.15 0.10 0.05 0.00 0.00 0.18 0.05 0.28 Age of PC (Months) <12 24-36 36-48 >48 Number of Security Breaches per User
Figure 6. Security Breaches Related to Age of PC
Conclusions for Outsourcers
Some conclusions can be drawn from the data shown in Figures 3-6, both in terms of PC refresh timing and PC refresh method.
Refresh Timing: There is a significant savings opportunity for outsourcers if they can convince clients to move to shorter refresh cycles. Two reasons for this are:
Outsourcer costs associated with a three-year
refresh cycle are significantly less than costs associated with a five-year refresh cycle.
Many outsourcer contracts have a flat-fee
component, where the revenue for the outsourcer is constant regardless of the number of support calls. Therefore, a reduced number of help desk calls will increase margins for the outsourcer. A three-year refresh cycle provides the least number of support calls per user.
Refresh Method: Similarly, a forklift (all-at-once) refresh results in lower TCO for outsourcers.
The difference in cost between the forklift and
staggered methods is more pronounced when the client has a diverse PC population.
While an outsourcer can pass on some of the
cost increase to its customers, the outsourcer is nevertheless likely to incur decreased margins by avoiding forklift refreshes.
Intel and the Intel logo are trademarks or registered trademarks of Intel Corporation or its subsidiaries in the United States and other countries. *Other names and brands may be claimed as the property of others.
Copyright © 2004, Intel Corporation. All rights reserved.
302227-001