Determination of Capacitor Life as a Function of Operating Voltage and Temperature David Evans
Evans Capacitor Company
Background
Potentiostatically charged Hybrid capacitors age predictably by a mechanism involving electrochemical reactions that reduce the efficiency of the cathode and consume
electrolyte. One of these reactions results in the formation of hydrogen at the cathode which reacts irreversibly with the tantalum foil substrate. The material formed is much less conductive than the original. The consequence to capacitor performance is an increase in ESR and a decrease in capacitance.
It has been assumed that the rate of this wear-out mechanism is directly related to the leakage current in the capacitor. This means that the relative age of a capacitor is proportional to the quantity of charge passed as leakage current. If one knows what quantity of charge a capacitor can pass over its useful life, capacitor life can be easily estimated by determining the leakage current under any proposed operating conditions. Leakage current in a capacitor at a particular voltage can be determined at least two ways. It can be measured directly by charging the capacitor potentiostatically and reading the steady-state minimum value of current. Typically, several hours or even days are needed for the capacitor to stabilize sufficiently to properly determine leakage current. Under high temperature and voltage conditions, time spent experimenting can amount to a significant fraction of capacitor life. Since the leakage current typically changes with age, direct comparison of the results at one temperature with the results at other
temperatures is complicated. Because the leakage current is usually on the order of tens of microamps, a very stable voltage source is also essential. Any fluctuation in potential results in additional charging and or discharging current that will confound leakage current determination. These characteristics make determination by this method somewhat time consuming and subjective, resulting in probably considerable error and annoyance especially considering the large number of measurements desired.
Nonetheless, we found using a form of this approach necessary to determine charge passed over life as described below.
Another approach has been found that yields leakage current as a continuous function of capacitor voltage. This method eliminates the problem of current stabilization because the capacitor is charged only once at each temperature. Since the capacitor needed only be charged a few times for 24 hours, negligible aging occurred. We monitored the voltage of a capacitor as it discharged open-circuited. Using the data and this formula of the physical definition of capacitance,
I = C dV / dt ,
we calculated the leakage current as a function of voltage.
As already mentioned, discovery was also made of the time a capacitor will last under potentiostatic charge and the total charge passed as a capacitor ages. As the life with respect to charge is presumed independent of temperature, it was necessary to measure the charge passed under constantly charged conditions lasting the life of the capacitor at one temperature at least. Estimated life equals the charge passed divided by the leakage current.
Experimental
1) Measurement of charge life. The circuit shown above in Figure 1 was used to monitor the charging current on a THQ3100 capacitor. This capacitor was rated at 100 volts. Although the leakage current depends on voltage and temperature, the total charge passed over life does not. In this determination, the experiment was made at 100 volts at a temperature of 95°C, an accelerated ageing condition. End of life was reached when the ESR doubled. The ESR and capacitance were measured every 250 hours.
2) Measurement of self-discharge voltage. We monitored the open circuit discharge voltage of a single THQ3100 capacitor from 100 volts at various temperatures. The capacitor was charged for at least 24 hours before opening the switch and allowing the capacitor to self-discharge. To avoid loading the capacitor, a high resistance electrometer having resistance of >200T ohms was used. The experiment was repeated at several temperatures giving at least 24 hours before each for charge and temperature
stabilization. Figure 2 below is a diagram of the circuit used.
These two figures show the results of the first part of the experiment. As shown in Figure 3 below, the ESR of the capacitor had doubled from the start to the 750 hour
measurement, indicating end of life.
THQ3100 LIFE 100V @ 95°C
0 10 20 30 40 50 60 70 80 90 100
0 250 500 750 1000
time (h)
ESR (mohms)
4000 4400 4800 5200 5600 6000
Capacitance (uF)
Figure 3.
THQ3100 100V @ 95°C
0 1000 2000 3000 4000 5000 6000 7000 8000 9000
0 100 200 300 400 500 600 700 800 900 1000
Time (h) Current (uA) Charge (C)
charge
current
At the end of life, 8050 coulombs had passed. The average leakage current was therefore approximately 3 milliamps as shown in Figure 4. The gap in current from about 150 to 170 hours was due to a power failure associated with “hurricane” Irene. The other breaks ca. 250 and 500 hours indicate stoppages to measure capacitance and ESR.
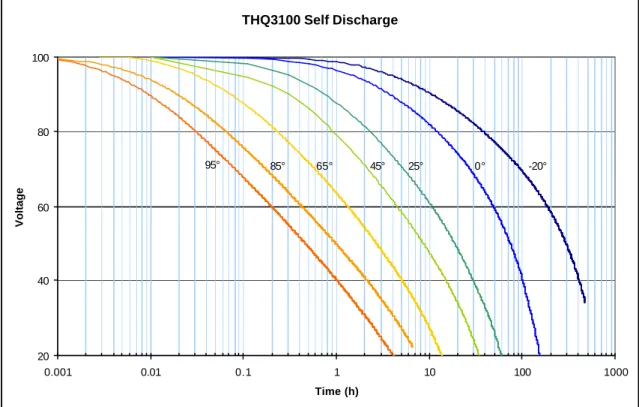
THQ3100 Self Discharge
20 40 60 80 100
0.001 0.01 0.1 1 10 100 1000
Time (h)
Voltage
-20° 0°
25° 45° 65°
85° 95°
Figure 5. Open circuit voltage over time of THQ3100 initially charged to 100 volts. The set of second experiments yielded the family of curves of voltage with respect to time shown in Figure 5. The derivation of leakage current from the above data depends on the capacitance value of the device under test. Because capacitance is not constant, but depends on capacitor temperature as shown in Figure 6, a different value of
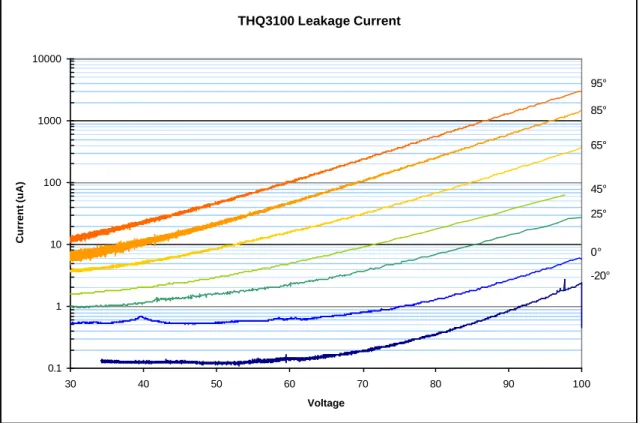
capacitance was used in each calculation. The results are shown in Figure 7. Using the formula to derive leakage current from the results of the self-discharge experiment assumes the capacitance is known. This assumption may not be strictly correct, as capacitance does change somewhat unpredictably over life. However, since the capacitor did not age significantly in the experiments measuring self discharge, this deviation was ignored. The capacitance also has predictable temperature dependence and its value at temperature as shown in Figure 6 was used in the calculation.
Leakage current at 100V derived from self-discharge compares very closely with the leakage current indicated on a meter for potentiostatic charge at a given temperature. For instance, the calculated value for leakage current at 100 volts and 95°, 3mA as shown in Figure 7, was identical to the 3mA measured current in the same capacitor charged to 100 volts.
THQ3100572 (120Hz)
0 0.001 0.002 0.003 0.004 0.005 0.006 0.007 0.008
-60 -40 -20 0 20 40 60 80 100 120 140
Temperature (°C)
Capacitance (F)
Figure 6. Capacitance depends on temperature.
THQ3100 Leakage Current
0.1 1 10 100 1000 10000
30 40 50 60 70 80 90 100
Voltage
Current (uA)
95° 85°
65°
45° 25°
0° -20°
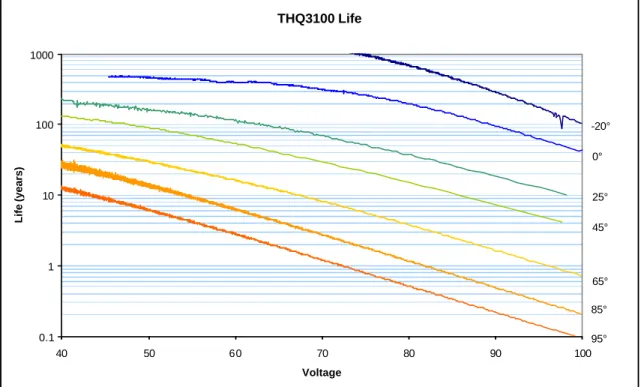
THQ3100 Life
0.1 1 10 100 1000
40 50 60 70 80 90 100
Voltage
Life (years)
-20°
0°
25°
45°
65°
85°
95°
Figure 8. THQ3100 Life. If the operating temperature and voltage are known, the life of the capacitor can be predicted with this chart.
Converting leakage current to estimate life, we divided the 8050 coulombs of charge passed over life by the leakage current. The results are shown in Figure 8.
Conclusion
A useful approach was developed using self-discharge measurements to allow the easy calculation of leakage current and life over a wide range of operating temperatures and voltages. The leakage current increased exponentially in the range of 50% to 100% of rated voltage at each temperature.
While predictions of >100 year life are shown for room temperature (and lower) parts operating at 60% or less of rated voltage, this process deals with the only known wear-out mechanis m in these capacitors. Others that work over very long times are awaiting discovery so cannot be factored in here. We ignore them at our peril. The data presented are based on the evaluation of just two capacitors, one for the life test and one for the self-discharge measurements. With that understanding, predictions of life extending beyond about 20 years should be used with due caution. Nevertheless, the chart greatly aids relative analysis of the life under various conditions for this capacitor.
We have a list of over 70 different hybrid capacitors that await evaluation. Unless
facilities are expanded to allow evaluation of several parts at once, it will take many years to complete them all.