Successful College and
University Foreign Language
Programs, 1995–99: Part 2
Program Features Associated with Rising Enrollments in
Advanced Courses and with Increasing Numbers of Majors
David Goldberg, Natalia Lusin, and Elizabeth B. Welles
THE MLA’s Office of Foreign Language Programs has
undertaken a project funded by the Andrew W. Mellon
Foundation to discover what factors make foreign
lan-guage programs successful. The field is increasingly
aware of evolving conditions affecting foreign language
programs in colleges and universities in this country.
For one thing, enrollment patterns are changing.
Be-fore the project was undertaken, the MLA’s 1995 and
1998 enrollment surveys showed that while the
num-ber of students studying languages remained relatively
stable, Spanish enrollments represented more than
half the total, and student interest had declined in
three traditionally taught languages—French,
Ger-man, and Russian. Enrollment in less commonly
taught languages (LCTLs) was increasing slightly, and
of those students not taking Spanish a greater number
were studying a greater number of languages (Brod and
Welles 23 and 28; table 1). The most recent
enroll-ment survey for fall 2002 shows a marked change:
regis-trations are up in all the fifteen most commonly taught
languages. Increases are particularly notable for
Ameri-can Sign Language, Arabic, and Italian. The downward
trends for German, French, and Russian have stabilized
or shown signs of reversal. The number of LCTLs
of-fered and the number of students studying them
in-creased substantially as well (Welles, tables 1a and 1b).
The national context of foreign language and
liter-ature programs presents complex challenges. Most
parents are eager for their children to study a second
language in elementary and secondary schools. Yet the
public perception that learning a language other than
necessary to know the primary language of someone
whose second or third is English discourage heritage
language speakers from maintaining their home
lan-guages and English speakers from learning new ones.
Furthermore, the teaching of languages has changed
dramatically in the last several decades. The
techno-logical revolution allows access to languages and
cul-tures in completely new ways; today’s students, skilled
in the uses of computers and the Internet, expect to
take advantage of these tools in the classroom.
Stu-dent populations, more diverse in age, ethnicity, and
preparation for college, are increasingly career-minded
and concerned that their language study be useful to
them. The traditional rationale that learning a
lan-guage deepens understanding of the world through
the study of the linguistic, literary, and cultural
arti-facts of another people has been supplemented by the
idea that language knowledge will be practical and
enhance professional situations in later life.
In the face of these changes and challenges, we
wanted to find out how departments are managing
and what conditions favor departmental success. Our
fall 1999 survey collected information about the
David Goldberg is Acting Director of MLA Foreign Language Pro-grams and the Association of Departments of Foreign Languages. Natalia Lusin is Assistant Director of Information Services, English and Foreign Language Programs. Elizabeth B. Welles is the former Director of MLA Foreign Language Programs and the Association of Departments of Foreign Languages.
distribution of certain teaching approaches, curricular
characteristics, administrative arrangements, and
re-sources for faculty members, as well as data about
en-rollments in introductory and advanced courses and
the number of majors in 1995 and 1999. We defined
successful departments as those with rising enrollments
and an increasing number of majors. Although we
rec-ognize that quantitative assessment leaves out much
about the quality and texture of education and about
the achievements of students, enrollment figures and
numbers of majors are among the most visible signs of a
flourishing department and in administrators’ eyes are
often the basis for awarding faculty lines, technological
resources, and other forms of support. Further,
enroll-ment is a gauge that can be consistently measured.
We sent the survey to 2,631 undergraduate
depart-ments in two- and four-year institutions; the overall
response rate was 75%. While 1,962 departments
teaching 119 languages responded, the
language-specific responses reflect the separate language
pro-grams housed in each department, and their total
number was 6,022. Of these programs, 3,926 were in
BA-, MA- or PhD-granting departments. The analysis
in this report is based on responses from the 2,738
lan-guage programs in 65 lanlan-guages that reported offering
advanced courses and the 1,981 programs that reported
majors in the years 1995 and 1999. The responses from
two-year colleges will be the subject of a future report.
Our first report of the project examined the overall
distribution of program features queried in the survey,
general trends in enrollments at introductory and
ad-vanced levels, and numbers of majors in the seven
languages that had the largest number of students
(Goldberg and Welles, “Successful . . . Programs”).
The introductory level was defined as beginning and
intermediate courses up to the bridge or transitional
course (if it existed); the advanced level was defined
as all courses beyond an introductory sequence taught
in the target language. The report included an
analy-sis of those features associated with growing
enroll-ments in introductory courses. It may be found on our
Web site at www.adfl.org, and highlights of it appear
in the
ADFL Bulletin
(Goldberg and Welles, “From
the Editors”). The current study focuses on those
fac-tors most often associated with rising enrollments at
the advanced levels and with increasing numbers of
majors. Members of the foreign language and
litera-ture profession should be encouraged to see that the
Enrollments in Advanced Courses and Majors
What specifically do we know about advanced courses
and majors, and what do we know about them in
rela-tion to each other and the introductory sequence?
Ad-vanced course work is not offered to the same degree
across all languages in undergraduate programs.
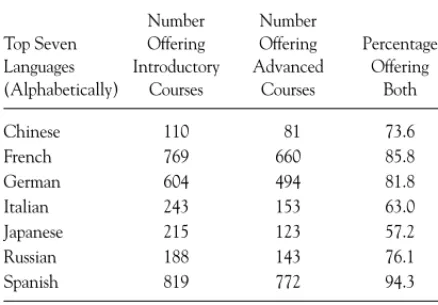
Ta-ble 1 shows the number of programs in the top seven
languages and the percentage of those programs that
offer both introductory and advanced courses; 76% is
the average.
The ratio of introductory to advanced course
en-rollments is found in table 2. The ratios fall between
2.1 and 3.1 introductory students per advanced
stu-dent, except in Italian, where the ratio is 4.9.
Table 3 displays the ratio of enrollments in
intro-ductory classes to the number of majors (including
double majors). There is one major for approximately
Table 1
Programs Offering Introductory and Advanced
Courses, by Language (Fall 1999)
Number Number
Top Seven Offering Offering Percentage Languages Introductory Advanced Offering (Alphabetically) Courses Courses Both Chinese 110 81 73.6 French 769 660 85.8 German 604 494 81.8 Italian 243 153 63.0 Japanese 215 123 57.2 Russian 188 143 76.1 Spanish 819 772 94.3
Table 2
Ratio of Students in Introductory Courses to
Students in Advanced Courses, by Language and
by Highest Degree Granted in the Department
(Fall 1999)
Highest Degree Granted
Language BA MA PhD Overall Chinese 2.4 2.7 2.8 2.4 French 2.8 2.9 2.5 2.8 German 2.5 3.3 2.2 2.5 Italian 4.3 5.7 4.5 4.9
every four students in introductory courses in the
languages with the lowest enrollments (Russian,
Jap-anese, and Chinese). For French, German, and
Span-ish the ratio is somewhat higher, and for Italian it is
even higher, possibly because of the relatively few
programs that offer advanced-level courses. The ratio
of advanced-level enrollments to number of majors
(table 4) is much lower and more consistent across
languages; one out of every two or three students in
an advanced course is likely to be a major or double
major. Spanish programs, which overall have a much
greater number of students than other languages,
show about the same ratio of advanced enrollments
to majors as do other language programs.
Part 1 of the study found that in many departments
enrollments in both introductory and advanced courses
had increased from fall 1995 to fall 1999. While growth
in enrollments may indicate a healthy program, stable
enrollments, particularly in the light of falling national
enrollments reported in the MLA’s 1998 enrollment
survey, may also be taken as a sign that a program is
doing well. In fact, for each language except Russian at
the advanced level the combined percentage of
pro-grams with stable and growing enrollments in all the
programs in this study (including those in two-year
col-leges) is higher than that of programs with decreasing
enrollments (Goldberg and Welles, “Successful . . .
Programs” 174–78). Table 5 shows enrollment change
in advanced courses in four-year institutions. The
per-centages in the BA-, MA-, and PhD-granting groups
are weighted according to their size, and the “Overall”
averages are calculated from them. In French,
Ger-man, and Japanese, the percentage of programs with
increasing enrollments is approximately 45%; the
per-centage in Chinese, Italian, and Spanish ranges from
54.3% to 62.9%. Russian was lowest at 32.9%. In
in-creasing and stable enrollments combined, six
lan-guages were higher than 50%; programs with advanced
courses that were increasing or stable in Russian made
up less than 50%. Overall, the percentage of programs
with increasing enrollments was 50.3%; for programs
that maintained or increased enrollments it was 66.1%.
Course enrollments are an important measure of a
de-partment’s strength, but they are not the only numeric
indicator of its ability to retain students; an increase in
the number of majors is also significant. In four-year
undergraduate programs, more than half of those in
Chinese, Japanese, and Spanish and half in Italian
ex-perienced growth in majors between 1995 and 1999
(table 6). Overall, 51.8% of the language programs
studied reported an increased number of majors, and
68.8% indicated a stable or increased number of majors.
The Correlation of Program Practices and
Enrollment Growth
We focus first on programs with increasing
enroll-ments at advanced levels and second on programs
that report a rise in the number of majors. The
analy-sis of the data shows which program features (e.g.,
study abroad, a language requirement) are associated
with enrollment growth and to what degree that
as-sociation exists. While our data show only the
co-occurrence of a feature with increasing, stable, or
decreasing enrollments—which is not the same as
showing cause and effect—the reader may be prompted
to ask, “Does feature X actually attract students to a
language course?” It is not unreasonable in many cases
Table 3
Ratio of Students in Introductory Courses to
Number of Majors, by Language and by Highest
Degree Granted in the Department (Fall 1999)
Highest Degree Granted
Language BA MA PhD Overall Chinese 3.7 4.8 5.4 4.4 French 6.7 8.9 8.9 7.2 German 6.0 8.1 9.5 6.7 Italian 14.5 9.6 24.9 19.7 Japanese 4.0 4.3 6.3 4.6 Russian 3.7 4.7 4.9 4.4 Spanish 8.7 8.9 10.2 8.9
Table 4
Ratio of Advanced-Level Enrollments to Number
of Majors, by Language and by Highest Degree
Granted in the Department (Fall 1999)
Highest Degree Granted
Language BA MA PhD Overall Chinese 2.0 2.0 2.7 2.0 French 2.5 2.6 3.7 2.5 German 2.5 2.4 3.6 2.5 Italian 2.9 2.5 5.2 3.6 Japanese 1.8 1.7 2.1 1.8 Russian 2.3 2.2 2.0 2.3
Table 5
Enrollment Change in Programs with Advanced
Courses between Fall 1995 and Fall 1999, by
Language and by Highest Degree Granted in the
Department (Percentage of Programs)
Highest Degree Granted Enrollments by Language BA MA PhD Overall Chinese Decreasing 20.0 50.0 27.3 27.2 Increasing 62.2 50.0 54.5 58.0 Stable 17.8 0.0 18.2 14.8 Increasing and stable combined 80.0 50.0 72.7 72.8 No. of programs 45 14 22 81 French Decreasing 40.1 37.0 45.3 40.3 Increasing 41.1 49.0 50.0 43.2 Stable 18.8 14.0 4.7 16.5 Increasing and stable combined 59.9 63.0 54.7 59.7 No. of programs 496 100 64 660 German Decreasing 37.9 55.4 39.3 40.7 Increasing 43.1 33.8 57.1 43.3 Stable 19.0 10.8 3.6 16.0 Increasing and stable combined 62.1 44.6 60.7 59.3 No. of programs 364 74 56 494 Italian Decreasing 27.4 17.1 35.7 28.1 Increasing 56.5 54.3 51.8 54.3 Stable 16.1 28.6 12.5 17.6 Increasing and stable combined 72.6 82.9 64.3 71.9 No. of programs 62 35 56 153 Japanese Decreasing 36.7 38.1 43.5 38.2 Increasing 46.8 47.6 47.8 47.2 Stable 16.5 14.3 8.7 14.6 Increasing and stable combined 63.3 61.9 56.5 61.8 No. of programs 79 21 23 123 Russian Decreasing 52.5 45.2 62.5 53.1 Increasing 32.5 35.4 31.2 32.9 Stable 15.0 19.4 6.3 14.0 Increasing and stable combined 47.5 54.8 37.5 46.9 No. of programs 80 31 32 143 Spanish Decreasing 21.2 25.9 18.5 21.8 Increasing 61.1 59.8 81.5 62.9
Table 6
Change in the Number of Majors between
Fall 1995 and Fall 1999, by Language and by
Highest Degree Granted in the Department
(Percentage of Programs)
Highest Degree Granted No. of Majors, by Language BA MA PhD Overall Chinese Decreasing 12.5 22.2 7.1 12.8 Increasing 70.8 77.8 78.6 74.4 Stable 16.7 0.0 14.3 12.8 Increasing and stable combined 87.5 77.8 92.9 87.2 No. of programs 24 9 14 47 French Decreasing 37.3 36.5 33.3 36.8 Increasing 43.9 45.9 56.2 45.5 Stable 18.8 17.6 10.5 17.7 Increasing and stable combined 62.7 63.5 66.7 63.2 No. of programs 394 85 57 536 German Decreasing 38.2 44.4 40.4 39.4 Increasing 39.7 37.1 46.8 40.2 Stable 22.1 18.5 12.8 20.4 Increasing and stable combined 61.8 55.6 59.6 60.6 No. of programs 262 54 47 363 Italian Decreasing 28.6 33.3 37.2 33.7 Increasing 53.5 50.0 51.2 51.7 Stable 17.9 16.7 11.6 14.6 Increasing and stable combined 71.4 66.7 62.8 66.3 No. of programs 28 18 43 89 Japanese Decreasing 22.6 50.0 37.5 32.2 Increasing 54.8 50.0 50.0 52.5 Stable 22.6 0.0 12.5 15.3 Increasing and stable combined 77.4 50.0 62.5 67.8 No. of programs 31 12 16 59 Russian Decreasing 58.5 28.0 67.9 53.8 Increasing 24.5 44.0 32.1 31.1 Stable 17.0 28.0 0.0 15.1 Increasing and stable combined 41.5 72.0 32.1 46.2 No. of programs 53 25 28 106 Spanish Decreasing 18.5 20.6 22.0 19.1 Increasing 64.4 63.9 72.9 65.2
All responses were analyzed by comparing programs
with and without a specified feature or characteristic in
the categories of decreasing, stable, and increasing
en-rollments. In this report, we focus on the relation of
features to increasing enrollments. The percentage that
expresses the correlation of growth with a feature
equals the difference between the percentage of
pro-grams that have the feature and the percentage that do
not. For example, when there was a full-time
coordina-tor for the introduccoordina-tory sequence, 50% of French
pro-grams had increasing advanced enrollments; in the
absence of that coordinator, 37.2% had increasing
en-rollments. The correlation with growth is the difference
between those percentages: 12.8%. Thus we can say
that programs in French with a full-time
introductory-level coordinator are 12.8% more likely to experience
advanced enrollment growth than those that do not
have one (table 7; to compare French with the other
languages and language groups, see fig. 1N on p. 43).
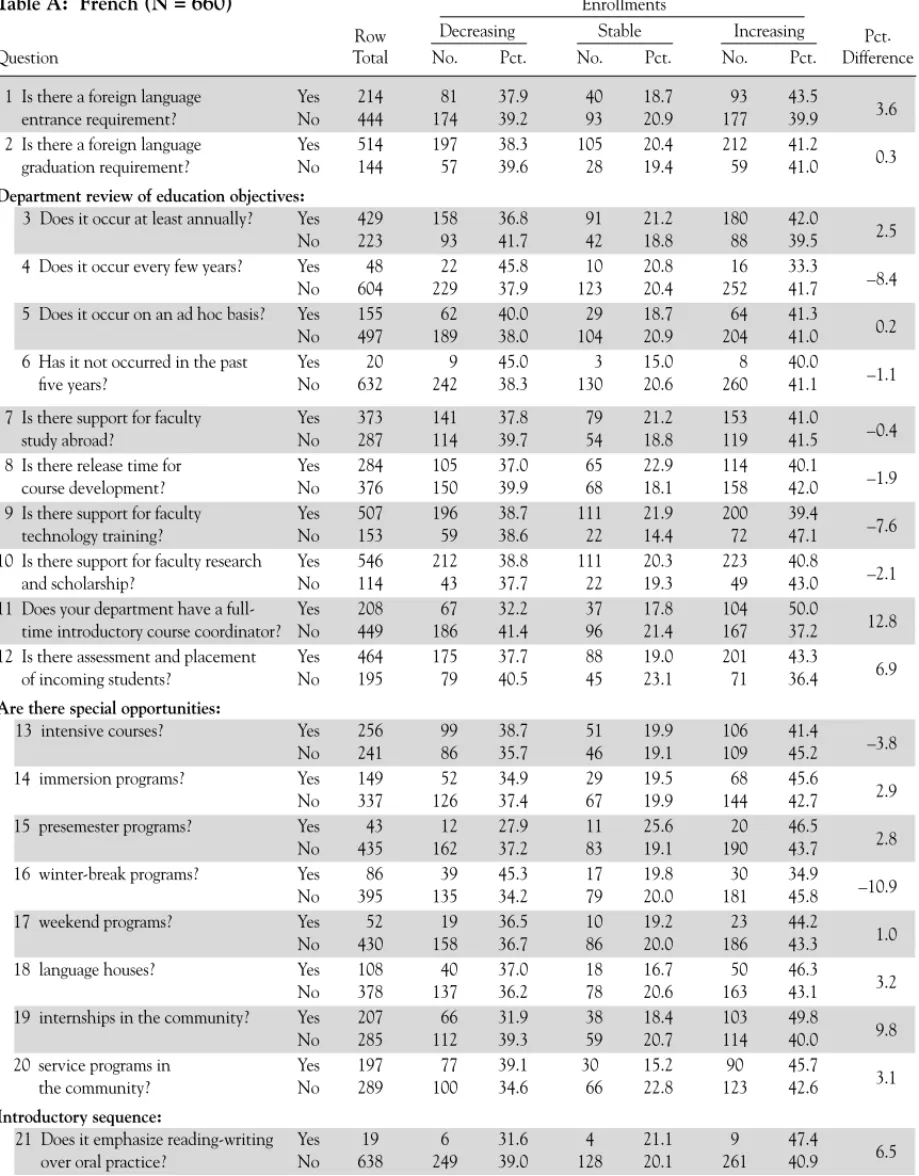
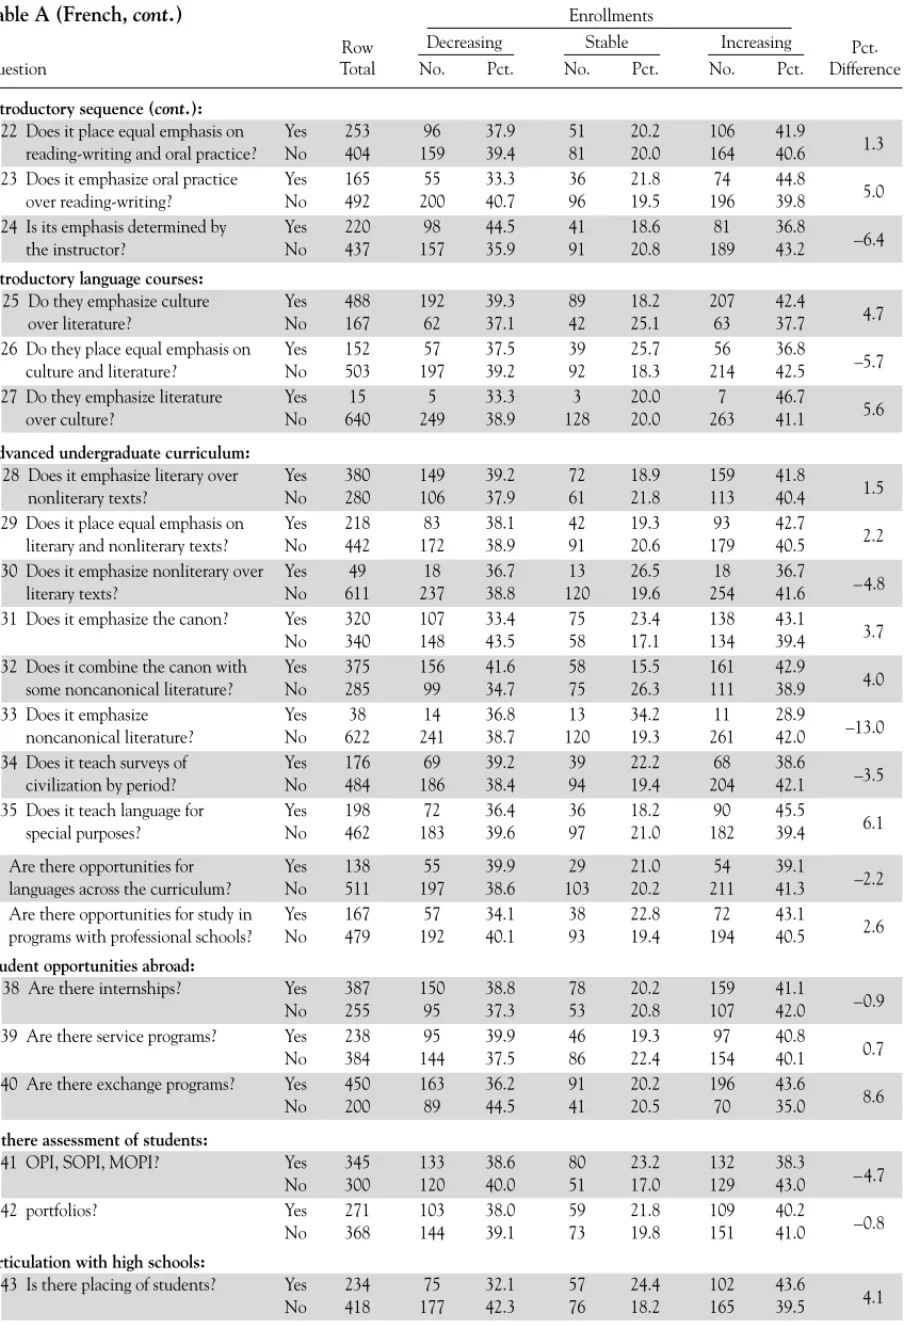
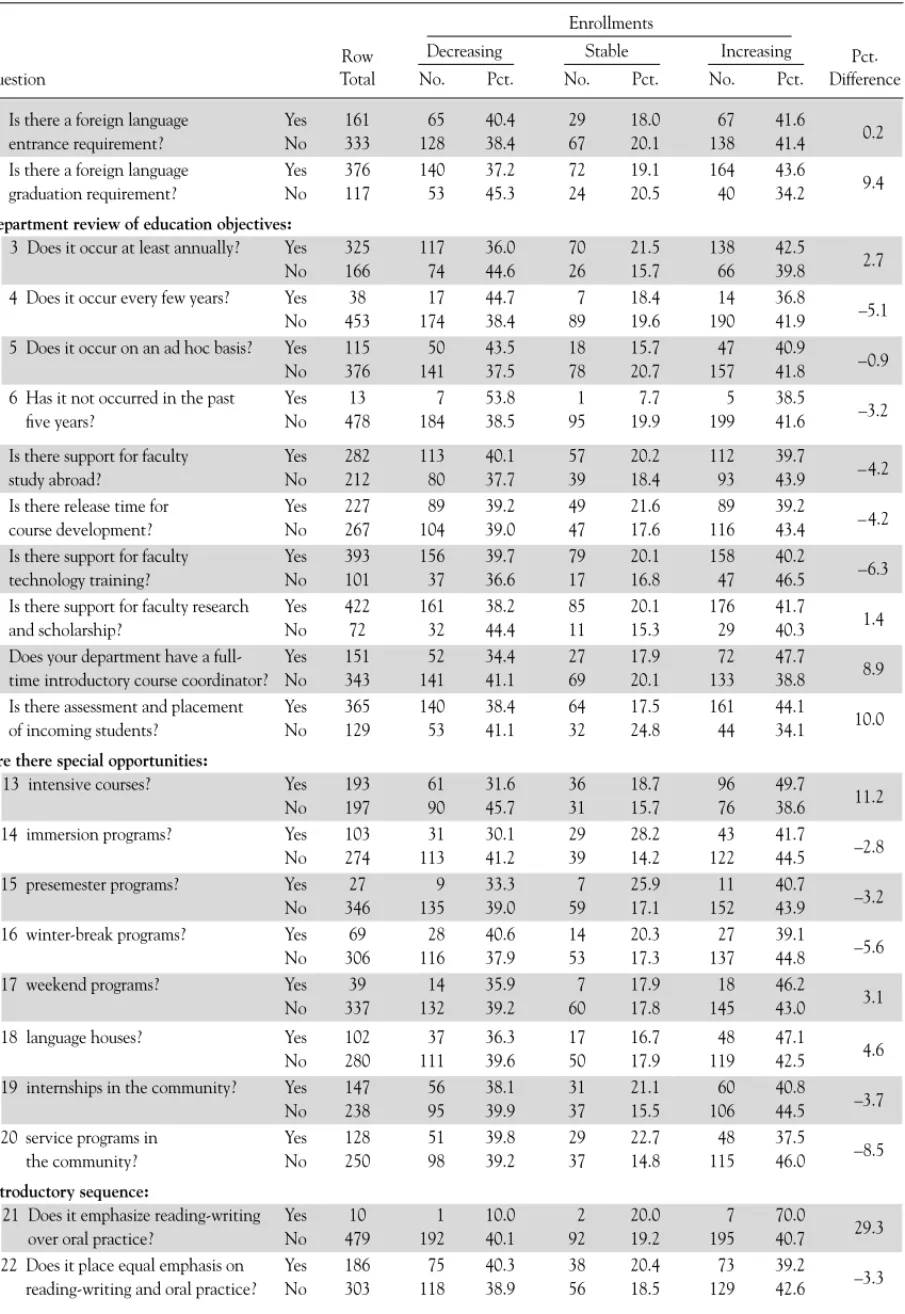
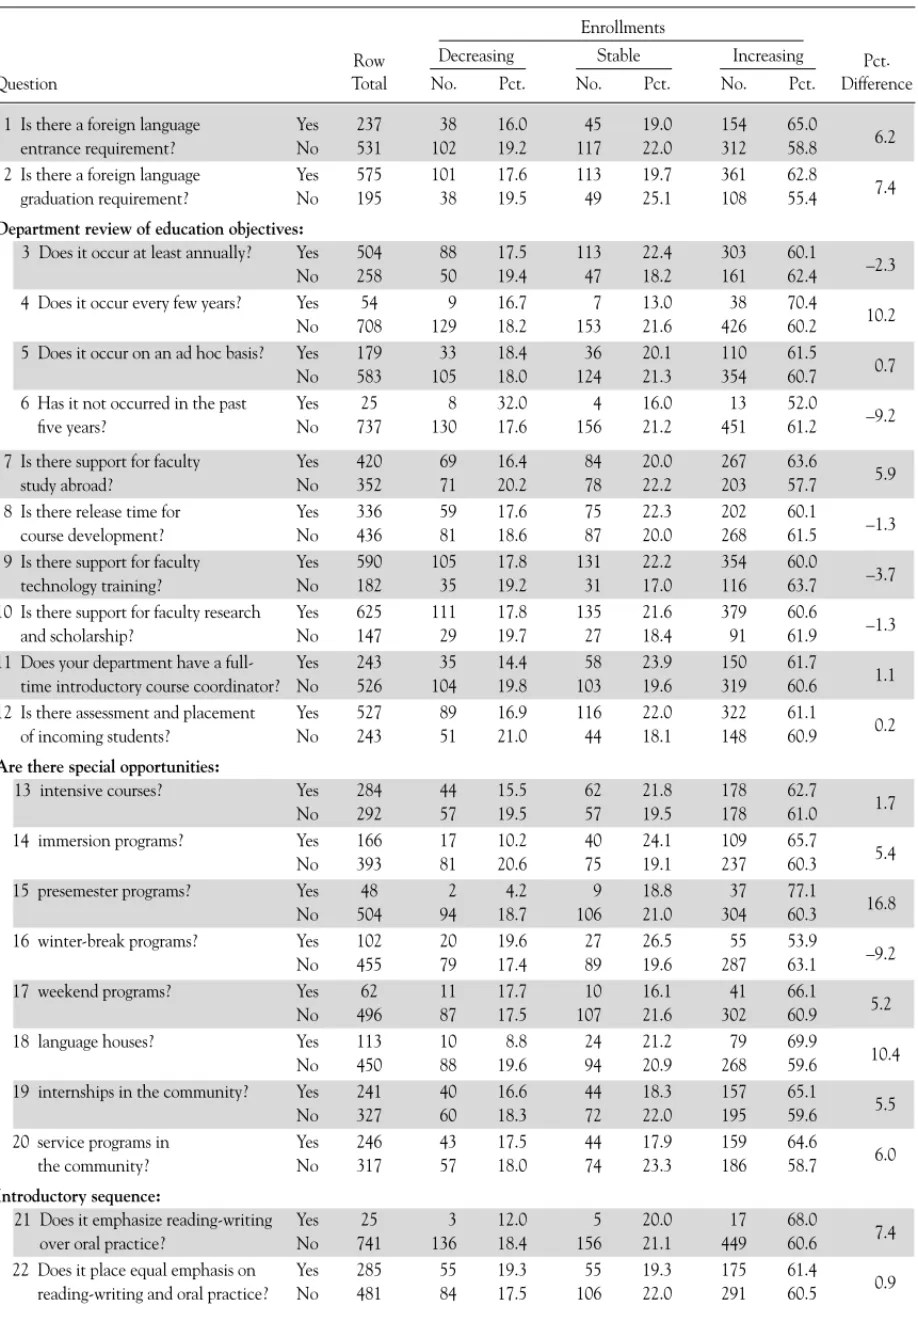
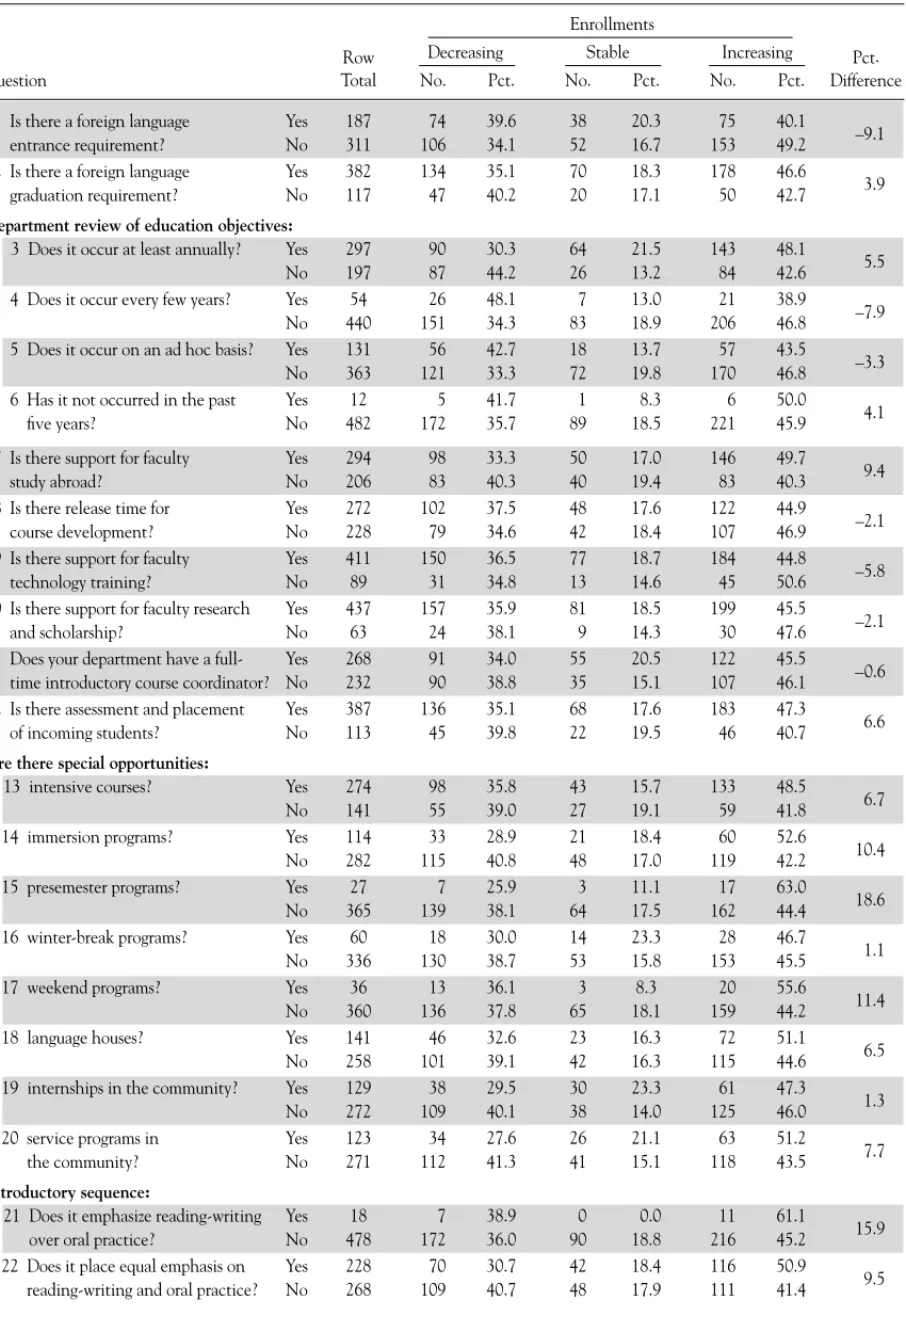
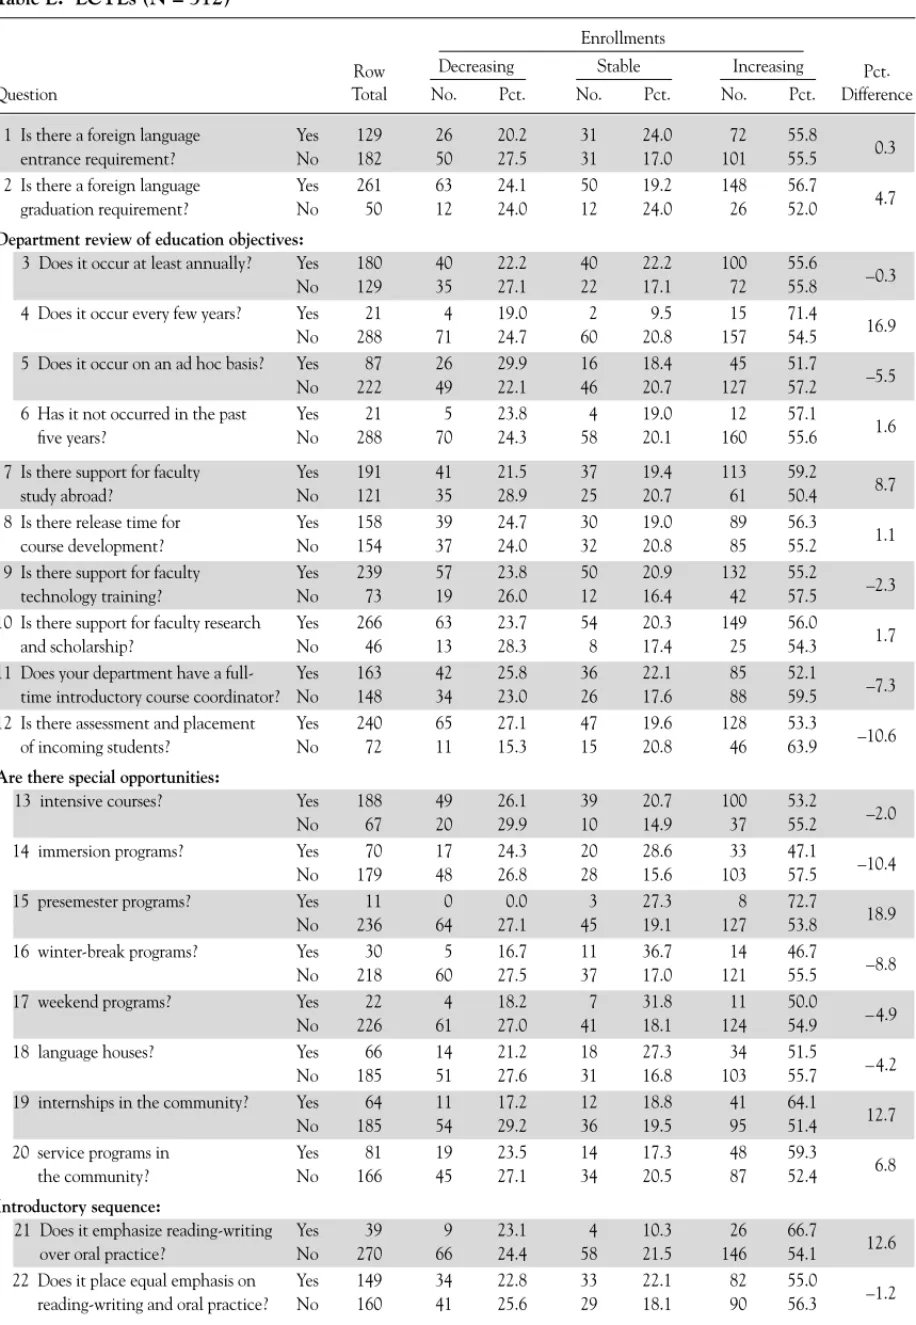
Appendix tables A–E show in detail the
percent-ages and the numbers they represent for features or
characteristics and categories of enrollment change
(growth, stability, or decline) in five languages or
lan-guage groups. (The percentages add up to 100% across
a row.) Since there was great variation in the numbers
of responses among the different languages, we put
some languages in groups to make the numbers of
pro-grams more similar while retaining as much as
possi-ble the distinctions among languages. French has 660
programs, German 494, Spanish 772; Chinese (81),
Italian (153), Japanese (123), and Russian (143) are
grouped and labeled CIJR (500); the other 58
lan-guages, the least commonly taught lanlan-guages, are
grouped and labeled LCTLs (312).
Calculating the Strength of Correlation
In this report, we distinguish among features that are
we refer also to features that are not indicated by the
data to have that association in any meaningful
de-gree.) We determine the strength of association with
growth on the basis of the percentage difference
be-tween programs reporting a gain in advanced
enroll-ments and having the feature in question and programs
reporting a gain in advanced enrollments but lacking
the feature in question. The features very strongly
asso-ciated with the gain generally have a correlation with
growth over 8% (some are well over 20%) in at least
three of the five languages or language groups. We
char-acterize features as having a strong association or
corre-lation with growth when they are over 4% more likely
to occur in programs with increasing enrollments in at
least three of the five languages or language groups.
Al-though 4% may appear to represent only a modest
dif-ference in gain from 1995 to 1999, it signals a steady
annual average gain of 1%, and the consistency of that
gain (not to mention the possibility of its
continua-tion) is significant. Features only occasionally (though
still significantly) associated with increasing advanced
enrollments also showed a 4% or greater likelihood to
occur in programs having the feature in question but in
only two of the five languages or language groups.
Features Showing a Very Strong Correlation
with Growth
Five features show a very strong correlation with
in-creasing enrollments, specifically above 8% (often
much above) in at least three of the five language
groups (French, German, Spanish, CIJR, and LCTLs).
Study Abroad
In part 1 of this report, study abroad correlated more
strongly than any other program feature with
increas-ing enrollments at introductory levels. Study-abroad
Table 7
Percentage Difference (Correlation with Growth) in Advanced Enrollment in French Programs
That Have and Do Not Have a Full-Time Introductory Course Coordinator in the Department
Enrollment
Decreasing Stable Increasing Pct. No. Pct. No. Pct. No. Pct. Difference Departments with a coordinator 67 32.2 37 17.8 104 50.0
12.8 Departments without a coordinator 186 41.4 96 21.4 167 37.2
that they did not offer opportunities for study abroad,
and approximately 7% said that their study-abroad
enrollments had decreased. Close to 54% said that
their study-abroad enrollments grew between 1995
and 1999; slightly more than 25% said that their
en-rollments abroad were stable.
The correlation of growth in study abroad with
growth at advanced levels is also very strong. The
pop-ularity of study abroad and its positive relation with
enrollments follows other trends that we have found
in this study. Students take advantage of opportunities
to practice their language and deepen their knowledge
of another culture in an authentic environment.
Figure 1A, derived from the data in the appendix,
shows the relation between change in advanced
enroll-ments and the growth or lack of growth in study-abroad
programs. The greatest difference in the category of
increasing enrollments between programs that had
growth in study abroad and those that did not is in
Spanish, where programs were 18.3% more likely
(68.5% – 50.2%) to experience gain in advanced
en-rollments if they had a growing study-abroad program
(for more detail, see app. table C, question 77;
differ-ences between percentages in the bar graphs may be
off by .1% or .2% because of rounding).
1The weakest
correlation between growth in study abroad and gain in
enrollments (57.0% – 55.6% = 1.4%) is in the LCTLs;
the correlation with growth for the other language
groups is 12.2% for German, 8.0% for French, and
6.6% for CIJR.
Enrollments in the Introductory Sequence
There is a very strong degree of correlation between
growing enrollments at the introductory level and
growth in advanced enrollments. This result is what we
might expect: a good experience in an introductory
se-quence will likely propel students to the next level (just
as a bad experience will do the opposite). But
statisti-cal confirmation of the relation of strong introductory
programs with good enrollments in advanced courses
provides an argument for thinking carefully about
departmental resources and giving attention to
lower-division curricula and teaching. Figure 1B illustrates
the relation between change in advanced enrollments
and growth or lack of growth in introductory courses.
Figure 1A
The Relation between Change in Advanced Enrollments and a Program Feature or Characteristic:
Is Study Abroad Growing?
Percentages 37.2% 18.4% 44.4% 40.5% 23.1% 36.4% 33.3% 19.9% 46.8% 46.9% 18.5% 34.6% 17.1% 68.5% 23.2% 26.6% 50.2% 32.9% 18.4% 48.7% 40.3% 17.6% 42.1% 27.3% 15.7% 57.0% 22.2% 22.2% 55.6%
Programs with gain in advanced enrollments Programs with stability in advanced enrollments Programs with loss in advanced enrollments
Key for figs. 1A–1N
For most language groups, programs that have
increas-ing introductory enrollments are more than twice as
likely to have increasing advanced enrollments also.
Emphasis on oral communication and on culture
rather than on literature in introductory courses also
correlates with growth at the advanced level in most
languages, as it did at the introductory levels. The
study revealed that almost a quarter of the programs
emphasize speaking over reading and writing, while
38.3% give these functions equal weight, and only
5.4% put more emphasis on reading and writing.
Cul-ture defines courses much more frequently (68.5%)
than literature (4.9%). Equal emphasis on literature
and culture in these early language courses was the
preference of 25.3% (Goldberg and Welles,
“Suc-cessful . . . Programs” 185–86). At first glance, the
numbers in the appendix tables seem to show that
programs that place more emphasis on reading and
writing than on speaking and more emphasis on
liter-ature than on culture are also frequently associated
with growth in advanced enrollments (see app. tables,
questions 21 and 27). But because the numbers of
positive responses to those questions were extremely
low—most were below nine per language—they
can-not be considered indicative of trends in the field.
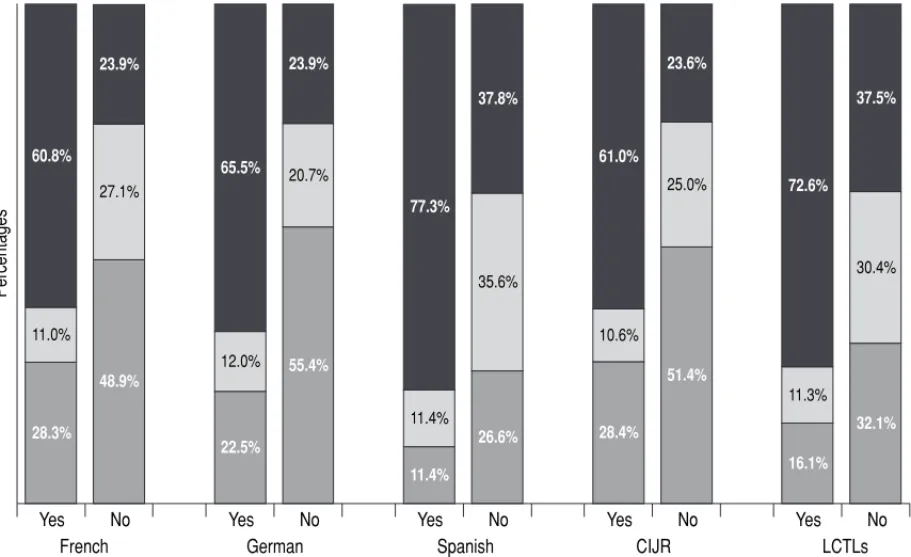
Number of Majors
Growth in number of majors is associated very
strongly with enrollment growth in advanced courses.
The percentage difference, ranging from 41.6% in
German to 35.1% for the LCTLs, is the highest
among the features showing very strong correlation
with enrollment growth. The correlation with growth
is 39.5% for Spanish, 37.4% for CIJR, and 36.9% for
French (fig. 1C). It stands to reason that since majors
make up about half the population of those who take
advanced courses, a greater number of them create
higher enrollments. However, it is also likely that
more students who are committed to a program and
who have had a good experience with its curriculum,
study abroad, and other activities will create an
atmos-phere of enthusiasm that encourages other students to
continue to advanced levels whether or not as majors.
Double Majors, Minors
Programs that experienced growth in the number of
double majors and of minors between 1995 and 1999
were also more likely than those that did not to have
experienced increasing enrollments in advanced
courses. (The same association for elementary-level
Figure 1B
The Relation between Change in Advanced Enrollments and a Program Feature or Characteristic:
Are Introductory Enrollments Increasing?
Percentages 28.9% 9.3% 61.8% 44.4% 26.6% 29.0% 23.0% 13.0% 64.0% 46.8% 22.5% 30.6% 13.7% 13.0% 73.3% 24.2% 31.8% 44.0% 27.2% 12.6% 60.2% 45.5% 23.6% 30.9% 13.6% 10.7% 75.7% 37.1% 30.8% 32.2%
enrollments was reported in part 1 of this study
[Goldberg and Welles, “Successful . . . Programs” 207–
08].) The correlation with growth for double majors
was very strong in all language groups, but strongest
in Spanish, at 15.4%. In French it was 11.3%, in
Ger-man 7.4%. For the language group CIJR it was only
2.6%, but for the LCTLs it was 12.0% (see fig. 1D).
Figure 1E shows that the results for number of
mi-nors are very similar. Spanish programs with an
in-creasing number of minors are 24.0% more likely to
have experienced growth at the advanced level. The
correlation with growth in French programs is 9.6%.
The CIJR group is lower, at 4.1%; German is at 1.7%;
LCTLs stand in the middle, at 6.5%.
Students have many opportunities to pursue a
dou-ble major or a minor, and they use them. More than
half the programs said that the number of their
dou-ble majors increased between 1995 and 1999, and
more than 60% said that the number of minors
in-creased over the same time period. Approximately a
third said that the number of double majors remained
stable, and 25% said that the number of minors was
stable. Very few (less than 5%) said that their double
majors or their minors decreased, and an insignificant
percentage said that they offered neither double
ma-jors nor minors. It appears that programs with
enroll-ment options—minors, majors, and double majors—
attracted more students because of the flexibility
offered. Those students who do not want to make the
commitment required for a foreign language major
can still receive a minor. Or they can add to their
commitment and pursue a double major degree.
Features Showing a Strong Correlation with Growth
Language Requirement
Language requirements for graduation are of great
concern to the language field: they affect
elementary-level enrollments and staffing and in a sense
demon-strate an institution’s commitment to languages in
undergraduate education. The foreign language
gradua-tion requirement is strongly associated with growth in
advanced enrollments—particularly in German, where
the correlation with growth is 9.4%. Spanish (7.4%),
Figure 1C
The Relation between Change in Advanced Enrollments and a Program Feature or Characteristic:
Is the Number of Majors Increasing?
Percentages 28.3% 11.0% 60.8% 48.9% 27.1% 23.9% 22.5% 12.0% 65.5% 55.4% 20.7% 23.9% 11.4% 77.3% 26.6% 35.6% 37.8% 28.4% 10.6% 61.0% 51.4% 25.0% 23.6% 11.3% 72.6% 32.1% 30.4% 37.5%
Programs with gain in advanced enrollments Programs with stability in advanced enrollments Programs with loss in advanced enrollments
Key for figs. 1A–1N
Figure 1D
The Relation between Change in Advanced Enrollments and a Program Feature or Characteristic:
Is the Number of Double Majors Increasing?
Yes No Yes No Yes No Yes No Yes No
Percentages 35.8% 18.3% 45.9% 42.6% 22.8% 34.6% 38.6% 16.9% 44.4% 40.7% 22.2% 37.0% 13.9% 17.9% 68.2% 23.4% 23.7% 52.8% 35.8% 17.7% 46.5% 37.4% 18.7% 43.9% 21.3% 17.3% 61.3% 28.2% 22.5% 49.3%
French German Spanish CIJR LCTLs
Figure 1E
The Relation between Change in Advanced Enrollments and a Program Feature or Characteristic:
Is the Number of Minors Increasing?
Percentages 37.2% 18.4% 44.4% 42.9% 22.2% 34.8% 39.1% 18.3% 42.6% 40.9% 18.3% 40.9% 13.9% 17.3% 68.8% 27.6% 27.6% 44.8% 33.6% 19.3% 47.1% 40.9% 16.1% 43.0% 21.0% 19.8% 59.3% 29.6% 17.6% 52.8%
LCTLs (4.7%), and CIJR (3.9%) all show a significant
positive association between the requirement and
growth (fig. 1F). Overall, 76.3% of responding four-year
institutions reported a language requirement for
gradu-ation. An entrance language requirement was reported
by 32.4% of all those institutions, but it does not show a
notable positive association with advanced enrollment
growth, except for Spanish (6.2%) and French (3.6%).
Testing for Assessment and Placement
Assessment of incoming students is strongly
associ-ated with growth in advanced enrollments.
Depart-ments were asked if they use testing for assessment and
placement; 71.0% of respondents said yes. As figure 1G
shows, German programs that tested for assessment and
placement of incoming students were 10.0% more likely
to have growing advanced enrollments than German
programs that did not. Programs in French and the CIJR
group were 6.9% and 6.6% more likely, respectively, to
have experienced growth when they tested for
assess-ment and placeassess-ment. The correlation with growth in
Spanish programs with testing of incoming students was
not significant (.2%), and in the LCTLs there was a
no-tably negative correlation (–10.6%). Since students
who are placed at an appropriate level have a better
chance of making progress and telling their friends
about a satisfying learning experience, careful
assess-ment is clearly an important tool. For the LCTLs, where
most nonheritage students begin language study in
col-lege, assessment and placement is not an issue. But it is
difficult to explain why LCTL programs in departments
without assessment and placement of incoming
stu-dents show greater growth at advanced levels than
those with it. Could it be that careful assessment and
placement actually send students away from the LCTLs,
placing them instead in the commonly taught languages
they began in high school? As we have said, we can only
hypothesize. The data show association between
fea-tures and enrollments; they do not explain cause.
Respondents were also asked whether they used
some form of oral proficiency interview (OPI, SOPI,
MOPI, etc.) or portfolios to evaluate students. While
54.0% of the programs said that they used some form
of proficiency interview and 38.6% said that they
used portfolios, neither kind of in-class assessment is
associated with growth in advanced courses.
Figure 1F
The Relation between Change in Advanced Enrollments and a Program Feature or Characteristic:
Is There a Foreign Language Graduation Requirement?
Percentages 38.3% 20.4% 41.2% 39.6% 19.4% 41.0% 37.2% 19.1% 43.6% 45.3% 20.5% 34.2% 19.7% 62.8% 19.5% 25.1% 55.4% 35.1% 18.3% 46.6% 40.2% 17.1% 42.7% 24.1% 19.2% 56.7% 24.0% 24.0% 52.0%
Programs with gain in advanced enrollments Programs with stability in advanced enrollments Programs with loss in advanced enrollments
Key for figs. 1A–1N
Support for Faculty Members
Departments responding to the survey reported on
several areas in which they provided support for foreign
language faculty activities: research and scholarship
(82.2%), training in the use of technology (77.5%),
study abroad (56.0%), and course development (45.8%).
Details of the support were not given, only its absence or
presence. Figure 1H shows that support for faculty study
abroad is strongly associated with a gain in advanced
en-rollments: the data record a correlation with growth in
Spanish (5.9%), CIJR (9.4%), and LCTLs (8.8%). No
other area in which faculty members receive
institu-tional or departmental support shows a significant
posi-tive correlation with advanced enrollment growth. This
result is consistent with the very strong association found
between enrollment growth and student study abroad.
Special Opportunities outside the Usual
Classroom Schedule
As with elementary-level enrollments, a number of
special opportunities for campus- or community-based
language study or practice outside normal
semester-length classroom programs are associated with growth in
enrollments in advanced courses.We asked departments
whether they offered campus-based intensive courses,
immersion courses, presemester programs, winter-break
programs, weekend programs, language houses, or
state-side internships or service in a target-language
commu-nity. Most of these opportunities are offered in less than
a third of all departments, as table 8 shows.
Of all the special opportunities reported, presemester
programs show a very strong association with growth in
advanced enrollments (fig. 1I). The CIJR and LCTL
groups were respectively 18.6% and 18.9% more likely to
have experienced growth when they offered presemester
Figure 1G
The Relation between Change in Advanced Enrollments and a Program Feature or Characteristic:
Are Incoming Students Tested for Assessment and Placement?
Percentages 37.7% 19.0% 43.3% 40.5% 23.1% 36.4% 38.4% 17.5% 44.1% 41.1% 24.8% 34.1% 16.9% 22.0% 61.1% 21.0% 18.1% 60.9% 35.1% 17.6% 47.3% 39.8% 19.5% 40.7% 27.1% 19.6% 53.3% 15.3% 20.8% 63.9%
Table 8
Campus- and Community-Based Programs
Type of Program Percentage of Programs Intensive courses 53.1 Service in local target community 36.5 Internship in local target community 36.2 Immersion courses 26.7 Language houses 22.6 Winter-break programs 15.2 Weekend programs 10.7 Presemester programs 7.2
programs. The correlation with growth was 16.8% for
Spanish, 2.8% for French, and –3.2% for German.
Language houses, internships, and service in the
community were all strongly correlated with growth in
advanced enrollments (figs. 1J–L): three of the five
languages and language groups have a 4% or greater
correlation with growth and the given feature.
Nota-bly, these opportunities for out-of-class experiences
with language are not associated with the language
and language group enrollments uniformly. Only
Spanish enrollments are strongly associated with
growth when coupled with each of the three
opportu-nities (10.3% for language houses, 5.5% for
intern-ships, 5.9% for service). French enrollments have a
positive association with all three opportunities, but
only for internships is the correlation with growth over
4% (9.8%). German enrollment growth is negatively
associated with service and internships but positively
associated with language houses (4.6%). The German
figures suggest that the enrollment crisis in German at
the time of our survey was too severe to be affected by
certain opportunities (although language houses were
certainly correlated with growth). The Spanish figures
suggest that with booming enrollments the field was in
position to take advantage of every opportunity. And
it is tempting to conclude that in French the
intern-ships simply worked much better than service
pro-grams or language houses in shoring up enrollments.
But all these interpretations are speculative.
In the CIJR group, programs offering service
oppor-tunities were 7.7% more likely to have experienced
growth; for CIJR programs offering language houses,
the correlation with growth was 6.5%. In the LCTL
group, programs offering service opportunities were
6.9% more likely to have experienced growth; for
LCTL programs offering internships the correlation
with growth was 12.7%. Internships had a negligible
association with growth in enrollments in CIJR, and
language houses (a rarity in these languages) had a
negative association with growth in LCTLs. These
data suggest that special opportunities for study outside
the traditional class- and department-based frame
af-fect languages differently. But in general (with the
ex-ceptions noted) we find a strong correlation between
advanced enrollment growth and language houses,
in-ternships, and service programs in the community.
Figure 1H
The Relation between Change in Advanced Enrollments and a Program Feature or Characteristic:
Does the Department or Institution Provide Support for Faculty Study Abroad?
Percentages 37.8% 21.2% 41.0% 39.7% 18.8% 41.5% 40.1% 20.2% 39.7% 37.7% 18.4% 43.9% 20.0% 63.6% 20.2% 22.2% 57.7% 33.3% 17.0% 49.7% 40.3% 19.4% 40.3% 21.5% 19.4% 59.2% 28.9% 20.7% 50.4%
Programs with gain in advanced enrollments Programs with stability in advanced enrollments Programs with loss in advanced enrollments
Key for figs. 1A–1N
Figure 1I
The Relation between Change in Advanced Enrollments and a Program Feature or Characteristic:
Do Students Have Opportunities to Take Presemester Programs?
Yes No Yes No Yes No Yes No Yes No
Percentages 27.9% 25.6% 46.5% 37.2% 19.1% 43.7% 33.3% 25.9% 40.7% 39.0% 17.1% 43.9% 4.2% 18.8% 77.1% 18.7% 21.0% 60.3% 25.9% 11.1% 63.0% 38.1% 17.5% 44.4% 27.3% 72.7% 27.1% 19.1% 53.8%
French German Spanish CIJR LCTLs
Figure 1J
The Relation between Change in Advanced Enrollments and a Program Feature or Characteristic:
Do Students Have the Opportunity to Live in Language Houses?
Percentages 37.0% 16.7% 46.3% 36.2% 20.6% 43.1% 36.3% 16.7% 47.1% 39.6% 17.9% 42.5% 8.8% 21.2% 69.9% 19.6% 20.9% 59.6% 32.6% 16.3% 51.1% 39.1% 16.3% 44.6% 21.2% 27.3% 51.5% 27.6% 16.8% 55.7%
Figure 1K
The Relation between Change in Advanced Enrollments and a Program Feature or Characteristic:
Do Students Have Opportunities for Internships in the Community?
Percentages 31.9% 18.4% 49.8% 39.3% 20.7% 40.0% 38.1% 21.1% 40.8% 39.9% 15.5% 44.5% 18.3% 65.1% 18.3% 22.0% 59.6% 29.5% 23.3% 47.3% 40.1% 14.0% 46.0% 18.8% 64.1% 29.2% 19.5% 51.4%
Other special opportunities show occasional
associa-tion with advanced enrollment growth. Offering
inten-sive study is more than 4% likely to be associated with
growth in German (11.2%) and CIJR (6.7%) programs
but not in French, Spanish, or the LCTLs (see app. table
F, question 13). Programs offering state-side immersion
opportunities are 5.4% and 10.4% more likely to be
asso-ciated with growth in Spanish and CIJR programs,
re-spectively, but not in French, German, or the LCTLs
(question 14). Weekend programs are associated with
growth in Spanish (5.2%) and in CIJR (11.4%); they are
also positively associated with growth in French and
Ger-man but not at levels above 4% (question 17). Striking
in these findings is that all three of these special
opportu-nities have a considerably greater than 4% positive
cor-relation with growth in advanced enrollments (between
6.7% and 11.4%) in the CIJR programs. Also notable are
immersion and weekend programs in Spanish, both
re-porting an over 5% positive correlation with growth.
Not only domestic opportunities for language use in
authentic situations outside class but also exchange
programs have a strong association with advanced
en-rollment growth. Exchange programs in French,
Ger-man, and Spanish show a notable correlation with
growth (resp., 8.6%, 7.4%, and 6.9%). Curiously,
ex-change programs are not correlated with advanced
growth in the CIJR or the LCTL groups (question
40). Programs allowing students to study languages
across institutional units through
language-across-the-curriculum programs or programs with
profes-sional schools show a notable positive correlation
with growth in advanced course enrollments only in
Spanish (questions 36 and 37). The association
be-tween growth and language-across-the-curriculum
and programs with professional schools is stronger at
the introductory (Goldberg and Welles, “Successful
. . . Programs” 193–94) than at the advanced level.
Features Showing an Occasional Correlation
with Growth
Programs for Secondary School Teachers
Programs that offer preparation for secondary school
teachers do not have a strong correlation with
increas-ing advanced enrollments. Of the respondents, 60.4%
reported that they included teacher preparation in their
Programs with gain in advanced enrollments Programs with stability in advanced enrollments Programs with loss in advanced enrollments
Key for figs. 1A–1N
options. The positive correlation extends across all
lan-guages but is fairly low, with French at 6.6%, German at
3.7%, Spanish at 3.5%, and CIJR at 2.6%. The LCTLs
have a negligible association with growth at 0.4%,
which reflects how little these languages are taught
below the postsecondary level (question 45). More
striking are the responses to a subset of questions about
where the responsibility for teacher education lies: for
11.0% of the respondents it was in the department
alone, for 39.5% it was in the school of education, and
for 48.7% that responsibility was shared equally by the
department and the school of education. Programs that
featured such sharing had very strong correlation with
enrollment growth, ranging from 10.2% to 15.6%, in
German and the CIJR and the LCTL groups (fig. 1M).
Spanish had a notable 4.0% correlation, but the French
correlation with growth was slightly negative.
Evi-dently teacher-preparation programs are most
success-ful when they follow a collaborative model and take
advantage of two kinds of expertise: that of the
disci-plinary department (language, literature, and culture)
and that of the school of education (teaching methods).
A Language Program Coordinator
Programs reporting a full-time coordinator or
super-visor of an elementary or intermediate language
pro-gram, 37.4% of respondents, show an occasional
cor-relation with advanced enrollment growth. As shown
in figure 1N, the correlation is striking in German
and French programs (resp. 8.9% and 12.8%). There
is a modest correlation with growth in Spanish
pro-grams, and a negative one in the CIJR and LCTL
groups. These findings suggest that hard-working
French and German programs are supported by
super-vised and coordinated instruction, whereas Spanish
programs are buoyed by other practices and
phenom-ena, so that even though a coordinator may be
impor-tant to them, a person in that role does not determine
enrollment growth at the advanced level.
Uses of Technology
The most frequent instructional use of technology
is for student practice outside the classroom (85.0%);
the second is for teaching in the classroom (74.4%);
the third is for testing and placement (34.3%). The
least frequently reported use of technology is distance
learning (27.0%).
Both technology used for practice outside the
class-room and technology used for testing and placement
show an occasional correlation with advanced
en-rollment growth. For programs using technology for
practice outside the classroom, the correlation with
Figure 1L
The Relation between Change in Advanced Enrollments and a Program Feature or Characteristic:
Do Students Have Opportunities for Service in the Community?
Percentages 39.1% 15.2% 45.7% 34.6% 22.8% 42.6% 39.8% 22.7% 37.5% 39.2% 14.8% 46.0% 17.5% 17.9% 64.6% 18.0% 23.3% 58.7% 27.6% 21.1% 51.2% 41.3% 15.1% 43.5% 23.5% 17.3% 59.3% 27.1% 20.5% 52.4%
growth in French and Spanish is significant (resp.,
6.2% and 6.9%); for programs using technology for
testing and placement, it is significant in German
(6.5%) and CIJR (4.9%) (app. table F, questions 59
and 60). The second finding is consistent with
re-sults in our study of growth in elementary and
interme-diate language courses, where we reported that the use
of technology most consistently associated with
enroll-ment growth at those levels is testing and placeenroll-ment.
Technology used for practice outside the classroom,
however, is not associated with growth at the
intro-ductory levels (Goldberg and Welles, “Successful . . .
Programs” 195). Testing and placement apparently
play a significant role in enrollments in a number of
languages. Both distance learning and technology used
for in-class instruction are significantly associated with
enrollment growth in advanced courses only in the
CIJR group (question 61).
Heritage Learners
Heritage learners are an important part of the
en-rollment pool for programs in (among others) Arabic,
Chinese, French, Korean, Russian, Spanish, and
Viet-namese. Specifically designed programs for such
learn-ers are not the norm: special classes for heritage learnlearn-ers
are offered in 23.3% of responding programs, and
prep-aration for faculty members who teach heritage
learn-ers is available in 9.7% of them. But such preparation is
only occasionally associated with advanced enrollment
growth: the correlation is 6.3% for French, 8.6% for
Spanish, 3.1% for the LCTLs (question 50). Special
classes for heritage learners show a modest but
consis-tently positive association with growth at advanced
levels, except for the LCTLs (question 49).
Language Centers
A language center on campus was reported in
17.7% of BA-granting, 23.6% of MA-granting, and
39.1% of PhD-granting departments. The presence of
a campus center that is separate from language
depart-ments and to some degree responsible for language
teaching is occasionally associated with growth in
ad-vanced enrollments: 4.0% for CIJR, 4.7% for LCTLs,
but only 2.3% for French. In Spanish, correlation
with growth is flat at 0.0% (question 63).
Figure 1M
The Relation between Change in Advanced Enrollments and a Program Feature or Characteristic:
Do the Foreign Language Department and School of Education Share Responsibility for the Secondary School
Teaching Program?
Percentages 34.7% 22.2% 43.1% 37.7% 19.1% 43.2% 31.4% 20.1% 48.4% 42.7% 19.5% 37.8% 20.5% 63.9% 19.5% 20.6% 59.9% 27.6% 19.8% 52.6% 41.7% 15.9% 42.4% 20.3% 16.9% 62.7% 33.3% 19.6% 47.1%Programs with gain in advanced enrollments Programs with stability in advanced enrollments Programs with loss in advanced enrollments
Key for figs. 1A–1N
When programs were asked about the function of the
center in relation to language departments on campus,
their responses showed only occasional correlation
with growth, as follows: 37.9% for German and 15.0%
for Spanish when the center provided all language
teaching, 6.6% for LCTLs when the center provided
some language teaching, 15.1% for German and 12.0%
for Spanish when the center supported all language
teaching, 10.0% for German and 5.4% for CIJR when
the center supported teaching only on request, and
14.4% for French and 15.9% for CIJR when the center
was best described as a media center (questions 64–
68). The repeated presence of German and to a lesser
degree Spanish and the CIJR group is notable. German
enrollments were particularly weak during the period of
the survey, and these data on language centers suggest
that external support to a weak program is frequently
associated with strength in advanced enrollments.
Advanced Curricular Approaches
Because teaching language, literature, and culture is
central to the profession and because much innovation
has occurred in approaches to teaching and the
curricu-lum, we asked questions that would give a broad picture
of the status of literature and culture and pedagogical
strategies throughout the undergraduate sequence.
At the advanced level, more than half the programs
in responding departments reported that literature is
the foundation of the curriculum. A third reported that
their curriculum emphasizes literary and nonliterary
texts equally. In slightly over half, the approach to
lit-erature combines an emphasis on the canon with
per-spectives that take account of race, class, or gender. In
slightly less than half, the curriculum is based simply on
the canon. A quarter described the curricular core of
their programs as a survey of civilization. Less than 10%
said their programs were based largely on nonliterary or
noncanonical texts. More than a quarter of all
respon-dents reported that they had a nontraditional strand
of-fering language for business or other purposes (table 9).
This distribution suggests the richness of
curric-ular approaches available for students interested in
pursuing studies in foreign languages, literatures, and
cultures in our colleges and universities. Since
respon-dents were asked to check as many places on the
questionnaire as were appropriate to describe their
programs, many were able to characterize their
ap-proach, for instance, as balanced both vis-à-vis
liter-ary and nonliterliter-ary texts and vis-à-vis canonical and
noncanonical literature. The balance between
tradi-tional and innovative is notable, as is the evidence
that the study of literature constitutes a significant
Figure 1N
The Relation between Change in Advanced Enrollments and a Program Feature or Characteristic:
Is There a Full-Time Introductory Language Coordinator?
Percentages 32.2% 17.8% 50.0% 41.4% 21.4% 37.2% 34.4% 17.9% 47.7% 41.1% 20.1% 38.8% 14.4% 23.9% 61.7% 19.8% 19.6% 60.6% 34.0% 20.5% 45.5% 38.8% 15.1% 46.1% 25.8% 22.1% 52.1% 23.0% 17.6% 59.5%
part of the core in more than 90% of all curricula
re-ported. The number of programs offering some form
of language for special purposes, in the context of a
continuing emphasis on literature, is also striking.
We expected to find a clear indication of the kinds
of courses that correlated with enrollment growth,
but no one curricular emphasis showed a strong
asso-ciation across the board. The most consistent
correla-tion with growth occurred when the canon was
expanded to include perspectives of race, class, and
gender, but the correlation was modest in all the
lan-guages (question 32). Three other approaches showed
association in three language groups: the canon
orga-nized by period, an emphasis on literary over
non-literary texts, and an equal emphasis on non-literary and
nonliterary texts. There was less association with
growth in curricula emphasizing language for business
or other special purposes. Programs that base their
curriculum on a survey of civilization or largely on
nonliterary or noncanonical texts clearly do not have
an association with growth. The data suggest that
stu-dents are attracted to different programs: programs
that offer grounding in the literary classics, that
com-bine the classics with contemporary approaches
(de-fined as dealing with race, class, and gender), and that
introduce noncanonical and nonliterary texts.
A few features appear in the appendix tables whose
correlation with growth suggests that at least for
ad-vanced courses they do not make much difference in
attracting enrollments. One was the discussion of
edu-cational objectives, about which 65.0% of programs
03), it was not significantly associated with
enroll-ment growth at advanced levels; three languages are
in positive territory, but only one is above 4%
(ques-tion 3). About half the departments reported offering
programs to the local community, and all the types
in-cluded in the responses, whether language courses,
films, lectures, or other interactions, were associated
with growth at the introductory level. But for
ad-vanced courses the degree of correlation with few
ex-ceptions was slightly above or below zero (questions
51–54). Changing from a single to a multilanguage
de-partment, changing from a multi- to a single language
department, or merging with another department (a
concern for many departmental administrators) has
negative correlations (questions 55–57).
The Correlation of Program Practices and Growth
in Number of Majors
This report has concentrated on growth in advanced
enrollments, but growth in the number of majors is a
related issue. Are the same features associated with one
associated with the other? Table 10 shows that in most
cases they are. For 34 of the 58 features, the correlation
with growth is even greater for majors than for
ad-vanced enrollments; for 11, it is equal; for 13, the
corre-lation for majors is less than for advanced enrollments.
We have seen that for study abroad the correlation
with growth with advanced enrollments is very strong,
with three of the five languages or language groups
greater than 8%. The correlation with number of
ma-jors is also very strong, with four of the five languages
or language groups greater than 8%. Furthermore,
CIJR and the LCTLs have notably higher percentages
(15.6% and 13.8%) in the majors category than in the
advanced category (6.7% and 1.5%) (see app. table F).
Increasing introductory-level enrollments correlate
very strongly with growth in both advanced-level
en-rollments and number of majors (5 of 5 greater than
8%). An increase in double majors is also associated
equally with growth in advanced enrollments and
number of majors (3 of 5), but an increase in minors
correlates more strongly with number of majors than
with advanced enrollments (particularly in CIJR).
Other features correlate with growth in number of
majors: support for faculty study abroad, the presence
Table 9
Emphasis in the Advanced
Undergraduate Curriculum
Type of Emphasis Percentage of Programs On literary texts 54.4 On literary and nonliterary texts equally 35.0 On nonliterary texts 8.9 On canon, by period 45.0 On canon, with some
noncanonical literature 51.6 On noncanonical literature 7.7 On surveys of civilization 25.8 On language for special purposes 28.9
opportunities. Particularly notable are student
oppor-tunities with professional schools: the correlation with
growth for advanced enrollments is insignificant, with
only one of the five languages or language groups
show-ing a greater than 4% difference, but for number of
ma-jors the correlation rises sharply to very strong, with
three of the five languages or language groups over 8%.
Only graduation requirements, assessment of
incom-ing students, articulation in curriculum development,
and special preparation for heritage learners show a
decrease in the number of majors. On occasion, the
difference is logical. For example, special programs
with professional schools require the prolonged
com-mitment typical of a major or double major, whereas
heritage students, although drawn to advanced courses
that expand their knowledge of their home culture,
generally major in areas other than a language in
which they already have some competence. But
some-times the logic is elusive. For example, when foreign
language departments and schools of education have
equal responsibility for secondary school teaching, the
correlation with growth for advanced enrollments is
very strong, with three of the five languages or
lan-guage groups greater than 8%, but for number of
ma-jors the correlation is insignificant, with only one of
the five greater than 4%. When foreign language
de-partments alone have the responsibility for secondary
school teaching, the results are reversed: the
correla-tion with growth for advanced courses is insignificant
(1 of the 5 languages or language groups shows a
greater than 4% difference); for majors, the
correla-tion is very strong (3 of the 5 languages or language
groups show a greater than 8% difference).
We have seen that the programs that show the most
growth in enrollments and majors offer students a
range of opportunities to use the language and to
expe-rience authentic linguistic and cultural environments
abroad and in the local community. Students are also
attracted to programs that recognize their
achieve-ments and give them a credential, such as a major, a
minor, double major, or a certificate in teacher
educa-tion. The association with growth for curricular
ap-proaches does not suggest any clear direction; both
traditional and more expanded approaches seem to
work; courses based completely on nonliterary or
non-canonical texts or on a survey of civilization do not
often correlate with growth. While Spanish holds sway
over enrollments and thus commands a larger share of
many of the activities that have been found to support
a firm grounding in the basics and opportunity for
ad-vancing to higher linguistic and cultural levels.
What about the future of language teaching and
learning? The data we have studied lead us to the
fol-lowing speculations. As technology becomes ever more
accessible and faculty members develop greater
exper-tise in applying it, the use of media, Internet, and
com-puter software will become both more frequent and
more effective in the classroom. Since language centers
appear to be a positive factor in enrollment growth (as
well as an organizational and possibly fiscal expedient),
their number can be expected to increase, as will their
role in training faculty members and teaching students.
More programs will be tailored to meet the needs of
the growing population of heritage learners. Teaching
methods for introductory levels will be improved and
refined, and the subject matter for advanced courses
will be expanded to include new and interdisciplinary
approaches. We are confident that the inventiveness of
members of the field will continue to reverberate with
innovative approaches and programs to strengthen
stu-dent achievement in languages, literatures, and
cul-tures. In sum, these data reveal a vibrant, diversified
field in which many methodological and curricular
ap-proaches serve both new and traditional needs of a
di-verse student population and also provide evidence of
a strong foundation for further development.
Note
1This percentage and others in the text of the article that
are calculated on the basis of the numbers given in the bar graphs may vary from the numbers reporting the same phenom-ena in the percentage difference column of appendix tables A through F by a tenth of a percent. This variance occurs because the figures from the appendix tables are rounded on the basis of a greater number of decimal points.
Works Cited
Brod, Richard, and Elizabeth B. Welles. “Foreign Language En-rollments in United States Institutions of Higher Education, Fall 1998.” ADFL Bulletin31.2 (2000): 22–29.
Goldberg, David, and Elizabeth B. Welles. “From the Editors.”
ADFL Bulletin33.2 (2002): 1–3.
———. “Successful College and University Foreign Language Programs, 1995–99: Part 1.” Profession 2001. New York: MLA, 2001. 171–210.
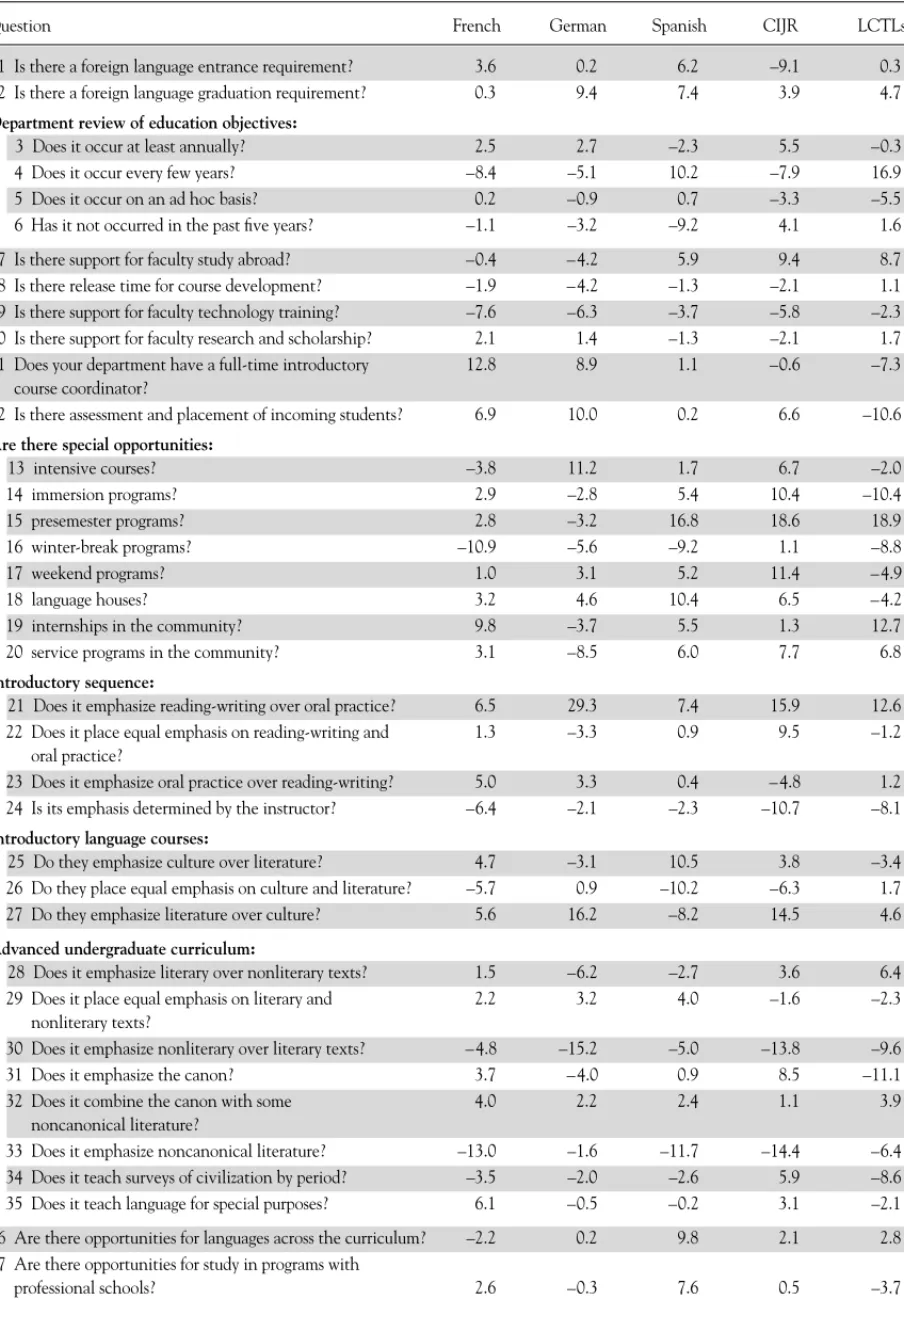
Table 10
Comparing Correlations with Growth: Program Features and Advanced Enrollments, Program Features and
Number of Majors
A Yes to the Question of . . . Advanced Enrollments Number of Majors Is there a foreign language graduation requirement? ■■ ■■ ■■ ■■ ■■
Is there support for faculty study abroad? ■■ ■■ ■■ ■■ ■■ ■■ ■■ Is there release time for course development? – ■■ Is there support for faculty technology training? – ■■ ■■ Is there support for faculty research and scholarship? – ■■ ■■ Does your department have a full-time introductory course coordinator? ■■ ■■ ■■ ■■ ■■ Is there assessment and placement of incoming students? ■■ ■■ ■■ ■■
Are there special opportunities:
intensive courses? ■■ ■■ ■■ ■■ ■■ ■■ immersion programs? ■■ ■■ ■■ ■■ ■■ presemester programs?
■ ■ ■
■ ■ ■
winter-break programs? – ■■ weekend programs? ■■ ■■■ ■ ■ ■ ■
language houses? ■■ ■■ ■■ ■■ ■■ ■■ ■■ internships in the community? ■■ ■■ ■■ ■■ ■■ service programs in the community? ■■ ■■ ■■ ■■ ■■Introductory sequence:
Does it emphasize reading-writing over oral practice?
■ ■ ■
■■ Does it place equal emphasis on reading-writing and oral practice? ■■ ■■ ■■ Does it emphasize oral practice over reading-writing? ■■ ■■ ■■ ■■ ■■ Is its emphasis determined by the instructor? – –Introductory language courses:
Do they emphasize culture over literature? ■■ ■■ ■■ ■■ ■■ Do they place equal emphasis on culture and literature? – ■■ ■■ Do they emphasize literature over culture? ■■ ■■ ■■ ■■ ■■
Advanced undergraduate curriculum:
Does it emphasize literary over nonliterary texts? ■■
Does it place equal emphasis on literary and nonliterary texts? ■■ ■■ ■■ Does it emphasize nonliterary over literary texts? – –
Does it emphasize the canon? ■■ –
Does it combine the canon with some noncanonical literature? ■■ ■■ ■■ ■■ Does it emphasize noncanonical literature? – ■■ Does it teach surveys of civilization by period? ■■ ■■ Does it teach language for special purposes? ■■ ■■ ■■
Table 10 (Comparing Correlations with Growth,
cont.
)
A Yes to the Question of . . . Advanced Enrollments Number of Majors Are there opportunities for languages across the curriculum? ■■ ■■ ■■
Are there opportunities for study in programs with professional schools? ■■
■ ■ ■
Student opportunities abroad:
Are there internships? ■■ ■■ ■■ ■■
Are there service programs? ■■ ■■ ■■ ■■ ■■ Are there exchange programs? ■■ ■■ ■■
■ ■ ■
Is there assessment of students:
OPI, SOPI, MOPI? – –
portfolios? ■■ ■■ ■■
Articulation with high schools:
Is there placing of students? ■■ ■■ ■■ ■■ Is there curriculum development? ■■ – Is there a program for secondary school language teachers? ■■ –
Program for secondary school teaching:
Does the FL department have responsibility? ■■
■ ■ ■
Do the FL department and school of education have equal responsibility?■ ■ ■
■■ Does the school of education have responsibility? – –Heritage students:
Are there specially designed classes for heritage learners? ■■ – Is there special preparation for faculty members to teach heritage learners? ■■ ■■ ■■
Does the department sponsor:
lectures for the local community? – ■■ films for the local community? – ■■ ■■ ■■ ■■ language courses for the local community? ■■ ■■ ■■ Is there other interaction between the department and the local community? ■■ ■■ ■■
Does the department use technology resources:
in the classroom? – ■■ ■■ ■■
for student practice outside class? ■■ ■■
■ ■ ■
for testing and placement? ■■ ■■ ■■ ■■for distance learning? ■■ ■■
Is there a separate language center on campus? ■■ ■■
■ ■ ■
Enrollments:
Is the number of double majors increasing?