1970. The MSCI EM (Emerging Markets) Index and the MSCI ACWI (All Country World Index), also in standard versions, were introduced in 1988. The MSCI EAFE Small Cap and MSCI ACWI Small Cap indexes were not introduced until 1998, 10 years later. Investors tend to invest the way they benchmark, so alloca-tions to international small-cap stocks and the observed underallocation in that area may be attributable to the later introduction of the small-cap indexes.
Both MSCI and Russell advocate a global equity allocation and bench-marking framework incorporat-ing international stocks across the capitalization spectrum and continued inclusion of emerging markets stocks (Nielsen 2007; Lystra 2011). While U.S. investors appear to remain under-weighted in international small-cap stocks, we have noticed an increasing number of articles on the topic and it is becoming a more frequent subject for discussion at investment conferences.
In this paper, we attempt to demon-strate that significant benefits on a risk-adjusted-return basis can be derived from an allocation to this asset class. In making our case we use the Russell 1000 and the Russell 2000 indexes as proxies for the domestic large- and small-cap markets because they are still popular domestic benchmarks for U.S. investors. We use the MSCI World ex-US and the MSCI World ex-US Small Cap indexes, with net dividends, as proxies for the foreign-market invest-ment opportunities. The measure-ment period covers 11 years (January 2001–December 2011), the maximum available data for the MSCI World Small Cap Index with net dividends. While this observation period is shorter In discussions with institutional
investment consulting firms, registered investment advisor and broker-dealer research teams, and investment commit-tees, we have observed that a significant percentage of these investors have not yet allocated to international small-cap stocks. An often-stated concern is high volatility. It seems many U.S. investors are also unaware of the sheer size of the international small-cap segment relative to the global marketplace.
To quantify the extent of the relative underinvestment in international small-cap stocks vs. domestic small-small-cap stocks, we examined the total assets under management (AUM) in small-cap growth, value, and core managers as reported to eVestment Alliance, a major investment manager database provider (https://www. evestment.com). As of June 30, 2011, domestic small-cap managers reported total AUM of approximately $543 billion while their international small-cap coun-terparts reported roughly $86 billion. This gap indicates that international small-cap is significantly underrepresented in U.S. investment portfolios relative to domestic small-cap allocations.
Given investor and investment-consultant focus on portfolio theory, the benefits of diversification, and the decreasing costs of trading in global financial markets, we find this underal-location to international small-cap stocks somewhat surprising. One possible explanation for it may be the way in which equity benchmarks were intro-duced historically. The first international equity benchmark widely accepted by investors and consultants was the MSCI EAFE (Europe, Australasia, Far East) Index, and it was introduced in its standard (Large and Mid-Cap) version in
Allocating to Non-U.S. Small-Cap Stocks
T
he past dozen years have encompassed two of history’s great global equity bear markets. Global stocks lost nearly half their value or more during the 2000–2002 tech bubble meltdown and again in the 2008 global financial crisis. Global equity return volatility, as measured by the CBOE SPX Volatility Index, has been at record highs many times during this time. As a result, investors and their advisors have been searching desperately for return while trying to limit volatility. We believe, however, that many U.S. investors are passing up an obvious diversification opportunity that has potential to improve risk-adjusted returns for the equity portion of investment portfolios.In “Globalization of Equity Policy Portfolios,” Subramanian et al. (2010) make the case for a more market-like allocation, based on the capital asset pric-ing model (CAPM), and find that most U.S. investors still have a meaningful home-market bias in their portfolios. Subramanian et al. (2010) note the inexorable trend toward globalization: diminishing trade barriers, increasing international trade, increasing coordina-tion of nacoordina-tional accounting rules, and the opening of world capital markets have led toward globalization of world equity markets. They observe that the tradi-tional factors favoring a home-country bias—restrictions on cross-border capital flows and property ownership, tax differ-ences, even currency effects— all have diminished in importance over time. Their data indicate that moving from a U.S.-only equity portfolio toward a global allocation increases risk-adjusted returns, as theory would suggest.
International Small-Cap Stocks
An Underutilized Asset Class
Has this proven to be the case? Starting with a basic reward-versus-volatility analysis, even including the effects of most of the tech bubble
Correlation
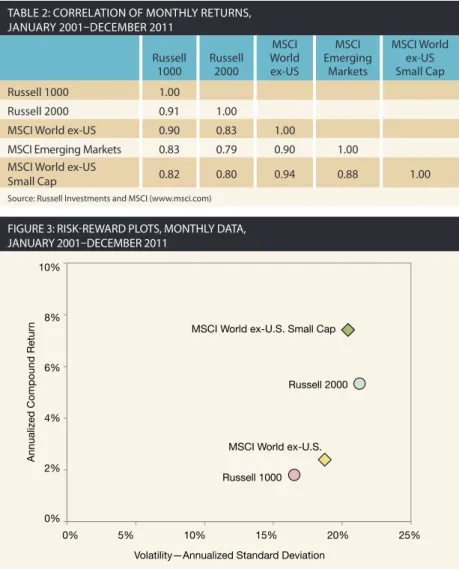
The correlation argument for allocat-ing to international small-cap stocks is worth examining. Correlations among most equity subcategories spiked signifi-cantly during the past two bear markets, leading many to question the value of diversification in protecting portfolios. Large- and small-cap stocks are subasset categories, however, rather than truly different asset classes, such as bonds or real estate, so somewhat higher cor-relations are to be expected. That said, however, correlation of international small-cap stocks (table 2) is comparable to that of other equity subcategories. It is also low enough to indicate that inclu-sion in a global equity portfolio provides some diversification benefit. Correlation effects become more compelling when combined with the risk-adjusted perfor-mance benefits discussed below.
Return versus Risk
Portfolio theory holds that investors should build portfolios using the largest possible investment opportunity set to realize the greatest diversification benefit and maximize the efficient fron-tier. The sheer size of the international small-cap market and the cross-correla-tion benefits alone should be enough to warrant inclusion of international small caps in portfolios. Still, many investors and investment consultants believe that international small-cap equities are more risky than domestic small caps. than we would prefer, it does
encom-pass most of the tech bubble meltdown and the entire global financial crisis. We chose not to augment with earlier price-only small-cap index data because we believe the inclusion of net dividends gives a more realistic approximation of investable results.
How Big is Small?
Does the size of the international small-cap marketplace warrant its consideration as a separate allocation category? Table 1 shows that non-U.S. small caps provide many more invest-ment opportunities than domestic small caps in terms of number of stocks: 2,609 companies versus 1,956. In terms of market capitalization, U.S. small caps are larger at $2 trillion versus $1.5 trillion for non-U.S. small caps. While the U.S. small-cap segment is larger, the international small-cap opportunity set is clearly large enough to support a stand-alone allocation. Figure 1 gives a visual representation of the market-cap data from table 1.
Ignoring international small caps as a category eliminates a tremendous number of companies from around the world from the available investment opportunity set, and close to the same amount of investable market capitaliza-tion that U.S. small caps provide.
Furthermore, the non-U.S. small-cap segment should continue to grow as a percentage of global market capitaliza-tion. As shown in figure 2, in 1970, U.S. stocks represented approximately 70 percent of the market capitalization of the MSCI World Index; by the end of 2010, that had shrunk to 47 percent. There are two reasons for this. First, as the world’s emerging economies grow and ultimately join the ranks of the developed economies, the share of non-U.S. global gross domestic product should continue to increase. Second, as these economies and their financial markets mature, the share of equities available to foreign public investors tends to grow.
TABLE 1: MSCI WORLD INDEX CONSTITUENTS BY MARKET CAP
By Number of Securities
MSCI USA MSCI World Ex-US MSCI World
Large/Mid Cap 588 1,027 1,615
Small Cap 1,956 2,609 4,565
Total 2,544 3,636 6,180
By Market Cap ($ Billions)
MSCI USA MSCI World Ex-US MSCI World
Large/Mid Cap $ 11,855 $ 10,656 $ 22,511
Small Cap $2,005 1,481 3,486
Total $ 13,860 $ 12,138 $ 25,997
Source: MSCI (www.msci.com), December 2011
FIGURE 1: MSCI WORLD INDEX CONSTITUENTS BY PERCENTAGE OF TOTAL MARKET CAP
FIGURE 2: SHARE OF GLOBAL EQUITY MARKET CAPITALIZATION
5.7% 7.7% 45.6% 41.0% MSCI World ex-U.S. MSCI World ex-U.S. Small Cap MSCI U.S. Large Cap MSCI U.S. Small Cap 30% 53% 70% 1970 2010 47% Non-U.S. U.S. Source: MSCI (www.msci.com), December 2011
small caps, both domestic and foreign, began to pull ahead of large caps, and this trend persisted over both rolling five-year and rolling seven-year periods. Small caps have been more volatile in the short run than large caps, but the small-cap return premium has more than compensated investors for the additional short-term volatility as evidenced by Sharpe ratios and downside protection. Based on this data, it appears investors may be ill-advised to avoid small-cap stocks solely on the basis of higher short-term volatility.
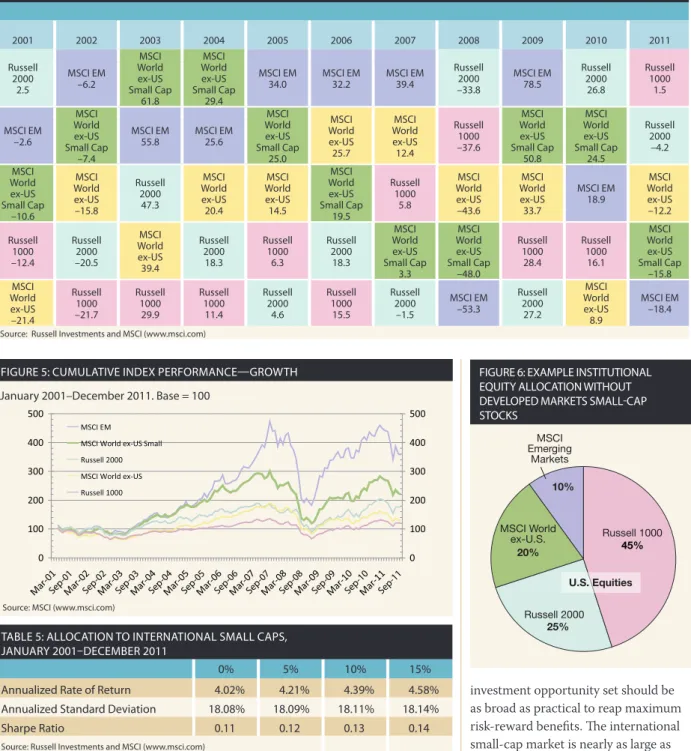
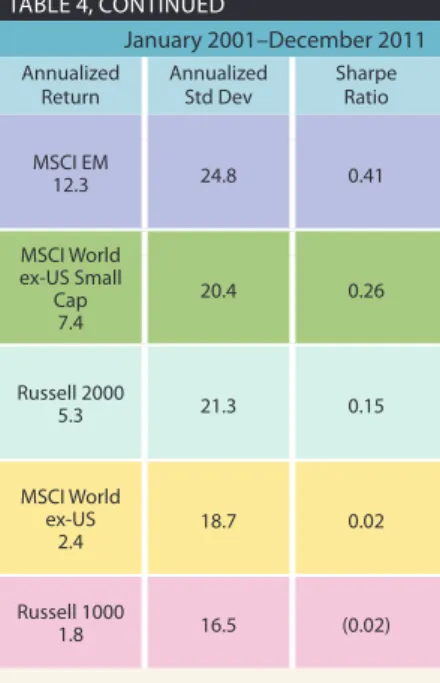
An annual returns summary table shows why we believe investors should include international small caps in their portfolios. Table 4 presents data with longer holding periods for small
caps than for large caps.
We calculated one-, three-, five-, and seven-year rolling returns using monthly data. We did not calculate 10-year rolling returns because there were no negative 10-year rolling returns in any of the four categories. During our test period there were a total of 121 12-month rolling periods, 97 36-month rolling periods, 73 60-month rolling periods, and 49 84-month rolling periods. Results are summarized in figure 4. All four equity categories exhibited similar probabili-ties of incurring a loss in the short term with roughly a one-in-three chance of losing money over any 12-month holding period. Over three-year rolling periods, meltdown and the 2008 global financial
crisis, the MSCI World ex-US small-cap index was slightly less volatile than domestic small caps; it basically was in line with them. International small caps significantly outperformed both U.S. small-cap and global large-cap stocks. Risk-reward plots are shown in figure 3.
Table 3 presents annualized returns, standard deviations, and Sharpe ratios for the four indexes over various trail-ing time periods. As one might expect, international small-cap stocks vary over time in both return and risk level, as do the other three indexes. The interna-tional small-cap category was the best performer over the entire time period. Also as one might expect, international small caps exhibited more volatility than large-cap stocks, but they were very much in line with the volatility of U.S. small caps. On a risk-adjusted basis, as measured by Sharpe ratio, international small-cap stocks performed well, espe-cially over the full 11-year period.
Many investors argue in favor of overweighting less-volatile equity opportunities, specifically large-cap stocks, to deliver better downside pro-tection. With increased volatility in the equity markets over the past decade, this tendency seems to have become more pronounced. Modern portfolio theory posits there is more to risk than just volatility, however. There is also the risk of not achieving stated investment goals and the risk of long-term loss. Standard deviation of returns alone does not cap-ture these other aspects of risk.
The risk-reward relationship between the various equity segments is changing constantly over time, but over this time period small-cap stocks, both domestic and foreign, actually did better at avoiding longer-term losses than global large caps. Using monthly return data, we analyzed rolling holding periods of varying lengths and found that for longer holding periods the probability of experiencing a loss gener-ally decreases for all categories. The probability of a loss decreased more
TABLE 2: CORRELATION OF MONTHLY RETURNS, JANUARY 2001–DECEMBER 2011 Russell 1000 Russell 2000 MSCI World ex-US MSCI Emerging Markets MSCI World ex-US Small Cap Russell 1000 1.00 Russell 2000 0.91 1.00
MSCI World ex-US 0.90 0.83 1.00
MSCI Emerging Markets 0.83 0.79 0.90 1.00 MSCI World ex-US
Small Cap 0.82 0.80 0.94 0.88 1.00
Source: Russell Investments and MSCI (www.msci.com) FIGURE 3: RISK-REWARD PLOTS, MONTHLY DATA, JANUARY 2001–DECEMBER 2011
Volatility—Annualized Standard Deviation
Annualized Compound Retur
n 10% 8% 6% 4% 2% 0% 0% 5% 10% 15% 20% 25%
MSCI World ex-U.S. Small Cap
MSCI World ex-U.S. Russell 2000
Russell 1000
fact that international small caps behave like other equity segments in that mar-ket leadership changes frequently, and that investors may be giving up valuable opportunities by not including them. in a “periodic table of returns” format
that stack-ranks indexes by total return year-by-year, and figure 5 illustrates cumulative performance. We believe that table 4 and figure 5 drive home the
We have examined the risk/reward of international small caps compared to other portfolio equity components individually, but the effects of introducing international small caps to a diversified portfolio are of more practical interest. Our observations and discussions with pension consultants indicate that institutional investors still tend to slightly overweight domestic equity relative to global market capitalization weight, and a domestic/foreign equity split of about 65 percent/35 percent is not uncommon. Also, an allocation to emerging markets has become more common than not among institutional investors. We have illustrated this “everyman” hypotheti-cal equity allocation in figure 6. While allocations vary a bit, we submit that this hypothetical structure is a reasonable starting point for our purposes here.
To highlight the benefits of adding foreign small caps to a portfolio, we com-pare the performance of the equity allo-cation shown in figure 6 with alloallo-cations that include 5-percent, 10-percent, and 15-percent allocations to international market small caps, shrinking the other allocations pro-rata. This way enables us to highlight the benefit of adding inter-national small caps without any hidden effect resulting from changing the relative weights of the other components.
The results of this introduction of foreign small caps to the portfolio are summarized in table 5. The figures for 0 percent represent the base portfolio allocation in figure 6. The addition of international small caps increased both rates of return and Sharpe ratios while having no meaningful effect on return volatility, measured by standard devia-tion. The 15-percent allocation to inter-national small caps raised total return by 14 percent and the Sharpe ratio by about 27 percent. These results are consonant with modern portfolio theory, which states that increasing the investment opportunity set should make it possible to improve risk-adjusted returns. Clearly, the international small-cap market is large enough in both number of
invest-TABLE 3: ANNUALIZED TRAILING RETURNS, STANDARD DEVIATIONS, AND SHARPE RATIOS FOR PERIODS ENDING DECEMBER 31, 2011
Annualized Trailing Returns for Periods Ending December 31, 2011
1 Year 3 Year 5 Year 10 Year 11 Year
Russell 1000 1.5% 14.8% 0.0% 3.3% 1.8% Russell 2000 –4.2% 15.6% 0.2% 5.6% 5.3% MSCI World ex US –12.2% 8.5% –4.1% 5.1% 2.4% MSCI World ex US Small Cap –15.8% 16.5% –3.2% 9.4% 7.4%
Standard Deviations for Periods Ending December 31, 2011
3 Year 5 Year 10 Year 11 Year
Russell 1000 19.2% 19.3% 16.1% 16.5%
Russell 2000 25.3% 24.5% 21.1% 21.3%
MSCI World ex US 22.7% 22.7% 18.7% 18.7%
MSCI World ex US Small Cap 23.4% 25.0% 20.5% 20.4% Sharpe Ratios for Periods Ending December 31, 2011
3 Year 5 Year 10 Year 11 Year
Russell 1000 0.76 (0.07) 0.09 (0.02)
Russell 2000 0.61 (0.05) 0.18 0.15
MSCI World ex US 0.37 (0.24) 0.18 0.02
MSCI World ex US Small Cap 0.70 (0.18) 0.37 0.26
Source: Russell Investments and MSCI (www.msci.com)
FIGURE 4: PERCENTAGE OF NEGATIVE RETURNS OVER ROLLING PERIODS, JANUARY 2001–DECEMBER 2011
Rolling Periods—Monthly Data Points Russell 1000 Russell 2000 MSCI World ex-U.S.
MSCI World ex-U.S. Small Cap
1-year 3-year 5-year 7-year
(121) (97) (73) (49) 45% 40% 35% 30% 25% 20% 15% 10% 5% 0%
investment opportunity set should be as broad as practical to reap maximum risk-reward benefits. The international small-cap market is nearly as large as the domestic small-cap market on a total capitalization basis, and it is larger in terms of the number of companies. Over the past several decades, as many of the world’s emerging economies have matured, U.S. share of global market capitalization has declined, and this is likely to continue. Globalization trends are making international small-cap stocks. This could be because large- and
mid-cap international indexes were cre-ated first, and small-cap indexes were developed later and have not yet been incorporated into investors’ bench-marking schema.
Investment portfolio theory sug-gests that, all things being equal, the able securities and market
capitaliza-tion—and more importantly, different enough—to have a meaningful impact on risk-adjusted returns.
Conclusion
On average, U.S. investors appear to underallocate to non-U.S. small-cap
TABLE 4: ANNUAL RETURNS FOR VARIOUS EQUITY INDEXES
2001 2002 2003 2004 2005 2006 2007 2008 2009 2010 2011 Annualized Return Annualized Std Dev Sharpe Ratio
Russell 2000 2.5 MSCI EM –6.2 MSCI World ex-US Small Cap 61.8 MSCI World ex-US Small Cap 29.4 MSCI EM 34.0 MSCI EM32.2 MSCI EM39.4 Russell 2000 –33.8 MSCI EM 78.5 Russell 2000 26.8 Russell 1000 1.5 MSCI EM 12.3 24.8 0.41 MSCI EM –2.6 MSCI World ex-US Small Cap –7.4 MSCI EM 55.8 MSCI EM25.6 MSCI World ex-US Small Cap 25.0 MSCI World ex-US 25.7 MSCI World ex-US 12.4 Russell 1000 –37.6 MSCI World ex-US Small Cap 50.8 MSCI World ex-US Small Cap 24.5 Russell 2000 –4.2 MSCI World ex-US Small Cap 7.4 20.4 0.26 MSCI World ex-US Small Cap –10.6 MSCI World ex-US –15.8 Russell 2000 47.3 MSCI World ex-US 20.4 MSCI World ex-US 14.5 MSCI World ex-US Small Cap 19.5 Russell 1000 5.8 MSCI World ex-US –43.6 MSCI World ex-US 33.7 MSCI EM 18.9 MSCI World ex-US –12.2 Russell 2000 5.3 21.3 0.15 Russell 1000 –12.4 Russell 2000 –20.5 MSCI World ex-US 39.4 Russell 2000 18.3 Russell 1000 6.3 Russell 2000 18.3 MSCI World ex-US Small Cap 3.3 MSCI World ex-US Small Cap –48.0 Russell 1000 28.4 Russell 1000 16.1 MSCI World ex-US Small Cap –15.8 MSCI World ex-US 2.4 18.7 0.02 MSCI World ex-US –21.4 Russell 1000 –21.7 Russell 1000 29.9 Russell 1000 11.4 Russell 2000 4.6 Russell 1000 15.5 Russell 2000 –1.5 MSCI EM –53.3 Russell 2000 27.2 MSCI World ex-US 8.9 MSCI EM –18.4 Russell 10001.8 16.5 (0.02)
Source: Russell Investments and MSCI (www.msci.com)
Sep-01 Sep-02 Sep-03 Sep-04 Sep-05 Sep-06 Sep-07 Sep-08 Sep-09 Sep-10 Sep-11
FIGURE 5: CUMULATIVE INDEX PERFORMANCE—GROWTH FIGURE 6: EXAMPLE INSTITUTIONAL
EQUITY ALLOCATION WITHOUT DEVELOPED MARKETS SMALL-CAP STOCKS 10% 45% 25% 20% MSCI Emerging Markets MSCI World ex-U.S. Russell 1000 Russell 2000 U.S. Equities
TABLE 5: ALLOCATION TO INTERNATIONAL SMALL CAPS, JANUARY 2001–DECEMBER 2011
0% 5% 10% 15%
Annualized Rate of Return 4.02% 4.21% 4.39% 4.58% Annualized Standard Deviation 18.08% 18.09% 18.11% 18.14%
Sharpe Ratio 0.11 0.12 0.13 0.14
Source: Russell Investments and MSCI (www.msci.com)
January 2001–December 2011. Base = 100
TABLE 4: ANNUAL RETURNS FOR VARIOUS EQUITY INDEXES
2001 2002 2003 2004 2005 2006 2007 2008 2009 2010 2011 Annualized Return Annualized Std Dev Sharpe Ratio
Russell 2000 2.5 MSCI EM –6.2 MSCI World ex-US Small Cap 61.8 MSCI World ex-US Small Cap 29.4 MSCI EM 34.0 MSCI EM32.2 MSCI EM39.4 Russell 2000 –33.8 MSCI EM 78.5 Russell 2000 26.8 Russell 1000 1.5 MSCI EM 12.3 24.8 0.41 MSCI EM –2.6 MSCI World ex-US Small Cap –7.4 MSCI EM 55.8 MSCI EM25.6 MSCI World ex-US Small Cap 25.0 MSCI World ex-US 25.7 MSCI World ex-US 12.4 Russell 1000 –37.6 MSCI World ex-US Small Cap 50.8 MSCI World ex-US Small Cap 24.5 Russell 2000 –4.2 MSCI World ex-US Small Cap 7.4 20.4 0.26 MSCI World ex-US Small Cap –10.6 MSCI World ex-US –15.8 Russell 2000 47.3 MSCI World ex-US 20.4 MSCI World ex-US 14.5 MSCI World ex-US Small Cap 19.5 Russell 1000 5.8 MSCI World ex-US –43.6 MSCI World ex-US 33.7 MSCI EM 18.9 MSCI World ex-US –12.2 Russell 2000 5.3 21.3 0.15 Russell 1000 –12.4 Russell 2000 –20.5 MSCI World ex-US 39.4 Russell 2000 18.3 Russell 1000 6.3 Russell 2000 18.3 MSCI World ex-US Small Cap 3.3 MSCI World ex-US Small Cap –48.0 Russell 1000 28.4 Russell 1000 16.1 MSCI World ex-US Small Cap –15.8 MSCI World ex-US 2.4 18.7 0.02 MSCI World ex-US –21.4 Russell 1000 –21.7 Russell 1000 29.9 Russell 1000 11.4 Russell 2000 4.6 Russell 1000 15.5 Russell 2000 –1.5 MSCI EM –53.3 Russell 2000 27.2 MSCI World ex-US 8.9 MSCI EM –18.4 Russell 10001.8 16.5 (0.02)
Source: Russell Investments and MSCI (www.msci.com)
profits, foundations and endowments, pension plans, municipalities, registered investment companies, and individuals. Information presented herein comes from sources deemed reliable by OAM, but we cannot guarantee their accuracy or completeness. This material is for informational and educational purposes only. The views expressed herein are as of the analysis date and subject to change based on market conditions and other factors.
The Russell 1000 Index measures the performance of the large-cap segment of the U.S. equity universe. It is a subset of the Russell 3000® Index and includes approximately 1,000 of the largest securities based on a combination of their market cap and current index membership. The Russell 2000 Index measures the performance of approximately 2,000 companies with small-market capitalizations.
The MSCI World ex-US Index (Net) is a free float-adjusted market capitalization weighted index that is designed to measure the equity market performance in developed markets, with minimum dividends reinvested net of withholding tax. The MSCI World ex-US Small-Cap Index (Net) is a free float-adjusted market capitalization weighted index that is designed to measure the equity market performance of small cap developed markets excluding the US, with minimum dividends reinvested net of withholding tax.
The Sharpe ratio is a measure of risk-adjusted performance calculated by dividing a portfolio’s excess return above a “risk-free” rate by its standard deviation. The Citigroup U.S. three-month Treasury bill returns are used as the risk-free rate.
this segment a portfolio allocation close or equal to the weighting given to domestic small-cap stocks appears to be warranted for U.S. investors.
John P. Collins, CIMA®, is national key accounts director for registered investment advisor and broker-dealer relationships for Oberweis Asset Man-agement, Inc. He earned a BS in eco-nomics from Rockford College. Contact him at [email protected]. Ralf Scherschmidt is a principal of Ober weis Asset Management and portfolio manager for the Ober weis International Opportunities Fund. He earned an MBA from Har vard Business School and a BS in finance, accounting, and Chinese from Georgetown University. Contact him at scherschmidt@ober weis.net. Brian K. Lee is director of institu-tional marketing and client service for, and a principal of Oberweis Asset Management. He earned an MBA and a BA in finance from Loyola Marymount University. Contact him at [email protected].
References
Nielsen, Frank. 2007. International Small Cap–A Distinct Asset Class? MSCI Barra Research Insights (October): 1–12. http://www.msci barra.com/research/articles/2007/Small_ Cap_Distinct_Asset_Class_Oct_07.pdf. Lystra, Mat. 2011. International small cap:
Defining a promising asset class. Russell Research December. http://www.russell. com/indexes/tools-resources/research/ international-small-cap.asp.
Subramanian, Raman Aylur, Frank Nielsen, and Giacomo Fachinotti. 2010. Globalization of Equity Policy Portfolios: A Fresh Look at Strategic Asset Allocation from a U.S. Investor Perspective. Investments & Wealth
Monitor 25, no. 4 (July/August): 6–10, 14.
Disclosure: Oberweis Asset Management, Inc. (“OAM”) is a registered investment advisor serving corporations, not-for-investing more practical and less
expen-sive, and both passive and actively man-aged investment vehicles are available in the international small-cap market.
Foreign small-cap stocks performed well in the past decade, but past performance is no guarantee of future results. Still, global trends cannot be ignored. Advances in logistics and infrastructure, improvements in education with a focus on engineering, and substantially lower costs of doing business may well drive select inter-national markets to continue to grow gross domestic product at rates much faster than in the United States. Adding international small-cap stocks to a glob-ally diversified equity portfolio would have provided meaningful risk-adjusted return benefits over the past decade, as investment theory would suggest.
U.S. investors may be missing an opportunity to improve risk-adjusted global equity returns by underweight-ing the international small-cap stock segment. Based on the size of the international small-cap market, its likely continued growth as a share of global market cap, and its risk-reward characteristics, we believe that giving
To take the CE quiz online, visit www.IMCA.org. TABLE 4, CONTINUED
2001 2002 2003 2004 2005 2006 2007 2008 2009 2010 2011 2012 2013 2014 Return Std Dev Ratio 23.1 0.38 2.5 -6.2 61.8 29.4 34.0 32.2 39.4 -33.8 78.5 26.8 1.5 18.2 38.8 13.2 10.4 19.1 0.35 -2.6 -7.4 55.8 25.6 25.0 25.7 12.4 -37.6 50.8 24.5 -4.2 17.5 33.1 4.9 8.3 19.8 0.33 -10.6 -15.8 47.3 20.4 14.5 19.5 5.8 -43.6 33.7 18.9 -12.2 16.4 25.6 -2.2 8.2 15.4 0.26 -12.4 -20.5 39.4 18.3 6.3 18.3 3.3 -48.0 28.4 16.1 -15.8 16.4 21.0 -4.3 5.6 17.6 0.14 -21.4 -21.7 29.9 11.4 4.6 15.5 -1.5 -53.3 27.2 8.9 -18.4 16.3 -2.6 -5.3 4.1
Source: Russell Investment & MSCI
MSCI World ex-US
MSCI EM
MSCI World ex-US Small Cap MSCI World
ex-US
Russell 2000
Russell 1000 Russell 2000
MSCI EM
MSCI World ex-US Small Cap
Russell 1000
Russell 1000
MSCI World ex-US Small Cap
MSCI EM
MSCI World ex-US
Russell 2000
Russell 1000 MSCI World
ex-US Small Cap
MSCI EM
Russell 2000
MSCI World ex-US
MSCI EM
MSCI World ex-US Small Cap MSCI World
ex-US
Russell 1000
Russell 2000
MSCI EM
MSCI World ex-US
MSCI World ex-US Small Cap
Russell 2000
Russell 1000
MSCI EM
MSCI World ex-US
Russell 1000
MSCI World ex-US Small Cap
Russell 2000
Russell 2000
Russell 1000
MSCI World ex-US
MSCI World ex-US Small Cap
MSCI EM
MSCI EM
MSCI World ex-US Small Cap MSCI World
ex-US
Russell 1000
Russell 2000
Russell 2000
MSCI World ex-US Small Cap
MSCI EM
Russell 1000
MSCI World ex-US
MSCI EM
MSCI World ex-US Small Cap
Russell 1000
MSCI World ex-US
Russell 2000 Russell 1000
Russell 2000
MSCI World ex-US
MSCI World ex-US Small Cap
MSCI EM
Russell 2000
Russell 1000
MSCI World ex-US Small Cap MSCI World
ex-US
MSCI EM MSCI World ex-US Russell 1000
Russell 2000
MSCI EM
MSCI World ex-US
MSCI EM
MSCI World ex-US Small Cap
Russell 2000
Russell 1000
MSCI World ex-US Small Cap 0 100 200 300 400 500 0 100 200 300 400 500 MSCI EM
MSCI World ex-US Small Russell 2000
MSCI World ex-US Russell 1000