EU Emissions Trading Scheme
UK National Allocation Plan
2005-2007
2 Introduction
Summary
1. Determination of the Total Quantity of Allowances
2. Determination of the Quantity of Allowances at Activity Level 3. Determination of the Quantity of Allowances at Installation Level 4. Technical aspects
4.1 Potential, including technological potential 4.2 Early action (if applicable)
4.3 Clean technology (if applicable) 5. Community legislation and policy 5.1 Pooling (Competition policy)
5.2 New entrants (Internal market policy)
5.3 Community legislative and policy instruments considered 6. Public consultation
7. Criteria other than those in Annex III to the Directive Appendix A Annex III of Directive
Appendix B Methodology for Calculating Sector Totals Appendix C New Entrants, Closures and Auctioning
Introduction
This document sets out the National Allocation Plan for UK installations which are subject to the European Union Emissions Trading Scheme (the “EU ETS” or the “Scheme”) for the period 2005 to 2007.
The EU ETS is a Community-wide scheme established by Directive 2003/87/EC1 (“the Directive”) for trading allowances to cover the emissions of greenhouse gases from permitted installations. The first phase of the EU ETS runs from 1 January 2005 to 31 December 2007.
Each Member State must develop a National Allocation Plan for the first phase stating:
• the total quantity of allowances that the Member State intends to issue during that phase; and
• how it proposes to distribute those allowances among the installations which are subject to the scheme.2
These Plans must be based on objective and transparent criteria, including those listed in Annex III of the Directive. Annex III consists of both mandatory and optional criteria and is reproduced for convenience at Appendix A.
National Allocation Plans must be published and notified to the European Commission. The Commission, together with the other Member States, will then consider each National Allocation Plan. The Commission may reject any aspect of any Plan on the basis that it is incompatible with the Directive, giving reasons, and may propose amendments.
Once accepted by the Commission, the National Allocation Plans will form the basis for the final decisions made by each Member State on the total quantity of allowances to be issued and their distribution to installations subject to the Scheme under Article 11 of the Directive. For the period 2005 to 2007, these final allocation decisions must be made by 1 October 2004.3
Implementation of the EU ETS is a devolved matter in the UK. Accordingly, this Plan has been developed by the UK Government and the Devolved Administrations for Scotland, Wales and Northern Ireland pursuant to their respective obligations under regulation 18 of the Greenhouse Gas Emissions Trading Scheme Regulations 20034 (“the ETS Regulations”), which transpose the Directive into domestic law. Where we describe the UK position in the remainder of this document, this should be read as meaning the agreed view of the UK Government and the Devolved Administrations.
In developing this Plan, the UK has taken into account the guidance published by the Commission to assist Member States in the implementation of the
1 Directive of the Council and European Parliament establishing a scheme for greenhouse gas emission allowance trading within the Community and amending Directive 1996/61/EC. 2 Article 9(1) of the Directive.
3 Article 11 of the Directive. 4 SI 2003/3311
4 criteria listed in Annex III of the Directive5. This document suggested a common format for National Allocation Plans which has been followed in drafting this Plan. The common format takes the form of a series of questions addressing the mandatory and optional criteria in Annex III. The answers to these questions, which are set out below, describe how the UK considers the criteria have been met.
The UK published a draft National Allocation Plan in January 2004 for consultation. This Plan has been prepared in light of the issues raised and responses received during that consultation. Further discussion of these issues and the changes made as a result of the consultation process are set out in Section 6. It has not been possible to resolve all issues prior to the notification of this plan and these will be subject to a brief period of further consultation.6 In accordance with criterion (9) of Annex III, Section 6 explains how further comments can be made on this Plan (including further consultation on the unresolved issued mentioned above) and how the UK proposes to take account of those comments before any final decision on the allocation of allowances is taken.
5 COM (2003)830
Summary
1. The UK has determined that 736 MtCO2 will be allocated during Phase 1 of the EU ETS.
Paragraph 1.13 2. Allocations of allowances will be made in a two-stage
approach that allocates allowances at sector level the first instance and subsequently allocates to installations within each sector.
Sections 2 & 3
3. Allocations at sector level will be made on the basis of the sector’s projected emissions between 2005 and 2007, save for the power generation sector which will be allocated 5.5MtCO2 below its projected emissions.
Section 2 & Appendix B 4. Allocations at installation level will be issued in three equal
annual instalments and will be made on the basis of each installation’s share of “relevant emissions”. Relevant emissions are generally the average of the highest five years emissions during baseline period (1998-2003). Special rules for calculating relevant emissions of:
• installations undergoing commissioning during baseline period;
• installations where rationalisation of production has taken place during baseline period; and
• installations commencing operations in 2003.
Section 3
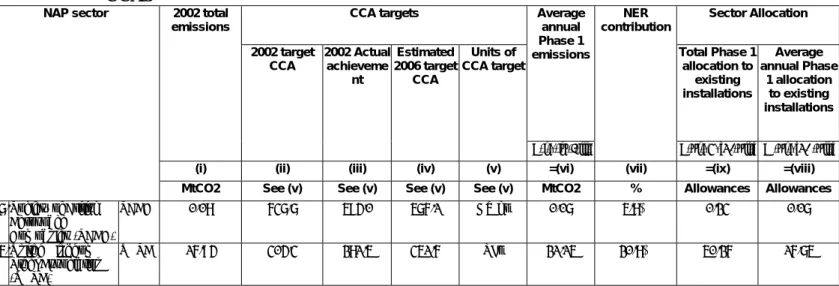
5. Allowances will be made available to new entrants in Phase 1 free of charge from a new entrant reserve of 7.7% of total allowances. Priority access to a ring fenced portion of the reserve will be given to Good Quality CHP reserve.
Appendix C
6. Any surplus allowances remaining in the new entrant reserve at the end of each year in Phase 1 will be auctioned.
Appendix C 7. Installations that cease to carry out an Annex 1 activity will
not be issued with allowances for the years after cessation.
Appendix C 8. The UK is submitting separate applications for the
temporary exclusion of installations that are covered by the UK Emissions Trading Scheme or by Climate Change Agreements alongside this NAP.
Paragraph 3.17
6 1. DETERMINATION OF THE TOTAL QUANTITY OF ALLOWANCES
What is the Member State’s emission limitation or reduction obligation under Decision 2002/358/EC or under the Kyoto Protocol (as applicable)?
1.1 The overall EU commitment under the Kyoto Protocol is to reduce emissions of greenhouse gases by 8% on 1990 levels by 2008-12. The UK’s commitment under the Burden Sharing Agreement7 is to reduce its emissions of greenhouse gases by 12.5% below base year8. The target annual level of emissions implied by the Burden Sharing Agreement is 653 Mt carbon dioxide equivalent calculated9 from data in the UK’s 2004 inventory submission, which is the most recent data provided to the EU and to the UNFCCC and contains estimates from 1990 to 2002 inclusive.
1.2 In addition to these international commitments, the UK has a domestic goal of moving towards a 20% reduction in CO2 emissions by 2010. This goal was confirmed in the UK Climate Change Programme, published in November 2000.10 The UK Energy White Paper which was published in February 200311 sets the framework for putting the UK on a path to a reduction in CO2 emissions of 60% by 2050, with significant progress by 2020.
1.3 The most recent year for which the UK has published emissions data is 2002 when total annual emissions of all greenhouse gases12 were estimated to be 648.4 MtCO2 equivalent and emissions of CO2 were estimated to be 551.0 MtCO2.13 The data show falls of slightly less than 3.5% for all greenhouse gases and slightly more than 3.5% for CO2 emissions between 2001 and 2002. However, provisional estimates show that emissions probably rose by about 1.5% between 2002 and 2003.
What principles, assumptions and data have been applied to determine the contribution of the installations covered by the emissions trading Directive to the Member State’s emission limitation or reduction obligation (total and sector historical emissions, total and sector forecast emissions, least-cost approach)? If forecast emissions were used, please describe the methodology and assumptions used to develop the forecasts.
7 Council Decision 2002/358/EC.
8 1990 for emissions of carbon dioxide, methane and nitrous oxide, 1995 for fluorinated compounds.
9 Consistent with the provisions of the Annex to COP decision 19/CP7 on the treatment of land-use change and forestry in the accounting of assigned amount.
10 http://www.defra.gov.uk/environment/climatechange/cm4913/index.htm 11 www.dti.gov.uk/energy/whitepaper/index.shtml
12 Including emissions from land use change. 13 See
UK Greenhouse Gas Inventory 1990 to 2002, National Environmental Technology Centre, 2004 (Report reference AEAT/ENV/ R/1702, available electronically at
1.4 In determining the contribution which the installations covered by the Directive should make towards the UK’s international and domestic emission reduction targets, the UK’s starting point has been to estimate its total projected emissions in 2010 and then to consider the additional savings which the EU ETS sector should deliver. The UK has then calculated sector allocations by applying the details of the emissions projections in a combination of top-down and bottom-up methodologies (described in more detail in Section 2 and Annex B) and by taking account of the additional EU ETS savings (see paragraph 1.11 below).
Emissions projections
1.5 The UK published projections of carbon dioxide14 and non-CO2 greenhouse gas emissions15 alongside the Climate Change Programme in November 2000. These formed the basis of the UK’s Third National Communication under the United Nations Framework Convention on Climate Change (October 2001)16. The baseline with measures projection in the
Communication estimated that the UK’s emissions of the basket of greenhouse gases was expected to be 14.8% below 1990 levels in 2010, with emissions of carbon dioxide measures 8.2% below.
1.6 The UK Climate Change Programme and the Third National Communication set out the policies and measures designed to secure the delivery of the Kyoto target and to move towards the domestic goal. The policies and measures as quantified were estimated to reduce the UK’s emissions of the Kyoto basket of greenhouse gases to 23% below the base year and to reduce the UK’s carbon dioxide emissions to 19% below the 1990 levels, with further measure that could not be quantified to bring the domestic target within reach.
1.7 The UK has been updating its energy and emissions projections. The updated projections will show the expected level of total UK emissions of CO2 over the next few years taking account of latest forecasts of emission reductions from the policies in the Climate Change Programme. Estimates of CO2 emissions will then be available for 2005, 2010 and 2020. This exercise is ongoing and is currently referred to as the updated energy projections or “UEP”. An initial view of input assumptions for UEP was published for consultation in July 2003 and preliminary results of July model runs were published in August 2003. Those preliminary results were used within the draft NAP in January.
1.8 A working paper setting out the latest projections, and summarising the basis of the Energy Model and revised input assumptions to those projections, is being published separately during May 2004. In headline terms, it is noteworthy that:
14
Energy Paper 68: Energy Projections for the UK, November 2000, The Stationery Office: www.dti.gov.uk/energy-projections.htm
15
Projections of Non-CO2 Greenhouse Gas Emissions for the United Kingdom and Constituent Countries, November 2000, WS Atkins Consultants Ltd.
8 (a) without allowance for measures set out in the UK Climate
Change Programme, total UK emissions of CO2 in 2010 would be projected around 572 MtCO2, a 5.4% reduction on 1990 levels;
(b) with allowance for measures set out in the UK Climate Change Programme which have already been implemented or for which firm plans are in place, the July projections17 suggested that total UK emissions of CO2 in 2010 would be around 512.4 MtCO2, a 15.4% reduction on 1990 levels;
(c) latest projections, allowing for an updated assessment of these measures, show total UK emissions of CO2 in 2010 around 519 MtCO2, a 14.3% reduction on 1990 levels. Since the draft NAP was published in January 2004, the Government has published an Energy Efficiency Implementation Plan.18 The latest projection allows for firm measures within that Plan, as well as other refinements to the underlying sectoral projections; and
(d) potential for further carbon savings of up to another 2.7 MtCO2 by 2010 is identified in the Energy Efficiency Implementation Plan. These measures are not sufficiently developed to allow for at this stage – they are more likely to impact on allocations in the 2nd phase of the EUETS. If further carbon savings of 2.7 MtCO2 in 2010 are delivered then UK emissions around 516 MtCO2 would be around 14.7% below 1990 levels.
1.9 Work on the projections is continuing and could lead to further revision of projected emissions overall and of the contribution within that from sectors and installations covered by the EUETS. This work will be finalised in time to feed into the revised sector and installation allocations which we aim to publish in late July/early August. In particular:
(a) further research is underway to consider the appropriateness of growth rates assumed for the ETS sectors within the updated energy projections, and to consider the case for further division of some sectors. This work responds to concerns raised in the consultation process. It will feed into possible revised sector and installation allocations which we aim to produce in late July/early August;
(b) work is continuing to consider projected emissions from the iron and steel sector, where there are unresolved differences between data submitted for the purposes of national statistics – used in Government projections of overall UK emissions - and data submitted by companies to inform the NAP;
(c) work to refine the projected profile of emissions from Combined Heat and Power (CHP) schemes by sector and to consider the impact of CHP new entry on other emissions;
(d) work to refine the split of carbon savings attached to Climate Change Programme measures by fuel;
17 These were the projections used in the draft NAP published in January 2004. 18 See http://www.official-documents.co.uk/document/cm61/6168/6168.pdf
(e) further work needed to ensure consistency between the projections, the emissions inventory methodology and data at the company level; and
(f) further work to look at consistency of emission factors across refineries.
1.10 The most recent projections for non-CO2 greenhouse gases are those published in the UK’s Third National Projection. These indicate a fall of about 38% between 1990 and 2010, or about 39% over the same period if 1995 is used as the base year for the fluorinated compounds. If combined with a fall of 14% in CO2 emissions this would produce a reduction of about 20% between the base year and 2010 for UK greenhouse emissions as a whole. Emissions projections for non-CO2 gases are currently being updated and this work is scheduled for completion in August 2004.
What is the total quantity of allowances to be allocated (for free and by auctioning)?
Phase 1: 2005-2007
1.11 The UK has decided that the first phase of the EU ETS (2005-7) will be used to deliver additional CO2 savings which it was envisaged in the UK Climate Change Programme would be delivered by emissions trading but for which there are no firm policies yet in place (equivalent to 1.5 MtC or 5.5 MtCO2 by 2010). These additional savings equate to 5.5 MtCO2 in total from 2005 to 2007.
1.12 As explained in Section 2 below, the UK has incorporated the effects of its climate change policies and the achievement of the additional savings referred to in the previous paragraph into the methodology for calculating sector allocations.
1.13 Using this methodology, the total quantity of allowances to be issued to EU ETS installations for 2005 to 2007 will be 736 MtCO2. This figure is subject to further revision in light of ongoing work. In particular, the figure will be revised in light of the following:
(a) the completion of the ongoing work on the UK’s energy projections (see paragraph 1.9 above);
(b) the receipt of revised data on historic emissions from individual installations – either as a result of clarification of the emission
points covered by the Scheme in the permits to be issued by the relevant regulators and/or as a result of the verification of the
historic emissions data. This process is likely to continue over the summer;
(c) the review of the Climate Change Agreement targets on which some of the activity level calculations were based (see further Section 2 below); and
10 1.14 The UK plans to allocate 92.3% of the total quantity to existing installations, which will be issued for free in three equal instalments.
1.15 The remaining 7.7% will form a new entrant reserve of 56.8m allowances which will be made available to new installations and certain existing installations that will be given access to the NER as detailed in section 5.2 below. If there are any allowances remaining in the new entrant reserve at the end of any year in Phase 1, these will be auctioned.
Phase 2: 2008-2012
1.16 The Government is firmly committed to its domestic goal of moving towards a 20% reduction in CO2 emissions below 1990 levels by 2010. In determining the total quantity of allowances to be issued for the second phase of the EU ETS from 2008 to 2012, the Government will ensure that installations covered by the Scheme make an appropriate contribution to that goal. This issue will be considered further in the review of the UK Climate Change Programme which will take place later in 2004.
Relationship between Kyoto and domestic targets, updated energy projections and EU ETS policy
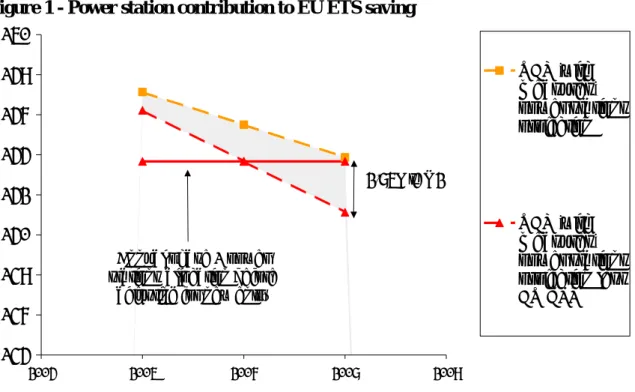
1.17 The relationship between the UK Kyoto and domestic targets, the carbon dioxide emissions estimated from the updated energy projections (UEP) and the decisions set out above on the first phase of the EU ETS are set out in Chart 1.
• The blue line (labelled “Kyoto”) shows the implications for carbon dioxide if UK emissions were allowed to rise to the level of its Burden Sharing Agreement target. Since there is no Kyoto commitment for carbon dioxide alone the estimate is a back calculation based on non-CO2 emissions projections in the Third National Communication.
• The yellow line (labelled “with CCP”) represents the latest projections of emissions allowing for measures set out in the UK Climate Change Programme which have already been implemented or for which firm plans are in place. This would lead to a 14.3% reduction on 1990 levels by 2010 (see paragraph 1.8(c) above).
• The red line (labelled “with CCP + EU ETS”) shows what would happen were the policy for Phase 1 of the EU ETS set out at paragraph 1. 11 continued into Phase 2 of the Scheme (representing annual reductions of 5.5 MtCO2 by 2010) and no other additional measures introduced. This would lead to a 15.2% reduction on 1990 levels by 2010.
• The green line (labelled “domestic goal”) sets out a straight line from 2000 to a 20% reduction on 1990 levels by 2010.
1.18 The result of the intention to use the EU ETS to move UK emissions further towards the national goal will be that the emissions profile for Phase 2 will move below the red line towards the 20% reduction represented by the green line. As explained in paragraph 1.16, the policy for Phase 2 will be
considered in more detail as part of the review of the Climate Change Programme later in 2004.
Chart 1 – Relationship between UK targets, Energy Projections and EU ETS
450 490 530 570 610 2000 2002 2004 2006 2008 2010 MtCO2 Kyoto UEP 'with measures' UEP 'with measures' + EU ETS National goal
What is the proportion of overall emissions that these allowances represent in comparison with emissions from sources not covered by the emissions trading Directive? Does this proportion deviate from the current proportion of
emissions from covered installations? If so, please give reasons for this deviation with reference to one or more criteria in Annex III to the Directive and/or to one or more other objective and transparent criteria.
1.19 The installations covered by the EU ETS were responsible for around 46% of UK CO2 emissions in 2002. If the total quantity of allowances for the first phase was extrapolated to 2010, based on projected emissions, the installations covered by the EU ETS would still account for around 46% of UK’s total emissions by 2010.
What policies and measures will be applied to the sources not covered by the emissions trading Directive?
12 1.20 The UK Climate Change Programme sets out the approach that the UK is taking to reduce greenhouse gas emissions across six broad sectors: energy supply; business; transport; domestic; agriculture, forestry and land use; and public sector. It therefore includes both EU ETS installations and sources which are not covered by the EU ETS.
1.21 Emissions from the energy supply sector include those from the production of fuel for final consumption by other sectors. This includes electricity generation, oil production and refining, gas production and transmission, and the production of coal and other solid fuels. The electricity supply industry (ESI) is still largely reliant on fossil fuels. Unless these plants can be replaced by plant with low or no emissions, emissions from ESI will increase during the latter years of the current decade as existing nuclear power stations close.
1.22 The Energy White Paper, published in February 2003, defines a long-term strategic vision for energy policy. It has four goals for energy policy, putting the UK on a path towards a 60% reduction in CO2 emissions by about 2050 with real progress by 2020; maintaining the reliability of energy supplies; promoting competitive markets in the UK and beyond; and ensuring that every home is adequately and affordably heated.
1.23 In 2002, renewable energy accounted for 3% of electricity generated in the UK. The target for England, Scotland and Wales under the Renewables Obligation19 is that 10.4% of all sales from licensed electricity suppliers will be generated from eligible renewable sources by 2010, subject to the cost to the consumer being acceptable. In the absence of the Obligation, renewables might have expanded towards perhaps 5% of generation in 2010. More recently, the Energy White Paper set out the ambition of doubling the share of electricity generation from renewables provided for in the 2010 target by 2020. The UK is committed to pursuing policies to achieve that and recently announced an extension of the Renewables Obligation to 15% of electricity from renewables by 2015.
1.24 CHP technology is a key element of the UK strategy for the energy supply sector. In 2002, the UK’s installed CHP capacity was around 4,700 megawatts. The UK has set itself a target to achieve an installed capacity of at least 10,000 megawatts of Good Quality CHP by 2010. The carbon savings from increased use of CHP are reflected among a range of other policies within the Climate Change Programme, particularly the climate change levy, climate change agreements and community heating.
1.25 Measures that will reduce emissions from the business sector include:
19 Introduced in April 2002, the Renewables Obligation requires all licensed electricity suppliers in England & Wales to supply a specified and growing proportion of their electricity sales from a choice of eligible renewable sources. The Obligation is enforced by the
Renewables Obligation Order (SI 2002/914) . The Renewables Obligation Scotland is the equivalent instrument in Scotland enforced by the Renewables Obligation (Scotland) Order 2002 (SSI 2002/163).
a) the climate change levy, including an exemption for renewables and CHP, and discounts for certain sectors when accompanied by negotiated agreements (or “climate change agreements”)20;
b) an integrated programme of measures run or administered by the Carbon Trust to accelerate the take up of cost effective, low carbon technologies and other measures by business and other levy payers;
c) the UK Emissions Trading Scheme21;
d) permits issued under the Integrated Pollution Prevention and Control (IPPC) Directive22 which impose both emissions limit values on greenhouse gases where these are likely to be emitted in significant quantities and energy efficiency requirements;
e) amendment of the energy efficiency requirements of the Building Regulations to raise performance standards, including new requirements for non-domestic buildings for lighting, air conditioning, space heating and meters; and
f) the proposed EC F-gas Regulation which will contain measures to further reduce emissions of HFCs, PFCs and SF6 resulting from their use in refrigeration, air conditioning and fire protection equipment and will introduce some marketing restrictions on certain products containing HFCs, PFCs and SF6, indirectly leading to reduction in emissions as consumption of these products is reduced and then banned.
1.26 There are four main policies for improving energy efficiency in the residential sector:
a) the Energy Efficiency Commitment (EEC) is an obligation on domestic energy suppliers to assist electricity and gas customers to take up energy saving opportunities. Under the first EEC, which runs from April 2002 until March 2005, each supplier has an energy saving target, which they can meet by assisting householders to install energy saving measures. The UK confirmed in the Energy White Paper that it would consult on an expansion of the EEC to run from 2005 to at least 2008, at possibly twice the current level of activity;
b) the Community Energy Programme to promote community heating through grants to install new schemes, and to refurbish obsolete infrastructure and equipment;
c) although the primary goal of the New Home Energy Efficiency Scheme (New HEES) is to alleviate fuel poverty, it could generate additional carbon savings by 2010. Equivalent schemes in Scotland - the Central Heating Programme and the Warm Deal - will provide additional savings; and
20 For further information on the Climate Change Agreements, see Appendix D. 21 For further information on the UK Emissions Trading Scheme, see Appendix D.
22 Council Directive 96/61/EC concerning integrated pollution prevention and control which was transposed by the Pollution Prevention and Control Regulations 2000 (S.I, 2000/1973).
14 d) in addition, various enabling or supporting policies include the work
of the Energy Saving Trust (EST), and the product policies of the Market Transformation Programme (MTP).
1.27 The non-EU ETS sector with the largest emissions is transport, which in 2001 was responsible for about 18.3% of the UK’s greenhouse gas emissions and about 21.5% of CO2 emissions. The European Commission’s voluntary agreements with car manufacturers, backed up by consumer information and fiscal incentives are integral to the UK’s key policies to reduce emissions from this sector. These are the 10 Year Plan for Transport23, passenger car labelling, changes to vehicle excise duty and reform of company car taxation.
1.28 The public sector is subject to the same pressures as others to improve its energy efficiency. The climate change levy applies to this sector, together with energy reduction targets for buildings in the Government estate, schools and hospitals.
1.29 Emissions of methane and nitrous oxide from agriculture are projected to fall by about 6.6 MtCO2 between the base year and 2010. Changes to the Common Agricultural Policy and the shift away from production related subsidies should mean that livestock numbers continue to fall; agri-environment schemes will continue to encourage more extensive farming; implementation of the EC Nitrates Directive24 will help to limit the amount of nitrogen applied to the land; and implementation of the IPPC Directive, which will apply to larger intensive pig and poultry farms, should also reduce emissions of nitrous oxides and methane.
1.30 In relation to emissions from waste, increased collection of landfill gas for energy recovery and environmental control have resulted in lower methane emissions from UK landfill. In 2000, 1750kt of methane was abated by energy recovery or flaring. This capacity is forecast to increase to 2465 kt of methane in 2005. In addition, implementation of Article 5 of the EC Landfill Directive25 restricting the amount of biodegradable municipal waste disposed of in landfill from 2010, will result in further reductions of methane production of between 7 kt and 15 kt of methane in 2010 with increasing reductions until 2020.
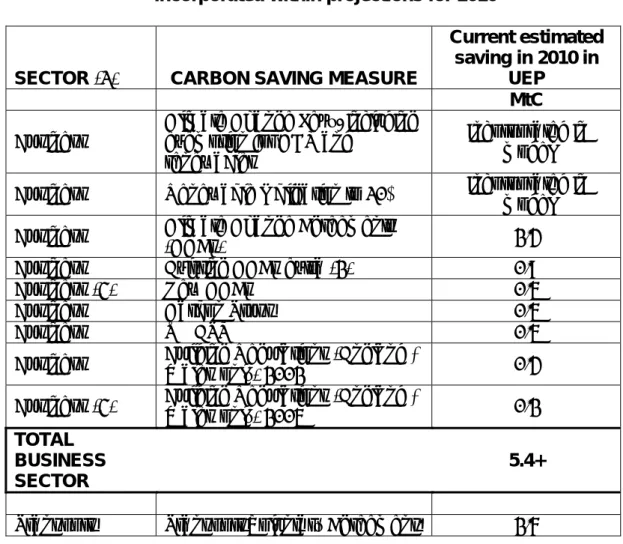
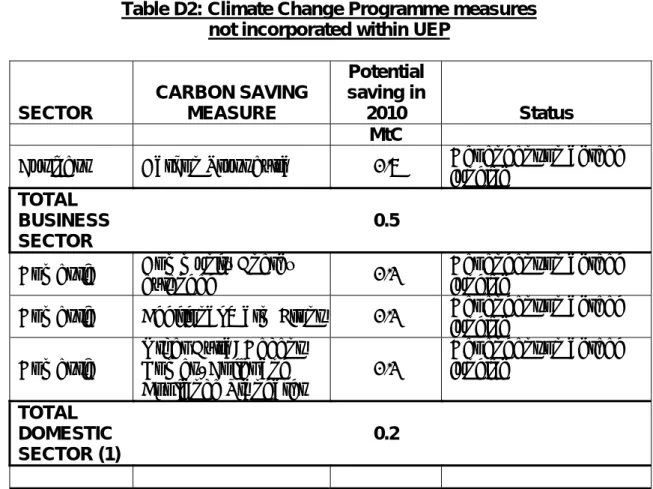
1.31 The emissions reductions which it is estimated that the Climate Change Programme measures described below will achieve are summarised in Appendix D together with the details of how these estimated reductions have been derived. These reductions have been incorporated into the updated emissions projections discussed at paragraphs 1.7 and 1.8 above.
23 For further information on the 10 Year Plan, see Appendix D.
24 Council Directive 91/676/EEC concerning the protection of waters against pollution caused by nitrates from agricultural sources.
25 Council Directive 1999/31/EC on the landfill of waste. Article 5 of the Directive, which sets targets for the reduction of biodegradable municipal waste sent to landfills was transposed by the Waste and Emissions Trading Act 2003.
Will use be made of the flexible mechanisms of the Kyoto Protocol? If so, to what extent and what steps have been taken so far (e.g. advancement of relevant legislation, budgetary resources foreseen)?
1.32 Given that the projections set out above show that the UK is on course to meet its Kyoto Protocol target, it is not intended that any use will be made of the flexible mechanisms by the UK government to meet its Burden Sharing Agreement target.
How has national energy policy been taken into account when establishing the total quantity of allowances to be allocated?
1.33 As mentioned in paragraph 1.2, the Energy White Paper, published in February 2003, set out the overall goals for UK energy policy for the long-term and set four new goals for energy policy. Amongst these is a commitment to put the UK on a path to cut CO2 emissions by some 60% by about 2050, with real progress by 2020.26 These longer-term commitments build on the UK’s existing goal to move towards a 20% reduction in CO2 emissions below 1990 levels by 2010. The Energy White Paper stated that the EU ETS will be “the central plank of our future emissions strategy”.
1.34 National energy policy has been further incorporated within the updated energy and emission projections through inclusion within the projections of the impact of the Government’s firm Climate Change Programme measures (see Appendix D and specifically Table D1) and, for projections, through the use of the DTI energy model which assumes cost-minimisation behaviour in line with the emphasis of energy policy on competitive markets.
1.35 The UK has not set targets for the share of total energy or electricity supply to be met from different fuels. The UK prefers to create a market framework, reinforced by long term policy measures, which gives investors, business and consumers the right incentives to find the balance that will most effectively meet our overall goals. However, recognising that specific measures were needed to stimulate growth in renewable energy, specific policies were developed (see paragraph 1.23) above.
1.36 Nuclear power is currently an important source of carbon-free electricity in the UK, but its share of the generating mix will decline markedly in the latter years of the current decade as existing nuclear power stations reach the end of their licensed lifetimes. The Energy White Paper concluded that its current economics make nuclear power an unattractive option for new, carbon-free generating capacity. It did not contain any specific proposals for building new nuclear power stations, nor did it rule out the possibility that at some point in the future new nuclear build might be necessary.
26 The other three goals are: maintaining the reliability of energy supplies; promoting competitive markets in the UK and beyond; and ensuring that every home is adequately and affordably heated.
16
Is the total quantity of allowances intended to be allocated consistent with a path towards achieving or overachieving the Member State’s target under Decision 2002/358/EC or under the Kyoto Protocol (as applicable)?
1.37 Given that the projections set out in paragraphs 1.8 and 1.10 demonstrate that the UK will over-achieve its Burden Sharing Agreement target as a whole, the UK may decide (a) what level of over-achievement its policies will aim to achieve and (b) the time by which any level of emissions reductions below the Burden Sharing Agreement target will be reached (provided that the total takes into account national energy policies and is consistent with the national climate change programme).
1.38 As indicated at paragraph 1.11 above, the UK has decided that the level of allowances to be allocated for the first phase of the Scheme should be based on the projections of UK emissions set out in paragraph 1.8 above less an additional 5.5 MtCO2 reduction by 2010. The total quantity of allowances to be allocated is therefore consistent with a path towards over-achieving the UK’s Burden Sharing Agreement target (see Chart 1 above).
How is it ensured that the total quantity of allowances to be allocated is not more than is likely to be needed for the strict application of the criteria of Annex III?
1.39 The total number of allowances is based on projections which take into account the effects of policies and measures designed to secure delivery of the UK’s Burden Sharing Agreement target and to move towards the more stringent domestic goal. As explained in Appendix B, the total number allowances allocated in Phase 1 is 5.5 MtCO2 less than the projected emissions from the installations covered by the Directive and this requirement is therefore satisfied.
How is consistency with the assessment of actual and projected emissions pursuant to Decision 93/389/EEC ensured?
1.40 The 2003 Report from the Commission under Council Decision 93/389/EEC as amended by Decision 99/296/EC for a monitoring mechanism of Community greenhouse gas emissions27 concluded that in 2001 the UK
was “on track” towards reaching its specific target under the Burden Sharing Agreement.
1.41 Since the total quantity of allowances is not more than would be necessary taking into account actual and projected emissions contained in the 2003 and earlier Reports, the UK considers that the total quantity of
allowances that it has decided to allocate in the first phase is consistent with the assessments provided under the Monitoring Mechanism Decision.
If the Member State intends to auction allowances, please state the percentage of the total quantity of allowances that will be auctioned, and how the auction will be implemented.
1.42 The UK only intends to use auctioning as a mechanism for the distribution of un-issued allowances in the new entrant reserve (see Appendix C).
18
2. DETERMINATION OF THE QUANTITY OF ALLOWANCES AT
ACTIVITY LEVEL
By what methodology has the allocation been determined at activity level? Has the same methodology been used for all activities? If not, explain why a differentiation depending on activity was considered necessary, how the differentiation was done, in detail, and why this is considered not to unduly favour certain undertakings or activities within the Member State.
2.1 The UK has decided to use a two stage approach to allocate allowances to EU ETS participants. First, the total number of allowances has been allocated to the sectors. The sector level allocations have then been further distributed to individual installations in those activities (see Section 3 below).
2.2 The UK government has decided that the allocation of allowances to the sectors28 covered by the EU ETS will be determined as follows:
• all sectors covered by the scheme will be allocated allowances equivalent to their projected emissions;
• save for the Power Station sector which will be allocated 5.5 MtCO2 less than that sector’s projected emissions during the first phase (the rationale for this is set out at paragraph 2.12 below and paragraph 3.1.3 of Appendix B).
2.3 The UK government has also decided to create a New Entry Reserve (NER) of allowances for new entrant installations that join the scheme during phase 1. Estimated allocations to the new entrants in each sector are taken off the estimated total emissions from that sector before allocating allowances from the sector total to existing installations. This process is designed to ensure that the total allowances allocated to the new and existing installations are in line with the total projected emissions in that sector. See Appendix C for more details on how allocations to new entrants have been calculated.
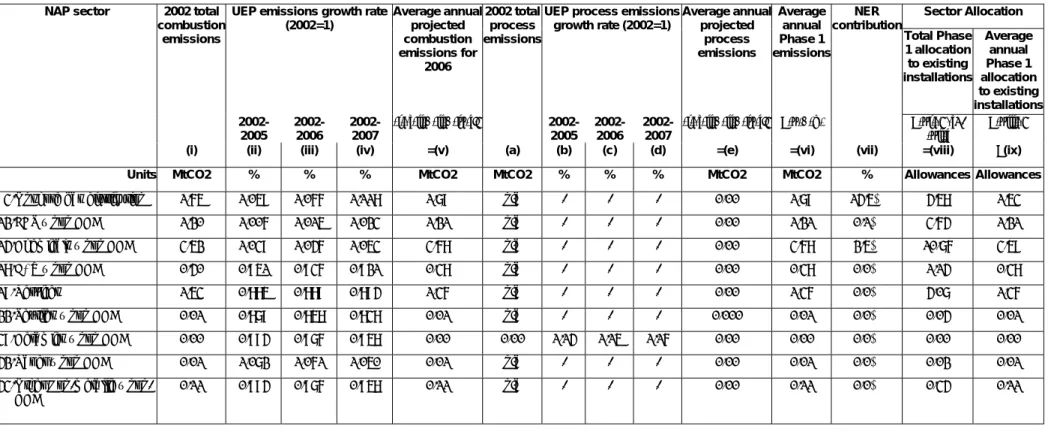
2.4 The UK government has decided to allocate allowances in three equal annual instalments for the first phase of the EU ETS. Hence, for each sector the average annual sector level allocation is estimated.
2.5 To estimate the projected emissions from the EU ETS covered sectors, the UK has used its energy model (‘UEP’) as described in paragraph 1.7 to 1.9 above. The projected emissions for each EU ETS sector are calculated after incorporating the effects of current Climate Change Programme policies and measures on that sector.
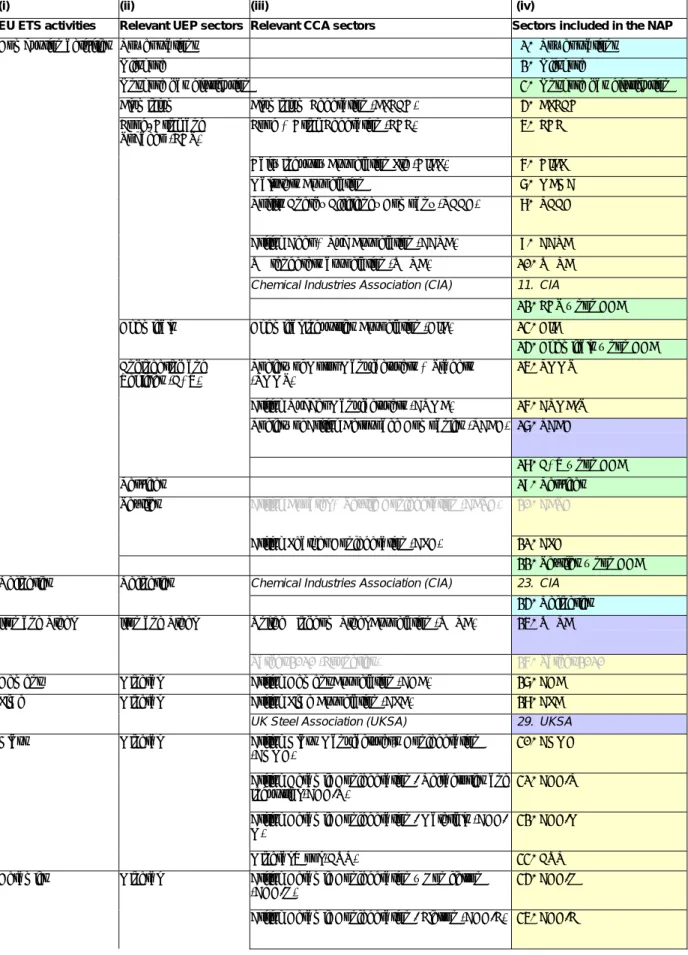
28 The term ‘sector’ has different meanings in relation to the updated energy projections (UEP), the Climate Change Agreements (CCAs) and the EU ETS To minimise confusion, references in this Appendix to ‘sector’ means the relevant EU ETS sector(s). Where UEP or CCA sectors are meant, that will be expressly specified.
2.6 Further details of the different methodologies used to calculate the sector total for each EU ETS sector are presented in Appendix B. The methodology described above is intended to provide each sector with an allocation based on need, taking into account existing policy commitments. On this basis, the UK government believes, that, although the methodology of calculation varies between sectors, the calculation for any individual sector should not unduly favour certain undertakings or activities within the UK.
2.7 The UK has yet to make a final decision on whether the particular characteristics of the electricity supply industry in Northern Ireland (and possibly the Scottish islands) make it appropriate to split the power station allocation prior to distribution to installations. We are considering this issue further and a final decision will be made shortly.
2.8 In addition, as mentioned in paragraph 1.9 above, further research is underway to consider the appropriateness of growth rates assumed for the ETS sectors within the updated energy projections, and to consider the case for further division of some sectors. The results of this research will feed into revised sector and installation allocations which we aim to produce in late July/early August 2004.
2.9 The sector totals which derive from the methodology set out in Appendix B are summarised in Table 1 below. These figures are subject to further revision in light of ongoing work. In particular, they will be revised in light of the following:
(a) the completion of the ongoing work on the UK’s energy projections (see paragraph 1.9 above);
(b) the receipt of revised data on historic emissions from individual installations – either as a result of clarification of the emission
points covered by the Scheme in the permits to be issued by the relevant regulators and/or as a result of the verification of the
historic emissions data. This process is likely to continue over the summer;
(c) the review of the Climate Change Agreement targets on which some of the activity level calculations were based. The sector totals set out below are calculated on the basis the proposed starting point for the re-negotiations of these targets (see further Appendix B);
(d) for the iron and steel sector, the allocation is based on energy intensity data for 1997-2000. We are examining further how this intensity may change to 2006; and
20 Table 1 - Comparison of historic emissions and annual allocations
1. Average annual emissions (1998-2002) 2. Annual emissions (2002) 3. Annual allocation before subtracting NER 4. % of sector total allocated to New Entrant Reserve (NER) 5. Annual allocation to existing installations (i.e. after NER)
MtCO2 MtCO2 MtCO2 % MtCO2
Power stations non-CCA 152.4 158.2 143.7 8.0% 132.2
Refineries non-CCA 17.4 17.7 19.0 0.8% 18.9 Refineries CCA 0.1 0.1 0.1 0.0% 0.1 Onshore gas distribution non-CCA 1.3 1.7 1.8 14.5% 1.5 Offshore non-CCA 17.5 18.7 19.1 4.5% 18.3 Cement CCA 9.0 9.6 10.1 8.9% 9.2 Lime CCA 2.5 2.2 2.4 3.4% 2.3 Ceramics non-CCA 0.0 0.0 0.0 0.0% 0.0 Ceramics CCA 1.6 1.7 1.7 3.0% 1.7 Glass CCA 1.7 1.9 2.0 3.5% 1.9
Pulp & Paper non-CCA 0.0 0.0 0.0 0.0% 0.0
Pulp & Paper CCA 3.9 4.3 4.3 3.3% 4.1
Food & Drink non-CCA 1.2 1.2 1.2 0.1% 1.2
Food & Drink CCA 2.5 2.7 2.7 2.4% 2.7
Chemicals non-CCA 3.0 3.5 3.7 2.5% 3.6
Chemicals CCA 7.2 7.1 7.4 4.8% 7.1
Non-Ferrous CCA 2.6 2.7 2.6 0.0% 2.6
Iron & Steel CCA 19.6 16.9 21.2 20.8% 16.8
Engineering &
Vehicles non-CCA 0.3 0.4 0.4 0.0% 0.4
Engineering &
Vehicles CCA 0.7 0.6 0.6 4.0% 0.6
Others Total non-CCA 1.5 1.7 1.5 0.0% 1.5
Others Total CCA 0.0 0.0 0.0 0.0% 0.0
Notes to Table 1:
(a) The emissions figures in columns 1 and 2 are based on data provided by operators of installations and are therefore subject to change as those data are refined.
(b) The allowance allocations set out in the table are provisional and are subject to further changes as a result of ongoing work to improve emissions data and the projections used to calculate the sectoral allocations, as well as the outcome of consultation on the NER contributions from the sectors.
(c) The NER percentage shown in column 4 above is the average NER contribution over Phase 1 as a whole.
(d) The emission totals in columns 1 and 2 reflect only emissions from installations still operational at the start of Phase 1. They exclude emissions from installations that have since ceased operations.
(e) There appears to be an inconsistency in the relationship between emissions and GVA growth for the engineering and vehicles and ceramics UEP sectors. This results in an unexpected relationship between allocations to installations with and without CCAs in these sectors. We are continuing to explore this apparent inconsistency as the UEP modelling is finalised.
If the potential, including the technological potential, of activities to reduce emissions was taken into account at this level, please state so here and give details in Section 4.1 below.
2.10 The potential of different sectors to achieve emissions reductions by using technologies which are cost-effective has been taken into account in setting the sector totals. Further details are set out in section 4.1 below.
If Community legislative and policy instruments have been considered in determining separate quantities per activity, please list the instruments considered in Section 5.3 and state which ones have been taken into account and how.
2.11 See section 5.3 below.
If the existence of competition from countries or entities outside the Union has been taken into account, please explain how.
2.12 Power stations are being required to deliver the additional ‘emissions trading’ savings referred to in paragraph 1.11 above because this sector faces limited international competition and is thought to have a relatively large scope for low cost abatement opportunities. For example, electricity imports in 2002 amounted to only around 2% of total electricity supplied. Exports of
22 electricity were considerably lower than that. This trade is also concentrated in the EU market, all of which is affected by the EU scheme. There will be possibilities for changing the relative utilisation of existing gas fired and coal fired power stations. For some years it has been clear that gas fired plant is the electricity generators' commercial preference for new generating capacity. Over time, the continued introduction of new gas-fired plant and retirement of older coal fired plant, will help to reduce emissions. Generators are not subject to competition from firms outside the EU ETS. Thus, this sector may be better placed to incorporate the marginal cost of carbon to reflect the higher marginal costs of generation from fossil fuels resulting from the scheme. Once the EU ETS comes into force, we expect the value of carbon to be reflected in electricity prices across Europe.
3. DETERMINATION OF THE QUANTITY OF ALLOWANCES AT INSTALLATION LEVEL
By what methodology has the allocation been determined at installation level? Has the same methodology been used for all installations? If not, please explain why a differentiation between installations belonging to the same activity was considered necessary, how the differentiation by installation was done, in detail, and why this is considered not to unduly favour certain undertakings within the Member State.
3.1 The determination of sector level allocations is set out in Section 2 and Appendix B. This section describes the methodology used to determine the distribution of those sector allocations to individual installations.
3.2 The starting point for calculating allocations for installations will be to calculate each installation’s “relevant emissions” during the baseline period from 1998 to 2003.29
3.3 In most cases, an installation’s relevant emissions will be the average annual emissions for the years in the baseline period when the installation was in operation after excluding the lowest year’s emissions. In other words:
(a) for installations commencing operation30 in or before 1998, the average of the highest 5 years from 1998 to 2003;
(b) for installations commencing operation in 1999, the average of the highest 4 years from 1999 to 2003;
(c) for installations commencing operation in 2000, the average of the highest 3 years from 2000 to 2003;
(d) for installations commencing operation in 2001, the average of the highest 2 years from 2001 to 2003; and
(e) for installations commencing operation in 2002, the higher of 2002 and 2003.
3.4 The figures for “relevant emissions” of both the sector and each installation are then used to determine the share of the sector’s allowances that each installation will receive. The calculation of the total Phase 1 allocation for an individual installation can be expressed as:
Installation's relevant
emissions * Total sector allowance = Total Phase 1
Sum of relevant emissions allocation installation level
of all installations in the sector allocation
3.5 Where an installation is made up of a number of technically distinct units for which separate emissions data are available and some of those units
29 Following responses to consultation on the draft NAP, the UK is proposing to extend the baseline period until 2003. The approach set out in this section reflects the current proposed approach. A final decision will be made shortly after a brief period of further consultation 30 For this purpose, an installation is considered to have commenced operations when it begins to carry out the relevant Annex I activity.
24 commenced operations in 1999 or later, the UK has proposed to stakeholders that the installation’s relevant emissions may be calculated on a unit by unit basis. The UK is consulting on this proposal and will make a final decision shortly. This is best explained by an example. An installation consists of three units (A, B and C); Units A and B were in operation throughout the baseline period; Unit C (e.g. a new boiler or CHP plant, or a CHP scheme replacing an existing boiler) commenced operations in 2000. In this case, the installation’s relevant emissions would be the sum of the results of (i) applying paragraph 3.3(a) to the emissions from Units A & B and (ii) paragraph 3.3(c) to the emissions from Unit C. This can be represented graphically as follows:
Unit A B C 1998 1999 2000 2001 2002 2003 Apply (a) Apply (c) Installation's baseline is the sum of these
3.6 An allocation methodology based on historic emissions has been chosen to allocate at the installation level due to the complexity of projecting installation level emissions consistently and accurately across installations in all sectors. The use of an historic average provides some compensation to potentially stranded assets. Emissions data from 1998 onwards were chosen on the basis that they are more accurate, available and able to be verified than data from before that date. The exclusion of the lowest year’s emissions is intended to minimise the impact where an installation has had an anomalous year with unusually low emissions.
3.7 However, it has become clear during consultation on the draft NAP that there are three situations in which the general approach for calculating relevant emissions is not appropriate. The UK has not yet made a final decision and is consulting further on how to address these situations. The following represents the current proposed solution and a final decision will be made shortly after a brief period of further consultation:
(1) Commissioning
3.8 Firstly, installations which underwent commissioning during the baseline period will be disadvantaged if commissioning was carried out in more than one calendar year. For such installations, the UK is proposing that any emissions data relating to commissioning should be excluded from the calculation of relevant emissions i.e. the installation will only be treated as being in operation for the purpose of paragraph 3.3 above once commissioning has been completed. We are consulting further on sector-specific definitions of commissioning.
(2) Inter-site Rationalisation
3.9 Secondly, the general approach would have disadvantaged an installation (Installation X) to which the same operator has switched production from another installation (Installation Y) during the baseline period, where Installation Y has since closed and will not receive an allowance
allocation. The UK is proposing that, for the purpose of calculating the relevant emissions of Installation X, any emissions data relating to the period before the transfer of production took place should be excluded from the calculation i.e. Installation X will only be treated as being in operation for the purpose of paragraph 3.3 above after the transfer of production has taken place. This rule only applies where both installations manufacture transferable products31 and are operated by the same operator. For the purposes of this rule, production is deemed to be transferred only when there has been 100% cessation of operations at Installation Y and Installation Y has not been permitted for the purposes of the EU ETS (and thus will not receive an allowance allocation). Operators wishing to be treated in this way must apply for special treatment and will be required to provide supporting evidence (e.g. of ownership of the installations, of the transferability of the products in question and of complete cessation of production at Installation Y). This rule may apply to where production has been transferred to more than one EU ETS installation, provided that the above tests are satisfied. The Government will consider applications for special treatment under this rule on a case-by-case basis.
(3) Installations commencing operations in 2003
3.10 Thirdly, there are a small number of installations that commenced operations in 2003. These installations are considered existing installations for the purposes of the NAP, although they will have less than one full year’s historic data available. Given the wide variation in seasonal fluctuations in demand in the industries covered by the scheme, a simple pro-rata
adjustment to partial data would be likely to create an unfair advantage or disadvantage for the installation concerned. Therefore, the allocation for these installations will be calculated in line with the methodology to be used for new entrants (see Appendix C) and will be taken off the sector allocation before this is distributed to other existing installations.
3.11 Once the total allocation of allowances for each installation has been calculated for the entirety of the first phase, it will be divided into three equal parts and issued to the relevant operator by 28 February in each year of the Scheme, provided that the installation is considered to be operational and is not deemed to have ceased to carry out an Annex 1 activity. Where an installation is deemed to have ceased to carry out an Annex 1 activity, no further allocations will be issued in the years following cessation. Un-issued allowances arising in this way will be added to the new entrant reserve (see further Appendix C).
3.12 Installations which have commenced operations after 31 December 2003 will be allocated allowances from the new entrant reserve (see further Appendix C).
31 For the purpose of this proposed rule, the generation of electricity is not considered to be the manufacture of a transferable product.
26 3.13 The UK is submitting at Annex A a list of installations covered by the Directive. However, it has not been possible to produce a list of installation-level allocations at this time. The UK hopes to produce a revised list of installations with individual allocations by late July/early August 2004.
If historical emissions data were used, please state whether they have been determined in accordance with the Commission’s monitoring and reporting guidelines pursuant to Article 14 of the Directive or any other set of established guidelines, and/or whether they have been subject to independent verification.
3.14 Historical emissions data submitted for the development of the National Allocation Plan were collected and calculated in accordance with several established guidelines including the Commission's EU ETS Monitoring and Reporting Guidelines, the Guidelines for the Measurement and Reporting of Emissions by Direct Participants in the UK Emissions Trading Scheme, the Climate Change Agreement Guidance on Monitoring Data: Performance Data and Auditing for the First Milestone and some industry best practice protocols.
Basic checks indicate that these guidelines give rise to comparable emissions data when using emission factors for UK fuels.
3.15 The UK is currently developing a system for independently verifying historic emissions data to ensure that they have been appropriately collected and calculated and are free from material errors and misstatements. Much of the data collected for other schemes has already been verified and audited, so we envisage a less stringent verification than for annual monitoring and reporting. This verification process will start shortly with operators required to ensure that all data is verified before the final allocation decision is made. To promote good quality and consistent baseline data verifications, the verifiers will need to be accredited by the UK Accreditation Service in accordance with their updated CIS 5 Guidance for the Application of ISO/IEC Guide 65 Document.
If early action or clean technology were taken into account at this level, please state so here and give details in Sections 4.2 and/or 4.3 below.
3.16 On early action, see section 4.2 below and on clean technology see section 4.3 below.
If the Member State intends to include unilaterally installations carrying out activities listed in Annex I below the capacity limits referred to in that Annex, please explain why, and address, in particular, the effects on the internal market, potential distortions of competition and the environmental integrity of the scheme.
3.17 The UK does not propose to include unilaterally installations carrying out activities listed in Annex I below the capacity limits referred to in that Annex as provided for in Article 24 of the Directive.
If the Member State intends temporarily to exclude certain installations from the scheme until 31 December 2007 at the latest, please explain in detail how the requirements set out in Article 27(2)(a)-(c) of Directive 2003/87EC are fulfilled.
3.18 The UK is applying to exclude from the first phase of the Scheme some installations that are covered by the UK Emissions Trading Scheme, or by Climate Change Agreements. Separate applications are being made for installations covered by these domestic schemes, reflecting the differences in the two schemes. These applications for temporary exclusion are being submitted to the Commission alongside this National Allocation Plan to be considered by the Comitology Committee scheduled for June 2004. The applications detail the basis on which equivalence of environmental effect, monitoring, reporting and verification requirements and the penalties for non compliance can be demonstrated.
28 4. TECHNICAL ASPECTS
4.1 Potential, including technological potential
Has criterion (3) been used to determine only the total quantity of allowances, or also the distribution of allowances between activities covered by the
scheme?
Please describe the methodology (including major assumptions made) and any sources used to assess the potential of activities to reduce emissions. What are the results obtained? How is it ensured that the total quantity of allowances allocated is consistent with the potential?
Please explain the method or formula(e) used to determine the quantity of allowances to allocate at the total level and/or activity level taking the potential of activities to reduce emissions into account.
4.1.1 The potential of different sectors to achieve emissions reductions by using technologies which are cost-effective has already been reflected in the policies and measures set out in the UK Climate Change Programme. The UK Climate Change Programme is based on a number of principles, including taking a balanced approach, with all sectors and all parts of the UK playing their part, and focusing on flexible and cost effective policy options that work together to form an integrated package. The review of the Climate Change Programme which will take place during 2004 will take into account the potential of different sectors to achieve reductions.
4.1.2 The updated emissions projections which have been used as the basis for calculating the total quantity of allowances to be issued and the distribution of those allowances between sectors incorporate the current estimates of CO2 savings for each measure described in the Climate Change Programme. These projections reflect the costs faced by the different sectors in adopting alternative measures to reduce emissions. Please refer to paragraphs 1.7 to 1.9 for more details on UEP.
4.1.3 The Climate Change Agreements were designed with the feasibility of emissions reductions in each sector in mind. The CCA target review in 2004 is aimed at ensuring that the targets continue to reflect the potential for cost effective energy savings. Thus, the use of the CCA targets as the basis for calculating sectoral allocations means that feasibility and overall potential of sectors to reduce emissions is reflected in distribution of allowances at that level.
4.1.4 The decision to place the responsibility for achieving the remaining savings anticipated from emissions trading on the power generation sector reflects in part that sector’s potential for low-cost abatement opportunities. There will be possibilities for changing the relative utilisation of existing gas fired and coal fired power stations. For some years it has been clear that gas fired plant is the electricity generators' commercial preference for new
generating capacity. Over time, the continued introduction of new gas-fired plant and retirement of older coal fired plant, will help to reduce emissions. 4.1.5 As a result, the potential to reduce emissions has been taken into account in determining both the total quantity of allowances and the distribution of those allowances at the activity/sector level.
If benchmarking was used as a basis for determining the intended allocation to individual installations, please explain the type of benchmark used, and the formula(e) used to arrive at the intended allocation in relation to the
benchmark. What benchmark was chosen, and why is it considered to be the best estimate to incorporate achievable progress? Why is the output forecast used considered to be the most likely development?
4.1.6 The standardised allocation methodology being developed for new entrants and installations which commence operations in 2003 may
incorporate benchmarks (for details see paragraph 3.8 above and Appendix C).
4.2 Early action
If early action has been taken into account in the allocation to individual installations, please describe in which manner it is accommodated. Please list and explain in detail the measures that were accepted as early action and what the criteria accepting them were. Please demonstrate that the
investments/actions accommodated led to a reduction of covered emissions beyond what followed Community or national legislation in force at the time the action was taken.
.
4.2.1 Criterion (7) of Annex III of the Directive gives Member States discretion about whether or not to take early action into account. The UK considers that it is very difficult to identify instances of early action other than those undertaken either (a) in compliance with relevant legislation or other policies - which the Commission guidance states is not covered by the definition of early action – or (b) for economic reasons – for which there would appear to be little justification for additional reward. Therefore, the UK does not consider that it is appropriate to reward early action more specifically in the NAP.
4.2.2 However, the use of averaged emissions information from 1998 to 2003 to distribute allowances to individual installations (see Section 3 above) takes account of major decreases in later years, by incorporating higher emissions data from earlier years, thereby rewarding an operator who has taken significant early action during this period. It also avoids the penalty for earlier action which would result from using a single recent year (e.g. 2002 or 2003) or from basing allocations on forecasts of emissions. In addition, the proposed approach to plant closure during the baseline period set out in
30 paragraph 3.9 above will ensure that operators who have taken early action by rationalising production are not penalised.
4.3 Clean technology
How has clean technology, including energy efficient technologies, been taken into account in the allocation process? If at all, which clean technology has been taken into account, and on what basis does it qualify as such? Have any energy production technologies intended to be taken into account been in receipt of approved State aid for environmental protection in any Member State? Please state whether any other industrial technologies intended to be taken into account constitute “best available techniques” as defined in Council Directive 96/61EC, and explain in what way it is particularly performing in limiting emissions of covered greenhouse gases.
4.3.1 The UK considers that one of the principal effects of establishing the EU ETS will be to provide an incentive for clean, energy efficient technologies by putting a price on emissions of carbon. Therefore, the UK has not considered it necessary to take any express steps to take account of clean technologies in the allocation process to existing installations.
4.3.2 However, the use of benchmarks to allocate to new entrants , where possible, will encourage investment in clean technology and energy efficiency. 4.3.3 Equally, the establishment and operation of the ring-fenced reserve of free allowances for investment in new Good Quality Combined Heat and Power (CHP) installations ensures the incentive for new investment in this type of clean technology is secured. The size of the CHP set-a-side will be based on the UK’s assessment in the UEP of the likely new Good Quality CHP installations coming on line during phase one of the EU Emissions Trading Scheme.
5. COMMUNITY LEGISLATION AND POLICY
5.1 Pooling (Competition policy)
If the competent authority has received an application from operators wishing to form a pool and if it is intended to allow it, please attach a copy of that application to the National Allocation Plan. What percentage of the total allocation will the pool represent? What percentage of the relevant sector’s allocation will the pool represent?
5.1.1 The UK’s general position is that the establishment of pools of installations as provided for under Article 28 of the Directive is unnecessary and may hinder the development of a transparent and liquid market in allowances.
5.1.2 However, the UK does consider that operators of smaller installations (specifically those carrying out combustion activities that fall within the scope of the EU ETS due to the requirement to aggregate several activities which fall within the same heading in Annex I of the Directive if they are carried out by the same operator on the same site) should be offered the opportunity to apply to form a pool. This would allow these operators of “smaller installations” to coordinate the carrying out of the administrative tasks associated with trading. The UK implementing regulations therefore permit operators of installations which are carrying out activities which do not fall within the scope of Annex I of the IPPC Directive to make a joint application to the appropriate authority to form a pool32. In practice therefore, the ability to form a pool is limited to operators of combustion installations with a rated thermal input of less than 50MW.
5.1.3 Since pooling will only be available to smaller operators with relatively low levels of emissions, the UK does not consider that pooling as provided for in the UK transposing legislation will raise any competition issues. However, the UK will of course submit any pooling application received to the Commission in accordance with Article 28(5).33
5.2 Treatment of new entrants (Internal Market Policy)
5.2.1 The UK has decided to set aside a quantity of allowances to be distributed for free to installations that commence operation after 31 December 2003 but before the end of 2007 and that are eligible as new entrants for a free allocation of allowances from the New Entrant Reserve (NER). The total size of this reserve will be 56.8m allowances (roughly 7.7% of the total allowances to be issued).
32 Regulation 21 of the Greenhouse Gas Emissions Trading Scheme Regulations 2003 (SI 2003/3311).

![Sub vastus approach versus the medial parapatellar approach in primary total knee: a randomised controlled trial [ISRCTN44544446]](data:image/gif;base64,R0lGODlhAQABAIAAAP///wAAACH5BAEAAAAALAAAAAABAAEAAAICRAEAOw==)