Basic dissociation constant for ethylamine by a convenient
conductance method1
$vo
VAN DERLINDC', D. NORTHCOTT,
&I/. ~ ~ B E D L I O N D ~ , A X DR.
E.
ROBERTSOX
Division of Pure C/lernistry, National Research Council of Canada, Ottawa, Canada Received April 24, 1968
A dilution technique is described which pernlits a deternlination of the ionization constant of amines by
a conductance method, in a closed system. Small alnounts (5-6 g) of the aiiiinc salt arc required, making the n~ethod useful in studying isotope effects. Values of Xi for ethylamine eyer the temperature range
1.5-45.3 ' C led to calculated values at 25 -(3 of AG = 4528.3 0.8 callmole, AH = -266 i 12 cal;' mole, A S = - 14.05 _+ 0.04 ca1:'mole deg, AC, = - 62.2
k
1.8 cal 'mole deg.Canadian Journal of Chemistry, 47. 279 (1969)
Problems arising in connection with the inter-
pretation of certain deuterium isotope effects
(1-3)
created the need of a method for deter-
mining the ionization constant for weak electro-
lytes which m-as a t once capable of the required
accuracy and economical with respect to quan-
titative requiremeilts of deuterated materials.
The system developed to meet these requirements
is
described here and its capabilities are illustrated
by a study of the temperature depe~idence
of the
basic dissociatio~i constailt of ethylamine over
the range
1.5-45 "C.
The choice of this amine
was determined in part by its utility in isotopic
studies and partially by the fact that n o such
careful study had been made previously.
In the initial stages of the work
(4),
attempts
were rnade to achieve the above goals by com-
bining a precision syringe
(5)
with a mixing
chamber and the double conductaiice cell of
Tves and Pryor 461, calculation of
A,
and
Ki
bbeing
made from a single set of concentration-resis-
tance data according to the extrapoiation method
of Isles ('3). This system proved adequate for the
determination of
KbH/K," (4)
but failed to give
that degree of reproducibility
and
accuracy
required for defining the temperature coeficients
of the equilibrium. Minor modifications of the
system did n o t g i v e the required improvement
(8).
Part of the difficulty may be attributed to the
use of the extrapolatioli method for determining
Kb since the value lies in the borderline region
-
-'Issued as NRCC No. 10 342.
2Postdoctoral Fellow. 1961-63. Present address: E. I. Dupont de hTeniours, Marshall Laboratories, I'hiladel- phia, Pa.
3Postdoctoral Fellow, 1965-67. Present address: Abi- tibi Paper Co., Research and Development Center, Sheridan Park, Ontario.
where this method becomes unreliable (9-1
1).
In
this insta~lce, errors of about
I"/';
bet~veen suc-
cessive runs were found. Kilpatrick
(11)
in a
detailed ariaiysis of the factors contributing to
error in the use of the extrapolation method in
calculating the ionization constant of weak acids
seems l o suggest a lower lilllit of
Xi
=lo-',
hence the sources of the above error may not
have been due entirely to the method of calcula-
tion. This questioil was not explored since im-
portant changes in the design of the sell were
introdiiced coilcurrently with a change to the
additive method of calculating
A,.
Fortunately,
the system provides a convenient experimental
approach for determining the required value of
A,
for the ethyl arnoni~im
chloride with a mini-
m u m - of labor.
Experimental
The main features of the conductance ccll will be apparent from Pig. I. This consists of a mixing chamber bearing a fine inlet joined to the precision syringe, and two opposed conductance cells. Stirring and circulation of the stirred solution through the cells is acconiplisl~ed with a glass-enclosed magnet at the bottom of the central shaft bearing stirrers and impeller blades, This is set in a franle above a rotating magnet fixed centrally belou the cell. The essential feature of the cells uould appear to be the constriction of the central portion such that the platinum electrodes in the foreshortened dumb-bell shaped cell were much larger than the connecting tube. Such an arrangement was found to be essentially fre- quency independent (500-10 000 Hz) when used in an oil bath. Grounding the unused cell tIi~.ougl? the bridge ground when making a measurement eliminated a source of interference. It is recognized that this design merely represented a return to the inherent feature of the clas- sical dumb-bell shape of the Kohlrausch cell, which had been omitted in the Ives-Pryor design (6). The attach- ment of the electrodes was accomplished by mounting on glass studs and electrical connection established by sealing on a very thin platinum sheet (0.0005 in.), through
Can. J. Chem. Downloaded from cdnsciencepub.com by 134.122.89.123 on 01/15/21
280 CANADIAN JOURNAL O F CHEMISTRY. \'OL. 47, 1969 a pinched joint terminating by electrowelding to a copper
wire. This was welded in t i ~ r n to a tungsten terminal, the latter being topped with a nickel sleeve. The glass arms bearing the terminals were placed under vacuum, hence any leakage past the platinuln pinch-joint was readily detected.
FIG. 1. Double conductance cell with mixing cham- bcr.
One of the problems, indeed one of the major sources of error inherent in the conductance method is the prop- erty of glass \i~alls ro absorb ions from thc solution. This will be most apparent in dilute solutions. Where there is no restriction o n the amount of solution, repeated flushing will bring the walls into equilibrium with the s o l ~ ~ t i o n but this possibility \\as inadmissible here. T o minimize hall effects pretreatment of the cells was care- fully standardized between runs. This consisted of leaving the cell stand with the solution of the anline over- night, rinsing and throughly steaniing out for 10 inin followed by pumping to dryness and filling uith purified nitrogen. At this stage the cell was weighed to ! n ~ g on a balance sensitive to 0.5 mg/l kg load, and filled to a point above the sidearms with distilled water under a positive pressure of purified nitrogen, in order to prevent the entrance of CO,. Unless the water had a nominal value of 5 x ohm-' cnl-' (1QCC), experience shohed that useful results could not be obtained.
Using the same procedures, values of the cell constant for the "'hypothetical" cell (i.e. the difference of the two measured cells) were found to be 0.27905 i 0.042 for four determinations and after 8 weeks 0.27906 0.Q43 o n two determinations (12).
?We are grateful for the skilled workmanship and practical advice available to us through our glass-blower, Mr. Sack van den HolY.
The titrimeter was a more compact form of an earlier model previously described and a a s capable of delivering up to 10 ml in small increments, with high accurancy (5).
KC1
Analytical grade KC1 was recrystallized froin conduc- tivity nater tmice and fused in a platinum boat in a n electric furnace (1 3).
Na Cl
WaCl (analytical grade) was precipitated from a saturated solution in conductivity hater by bubbling in HCI, and the resulting crystals were filtered off, dried in a n electric oven, and f ~ ~ s e d as above.
Ethj'lcrmmoniurri Chloride
The amine-hydrochloride was prepared by bubbling dry HCl gas through an ethereal solution of the pure arnine and filtering under dry nitrogen. Recrystallization from dry n-butanol and drying under vacuum gave a white fluffy crystalline hydrochloride. This was kept in a desiccator and either used directly (A,) or as a source of amine (K,). To get anline solutions (0.2 molar) the requisite amount of hydrochloride and KOH were added to a reaction vessel on a vacuum-line and the system repeatedly evacuated and flushed with dry, purified nitrogen. The addition of cond~~ctivity water to the reaction cell led to the regeneration of the anline which was swept into a trap cooled with liquid N2. The anline
was distilled from bulb-to-bulb, the middle fraction being stored for use. The purity was checked by mass spectral analysis and sho~ved no significant amounts of other anlines. The a ~ n i n c solution was made up in a special flask (Fig. 2b) containing 125ccconductivity water, and the flask was thoroughly degassed. The required ap~roximate anlount of amine was transferred to the flask, air being excluded at all times. Transfer of the anline solution from the make-up flask to the titriineter -and guard-bubblers is done after flushing the system repeatedly with N, through loosely clamped joints during the successive filling of the b ~ ~ b b l e r s C , B, and the reser-
voir A (Fig. 20). The concentration of the anline was determined by titration from the precision titrimeter against standard HCl solution using a glass electrode and p H ineter to detect the end point.
FIG. 2. Titrimeter filling train.
Can. J. Chem. Downloaded from cdnsciencepub.com by 134.122.89.123 on 01/15/21
VAN DER LINDE ET AL.: BASIC DISSOCIATION C O N S T A ~ T 281 Conductance water was obtained from a still of the
Stuart-Vi7ormwell type, (14), the initial distillation being from KOH/KMnO, (3-4 g each in 5 1); the output being condensed into the final still where distillation takes place from NaHS04 (0.1 g,'3 1). The vapors from the latter pass through a n all-glass spray-suppressor of the same general design as in the original systenl whence partial condensation takes place in a stream of purified nitrogen o n a silica condenser. Water was discarded until a nominal \-alue of specific conductance of less than 5 x 1Q8 cnl-' at 10 -C \\.as established as deter- mined by a cell forming part of the collection system. It was found that this val~ie could bc maintained by storage overnight in a polypropylene container, an integral part of the closed system.
In order to eliminate the error5 introduced through the simultaneous determination of A, and of K, (LO, 11), a preliminary determination of the
A,
values for ethylam- moniulii chloride was made over the experimental range of interest. While the reproducibility of A, by our methodfalls short of \%hat can be obtained by the most careful workers (12). the minor variations in
A,
mere not judged inlportant for our purpose. The inherent convenience of being able to deternline A c for 20-30 difl'erent concen- trations in a closed system in 1-2 h is self-evident.Conductance-concentration data for determination of A, and Kb were obtained by adding increments of the stock solution of the salt, in this case C,H,NH,Cl (for A,) or of the arnine C2H,NH2 from the titrimeter into a weighed amount of conductance water in the cell. The cu~~lulated concentration of solute in the cell for each incremental addition could be calculated using the eauation
lvs
= -~ n o l .
wt.
where
f = titrimeter factor in m1/1000 counts,
d, = density of titrant solution,
do = density of conductivity %ater,
,440 = concentration of titrant in moIes/l, N", = weight of conductivity water originally in
cell,
c = number of counts o n the titrimeter, 144, = concentration of substrate in moles/l in
the conductivity cell, and mol. wt. = molecular weight of solute.
It will be apparent that in such a system precautions will have to be taken to ~ninimize zero-point errors and the effects of unavoidable diff~~sion from the titrimeter capillary. The first was reduced by carefully calibrating the "syringe-units" required to fill the deli\-ery tip from an arbitrary calibration line on the delibcry capillary leading to the cell. This could be further correctcd by adding small increments, noting the incre~nental changes in resistance and extrapolating back t o "zero-reading". Either method was adequate under optimum conditions, the correction method being preferred mhen there was
SProfessor J. M. W. Scott of Memorial University, St. John's, first drew this possibility to our attention.
some doubt about the reading at the calibration line. At higher temperatures and with volatile ainines, only the calibration method was useful. Diffusion bemeen points could be effectively eliminated by "backing-off" a few counts after each addition, thus filling the fine tip of the capillary with the same solution as in the bulk. Such precautions as alloming for steady resistance reading before further additions are obvious. In practice this occurred in less than I min.
Ter?iperutuie Corztiol
Temperature control of about 0.001 -C was a c h i e ~ e d by s~irrcunding a snlall stirred oil bath by a large grounded water bath of conventional design and control to 0.002 "C.
Coizrl~rc~rice Bridge
A Dekatron, D272A decade transfornler with a norruinal accuracy of 0.5 p.p.m. provided the measuring arm of a bridge against standard resistances of known values and capacitances. The frequency source was a CR.1311-A Audio oscillator with a CR.1231-P5 filter. The detector system was a CR.1232-A t~lned anlplifier and null detcctor, the final balance being determined on an oscilloscope.
A,
ofNaC1 and KC1As a test of tlie system,
A,
for NaCl and KC1 mas determined by loading the syringe mith the respcctive solutions (0.2 M ) and determining concentration-resis- tance relationships at 25 "C for two series o n two succes- sive days for NaCl and over a mider period for KCI. The individual A, values mere found for NaC1 from a LklS fit to the Onsager equation [2]where
R,
andR,
are the measured resistance at conccn- trations Ci andC,.
A is the limiting A / c slope, K , is tliecell constant, and
A,
is the intercept.A modification is included to correct for any errors in zeroing tlic titrimeter, possible adsorption at the walls of the cell at lowest concentrations (the assu~llption being the major part of such adsorption in so far as it exists, uill be established quickly), and as a check o n the water correction. Thus
A,
was calculated first setting Co = 0.0 and taking the resistance of watcr asR,,
then the calcula- tion was repeated using low initial readings of C and R in eq. [2]. The values of A, so determined mere usually within experimental error of tlie original value but if an error from the above sources was present it biould be detected by a change in A,. An illustration of the opera- tion of this procedure is given in Table I.Values of A, so determined For NaCl Mere 126.57, 126.29,126.47, and 126.89givingan average value of 126.57
+
0.17. Shedlo\-sky (15) gives a value of 126.45 later confirmed by Benson and Gordon (16). The experimen- tal error in the above method is somewhat larger but there is the co~upensation of economy in time, 2 h beingCan. J. Chem. Downloaded from cdnsciencepub.com by 134.122.89.123 on 01/15/21
CANADIAh- JOURNAL O F
TABLE 1 Data to illustrate zero point
correction Concentration
CiIOCO* (mole/l) !lo<-
CHEMISTRY. VOL. 47, 1969
the corresponding values of A ,
B,
C, and A O z 5 are ob- tained and are given in Table III (17).TABLE III
Constants for temperature dependence of A. - -- - -
- - - - -AOz5
A
B x l o Zc x
lo4 CI - 76.35 1.54037 0.465 -0.1285 OH- 199.18 3.3604 0.306 -0.4828suiricient to determine A, after temperature equilibrium is established.
The values of
A,
for KC1 were found over a period of 3 snonths to be 149.94, 149.88, 149.72, and 150.23 g i ~ i n g an average calue of 149.94r
0.12 compared to the litera- ture value of 149.93 (149.87-349.98 depending on the author (12)).Deteiii~iriaiion of A, for Erlzy/nnztnonirit?~ Chiaviile
Folloning the procedures outlined above, the resis- tance of 30 solutions of increasing cthylammoniiin-i chio- ride concei-itration rvere determined. The value of A, calciilated as abovc from the data in Table 91 at 75.005
"C
is 245.6 \%it11 a standard deliation of 0.076%. This is typical of \\hat \\as obtained through the scrics thougb we d o not believe that it represents the ultimate preci- sion inherent in thc method. Corresponding values for other temperatures are recorded in Table HV.The corresponding values o f A, for ethylanxnoniunl hydroxide can be determined for each teinperature for which Kb is to be determined. The resulting A, values
were fitted to a A, VS.
(e
- 25) relationship of the con- ventional form to give the equations: A,-temperature relation for ethyiammonium hydrochioride, [5]. andA,-
remperaturc relation for ethylammonium hydroxide [6].
Detrriiih~atioi~ o f K b
After the necessary values of A, for ethylamnloniurn chloride \\ere obtained. the syringe was loaded with an arniiie ' i o l ~ . ~ t i ~ i ~ taking particular precaution to exclude
C o p , and a new series of concentration-resistance
readings determined. Tllc:~ data mere then fitted to the Shediovsky-Kay equalior :L9j,
TABLE I1
Concentration-equident conductance data* for ethylanimoniuin chloride at 25.005 "C
Conductance Conccntratlon (moles l x l W 3 ) O b s e r ~ e d i Cacnlated - -- - -- - - - - -0 13944 121 51 121 28 0 21747 120 90 120 91 0 29522 120 54 120 61
*These data represent about 4 of the actual data
ILeft hand side of eq. 121.
By applying the Kohlrausch equation
[3]
AoRcNH,+OH-
= AoRoNH3+CI-+
-AOc1-
and determining the balues of A,,,- and
A,,,
- from the equation uhere -2S ( z )
=1
+
2+
6
4- ~0~2
and andA linear least squares analysis of these datagives astraight line, the slope of which is l/Ki A,' and the intercept 1/A,,
the value of A, being that detersiiined in the previous experiments. Values of Kb so determined for a series of
teinperatures are given in Table V.
Values of the corresponding acid dissociation con- stant (K,,,) for the dissociation
Can. J. Chem. Downloaded from cdnsciencepub.com by 134.122.89.123 on 01/15/21
VAN DER LIh7DE ET AL.: BASIC DISSOCIATION CONSTANT
283
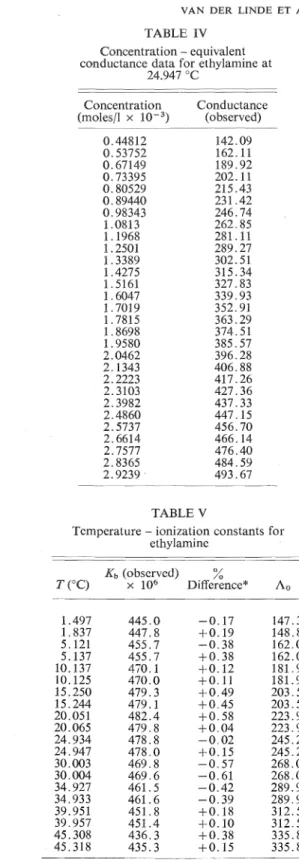
TABLE IV Concentration - equivalent conductance data for ethylamine at
24.947 ' C - pp - - - -- -- - Concentratlon Conductance (moles/l x (observed) - - TABLE V
Temperature - ionization constants for ethylamine
K, (observed)
%
T (T) x lo6 Difference" A,
"{IK, (observed) - K, (calculated)llKb (observed)}
x 100.
can be readily calculated from the relation Kb = My,/&,.
A series of values of - log Kbh using values of
M,
deter- mined by Harned and Robinson (20) are g i ~ e n in Table VE.TABLE VH
Summary of dissociation constants for ethylamine 61, and eti~ylamn~oniuln ion
Kbh from 0 to 40 ' C
7-
(cc)
- log K, - log&,,
The data in Table VH permit the temperature depen-
dence of the ionization constant Kb for the equilibrium
to be fitted to a n equation of the type
using the method of Clarke and Glew (21). The accuracy of these data marrant fit to 3 terms only, i.e. eq~iivaleni to setting dAC,/dT = 0 , contrary to reasonable theo- retical expectations. The tlieriilodynamic constants for a series of teluperatures together with standard errors are given in Table VII for a series of temperatures. Values of
Kb at intermediate temperatures can be interpolated from
the equation
[8]
log
K,
= 87.52367 -3994.44417-
-
3 1.29822 log
T
with an error comparable to those given in Table
VI
provided sufficiently accurate log-tables are used.
Discussion
In Table VIII values of Kb obtained in this work
are compared w ~ t h
those of previous workers.
Everett and Wynne-Jones have commented that
potentlometric methods tend to be low. However,
their suggestion that conductivity methods may
yield correspondingly high results because of the
fallure t o extrapolate to infinite dilution does not
apply here.
The calculated standard error
is
given below
each constant and illustrates the change
in
error
across the experimental temperature range, or
alternately the inadequacy of the three constant
equation.
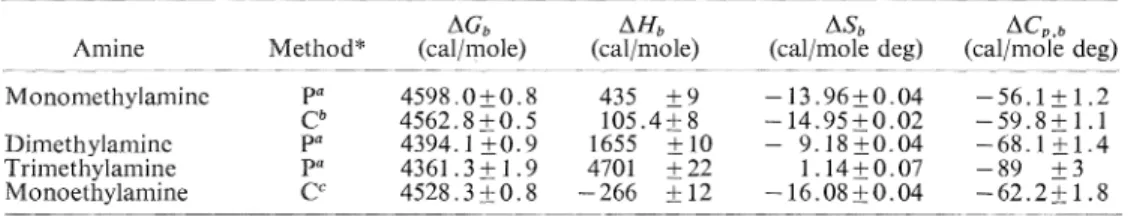
A better indication of the capability of the
system may be made by a comparison of the
Can. J. Chem. Downloaded from cdnsciencepub.com by 134.122.89.123 on 01/15/21
CANADIAP. JOLRPIAL O F CHEMISTRY. VOL. 47, 1969
TABLE VTI
Thermodynamic constants for the baslc d~ssociatlon of ethylamme
- -- - - -- - -- -
--PAP- - - - --
T AG A H AS ACP
(^C) (cal/n~ole) (cal,n~ole) (cal,'n~ole deg) (cal/mole deg)
"Concentration units: moles!l; 1 cal = 4.185joules.
TABLE VIII
treating the data of Everett and Wyn~le-Jones
A
comparison of K , vali~es for ethyla~nine(25)
by the same analysis (Table
IX).
There it is
- - --- - - - -- - - - ----
seen that the ~ndeterminacy in the values is
K~ x l o 4
ap~roxlmately the s'ime. It may also be noted
Tempe1 ature( C) This ~ l o r k L ~ t c ~ a t u r e Reference
that the d~fferellce
between the values for mono-
-- - - - -- - -methylamlne and monoethylamine are not very
0 4 40, 4 29 22
20 4 80 A 32 23
d~ffereilt,
in clgreement wrth normal
expectations. 25 4 78 4 72 24Slnce it is the ~tltellt
of thls paper to ~ilustrate
the
4 65 22
experimental potelltial and coilvenlence of our
40 4 51 4 19
--- 23
conductance system for determ~ning
A,
and K,,
no cornmeni w111 be made at this t ~ m e
on the pos-
elrols
1x1the derlved constants glven in Table
slble theoret~cai ~mpl~catioils
of the results
V11
with the corresponcliilg values obtained
by
reported.
TABLE IX
A comparison of errors in derived constants at 25 -C from the temperature dependence of
K i
dcterrnined by conductance and potentiometric methodsA(% AH,
Ash
ACo,bAnline M e t h o d ' ~ c a l / m o l e ) (cal;mole) (cal/'i~~ole deg) (ca1,'mole deg)
*P = potentiometric, C = conductance. "Reference 24.
*Refcrencc 25. CThis work.
1. K. T. LEFFEK; K . E. ROBERTSON, and S. E. SUGAMORI. 5. S. MARTIX, R. E. ROBERTSON, and G. C. BENSOU. J. Cliem. Ind. London, 259 (1961). Sci. Instr. 41,237 (1964).
2. k. HAKKA; A. QUEEN, and R. E. ROBERTSOU. J. 6. D. J. 6 . IVES and J. El. PRYOR. J. Ghem. Soc. 2104 Am. Cheln. Soc. 87, 161 (1965). (1955).
3. M. WOLFSBERG and M . J. STERK, Symposiun~ on 7. D. .I. G. IVES. 3. Chern. Soc. 731 (1933).
isotope mass effects in chemistry and biology. Butter- 8. I. Ross and R. E. ROBERTSON. Unpublished results. worths, London. 1964. p. 325. 9. T. SHEDLOVSKY. J. Franklin Inst. 225, 739 (1938). 4. W. VAN D E R LISDF. and R. E. ROBERTSOX. J. Am. 10. 1). BELCMER. J . Am. Chem. Soc. 60, 2744 (1938).
Chem. Soc. 86,4505 (1964). 11. M . L. KILPATRICK. J. Chem. Phys. 8, 306 (1940).
Can. J. Chem. Downloaded from cdnsciencepub.com by 134.122.89.123 on 01/15/21
VAN DER LIKDE ET AL.: BASIC DISSOCIATION CONSTANT 285 12. 3. E. LIND, JR., S . 9. ZWOLEKIK, and R. M. Fcoss. 19. T. SHEDLOVSKY and R. L. KAY. J. Phys. Chem. 60,
3. Am. Chem. Soc. 81, 1557 (1959). 151 (1956).
13. T. SHEDLOVSKY. J. Arn. Chem. Soc. 54,1411 (1932). 20. E. C. W. CLARKE and D. N. GLEW. Trans. Faraday 14. 9. M. STUART and F. WORMWELL. J. Chern. Soc. 85 Soc. 62$539 (1966).
(1930). 21. W'. C. SOMMERVILLE. J. Phys Che~n. 35, 2412
15. T. SHEDLOVSKY, A. S. BROWK, and D. A. MCINNES. (1931).
Trans. E.lectrochem. Soc. 66, 165 (1934). 22. A. G. EVANS and S. D. HAMANN. Trans. Faraday 16. G . C. B~ns0.u and A. R. GORDON.
J. Chern. Phys.
Soc. 47,25 (1951).13,473 (1945). 23.
M.
F. HALL and M. R. SPRINKLE. J. Am. Chem. 17. H. S. HARNED and B. B. OWEN. The physical Soc. 54,3469 (1932).chemistry of electrolytic solutions. 3rd ed. Reinhold 24. D.
H.
EVERETT and W. F. K. WYNNE-JONES. Proc. Publishing Co., New York. p. 233. Roy. Soc. London, Ser. A, 177,499 (1941).18. K. N. MARSH and R. H. STOKES. Australian J. 25. D. NORTHCOTT. Unpublishedresults. Chem. 17,740 (1964).