INTRODUCTION
Vildagliptin [(S)-1-[N-(3-hydroxy-1-adamantyl) glycyl] pyrrolidine-2-carbonitrile VLD; (Figure 1a)] is a potent
Development of a rapid reversed phase-high performance liquid
chromatography method for simultaneous determination of
metformin and vildagliptin in formulation and human plasma
Mahesh Attimarad
1*, Sree Harsha Nagaraja
1, Bandar E. Aldhubaib
1,
Ahmed Al-Najjar
21Department of Pharmaceutical Sciences, College of Clinical Pharmacy, King Faisal University, Al-Ahsa, Kingdom of Saudi Arabia, 2Department of Chemistry, College of Science, King Faisal University, Al-Ahsa,
Kingdom of Saudi Arabia
ABSTRACT
Objective: The objective of the proposed method was to develop a simple, fast, sensitive, and validated high-performance liquid chromatography (HPLC) method for the simultaneous estimation of metformin and vildagliptin in tablets and human plasma. Materials and Methods: The chromatographic separation was accomplished with a fast monolithic column using a mixture of sodium dihydrogen phosphate and sodium dodecyl sulfate and acetonitrile at pH 4.5 as the mobile phase. In addition, newly developed method was validated as indicated by International Conference on Harmonization guidelines. Results: The method showed good correlation coeffi cients (r≥ 0.997) in the range of 0.05-20 μg/mL and 0.1-40 μg/mL for metformin and vildagliptin, respectively. The accuracy and intraday and interday precision results were within the acceptable range for both analytes. The mean extraction recoveries of metformin and vildagliptin from human plasma were 97.51% and 97.18%, respectively. Conclusion: The simple, rapid, sensitive, robust and validated analytical method developed was used for simultaneous estimation of metformin and vildagliptin in formulation and in patient plasma.
Key words: Formulation, high-performance liquid chromatography, metformin, plasma, simultaneous determination, validation, vildagliptin
oral antidiabetic agent, which acts by inhibiting dipeptidyl peptidase-4 and increasing levels of active peptide hormones, such as glucagon like peptide-I and glucose dependent insulinotropic peptide1 in patients with
type 2 diabetes, while also increasing glycemic control.1-4
Metformin HCl [N,N-dimethylimidodicarbonimidic diamide hydrochloride, (MET) (Figure 1b)] is frequently used as standard fi rst-line pharmacotherapy to treat diabetes in patients whose condition is uncontrolled by diet and who fail to respond to therapy with sulfonylurea.5,6
*Address for correspondence:
Dr. Mahesh Attimarad, Department of Pharmaceutical Sciences, College of Clinical Pharmacy, P.O. 400, Al-Ahsa - 31982, Kingdom of Saudi Arabia. Mobile: 00966550118492, E-mail: [email protected]
Access this article online Journal Sponsor
Website:
www.jyoungpharm.org
DOI:
Combination of VLD and MET provides a superior HbA1c-lowering effect with a comparable overall tolerability profi le and low risk of hypoglycemia.7,8 On the
other hand, analysis of these drugs in plasma is equally important to determine the pharmacokinetics at various stages of formulation development, and in clinical, bio equivalence, and drug-monitoring studies.
A sur vey of the literature revealed some high-performance liquid chromatography (HPLC) and liquid chromatography-tandem mass spectrometry methods for estimation of MET alone9-15 and in combination with
other drugs. Few analytical methods are documented in the literature for determination of VLD in solid dosage forms16,17 or in plasma.18,19 Recently, three HPLC methods
were illustrated for the simultaneous determination of VLD and MET in formulations.20-22 However, existing
methods suffer from a number of disadvantages, such as low sensitivity, and internal standards have not been used to date. Hence, the current study focused on the development of fast, sensitive, and high-throughput analysis using an HPLC method for simultaneous estimation of MET and VLD in formulations and human plasma. To the best of our knowledge, the anticipated method is the fi rst to allow simultaneous determination of MET and VLD in plasma.
MATERIALS AND METHODS
Equipment and chemicals
A prominence HPLC system (Shimadzu, Kyoto, Japan) used for the analysis. Active ingredients were separated on a Chromolith® C
18 reverse-phase (RP) monolithic column
(5 μm, 50 mm × 4.6 mm i.d., Merck Millipore, Germany). Pure samples of MET (99.80%), dorzolamide (DOR;
99.10%), and lornoxicam (LOX; 98.80%) (Figures 1c and d) and VLD (98.7%) were purchased from Biokemix, India. Sodium dihydrogen phosphate, sodium dodecyl sulfate (SDS), HPLC-grade acetonitrile, and phosphoric acid were obtained from Sigma Aldrich, Germany. Multicomponent tablets (MET 500 mg and VLD 50 mg) were purchased from a pharmacy.
Chromatographic conditions
Separation of analytes was achieved with a mobile phase consisting of acetonitrile-sodium dihydrogen phosphate (10 mM) and SDS (10 mM) (30/70, v/v) with pH 4.5 ± 0.2. The elution was isocratic with a fl ow rate of 2.5 mL/min. The volume of sample injected was 50 μL. The analytes were detected spectrophotometrically at 208 nm and column temperature was set at 30°C.
Preparation of stock solutions and working solutions
Primary stock solutions of MET, VLD, LOX, and DOR were prepared by exactly weighing 25 mg of each pure substance and dissolving it in water/acetonitrile (1:1, v/v) in a volumetric fl ask (25 mL) to give 1.0 mg/mL solution.
Analysis of pharmaceutical formulation
After being accurately weighed, ten tablets were squashed to a fi ne powder and the powder corresponding to 20.0 mg of MET and 2.0 mg of VLD was transferred into a conical fl ask and extracted with 30 mL of water/acetonitrile (1:1, v/v). The extraction was repeated, and the combined extracts were fi ltered through a fi lter paper into a 100 mL volumetric fl ask. After washing the conical fl ask and fi lter paper with a mixture of water and acetonitrile, the volume was made up to 100 mL.
Analysis of drugs in human plasma
Calibration standard solutions were prepared with concentrations of 0.1, 0.5, 1.0, 2.0, and 4.0 μg/mL for MET and VLD. The solutions were prepared by adding correct volumes of standard solutions of MET and VLD to blood samples that were drawn from healthy drug-free human volunteers. A constant concentration of 2.0 μg/mL of DOR was used as an internal standard. After centrifuging the spiked samples for 5 min at 6000 rpm, 200 μL of supernatant plasma was mixed with 400 μL of acetonitrile in an eppendorf tube to precipitate the protein. The combined solution was vortex-mixed for 1 min (Stuart Scientifi c, UK) and centrifuged for 10 min at 9000 g (Eppendorf Centrifuge 5415D, USA). The clear
Figure 1: Structure of vildagliptin (a), metformin (b), lornoxicam (c) and dorzolamide (d)
d c
supernatant was collected and concentrated by heating at 45°C under a nitrogen stream. Dried samples were dissolved in the mobile phase to get analysis samples in the working concentration range. Aliquots of 50 μL were used for injections into the HPLC system.
Blood sample has been collected from the KFU Health center where the patient had declared the intake of MET (500 mg) and VLD (50 mg) tablet. After adding IS the sample has been centrifuged for 10 min and supernatant plasma was separated and stored at −20°C until further study. Authentic sample has been analyzed using the procedure described above.
Validation of the proposed method
The newly developed method was validated in terms of linearity, limits of quantitation, recovery studies, specifi city, accuracy and precision, robustness and stability studies according to International Conference on Harmonization (ICH) guidance.23
Linearity
Primary stock solutions of both analytes were serially diluted with mobile phase to give six calibration standard solutions in the concentration range of 0.05-20 μg/mL for MET and 0.1-40 μg/mL for VLD. LOX (0.5 μg/mL) was added to all the solutions as internal standard and Aliquot of 50 μl (in triplicate) were injected into the HPLC system.
Limit of detection (LOD) and limit of quantitation (LOQ) The LOD and LOQ from pharmaceutical formulation and spiked human plasma were computed as 3.3 σ/s and 10 σ/s, respectively, where σ is the standard deviation of the ratios of peak areas and s is the slope of the calibration curve.
Recovery studies
Recovery studies were performed at three different levels (50, 100, and 150%) by adding a standard drug to the preanalyzed formulation samples (5 μg/mL MET and 0.5 μg of VLD) and drug-spiked human plasma (1 μg/mL). The overall concentration was verifi ed using the proposed method, and all three levels were examined in six replicates. To calculate the percent recovery of the added pure drugs, the following equation was adopted:
Recovery (%) = [(At − As)/Aa] × 100
Where At is the overall concentration of drug, As is the concentration of the drug in the pre-analyzed sample, and Aa is the concentration of drug added to the pre-analyzed sample.
Accuracy and precision
System precision and method precision
A freshly prepared solution containing 10 μg/mL of MET and 1 μg/mL of VLD from the same standard solutions was analyzed with six replicates for the determination of system precision. The system precision was articulated as percent of relative standard deviation (%RSD) of the measurements. The six freshly prepared independent solutions of MET and VLD were also injected for evaluation of method precision, and %RSD was used to express variation in the measurements.
Accuracy and intermediate precision
Intermediate precision and accuracy were evaluated at low, medium, and high concentrations 0.05, 10, 20 μg/mL of MET and 0.1, 20, 40 μg/mL of VLD and in human plasma spiked with a sample at low, medium, and high concentrations (0.1, 2, 4 μg/mL of MET and VLD) covering a specifi ed range. All experiments were performed in triplicate. Intermediate precision was performed as intraday and interday precision. Standard solutions were analyzed in triplicate on 1 day in the same laboratory to determine the intraday precision, which was expressed as %RSD of the peak area ratios. Interday precision was evaluated by determining the %RSD for standard solutions analyzed on three successive days in the same laboratory. The accuracy of the analytical method was expressed as percent relative error.
Specificity
Freshly prepared solutions of standard drugs and pharmaceutical formulation were injected and the chromatograms were compared to check the specifi city of the method. Similarly, chromatograms were recorded by injecting blank human plasma and human plasma spiked with standard drugs to check the specifi city of the method.
Robustness
To evaluate the robustness of the proposed method, column temperature, flow rate, pH, and wavelength were varied by ± 2°C, ± 0.1 ml/min, ± 0.1, and ± 2 nm, respectively, and the changes in the responses for both drugs were recorded.
Stability studies
solutions of 1 μg/mL, 5 μg/mL, and 10 μg/mL MET and VLD were stored at 4°C and analyzed after 15 days for their stability.
RESULTS AND DISCUSSION
Developing a sensitive HPLC-ultra violet analytical method for simultaneous estimation of MET and VLD in human plasma is challenging because of the aliphatic nature of VLD and the non-retention of MET in the HPLC column (caused by the hydrophilic and the basic nature of the MET). On the other hand, considering the high number of samples required for routine quality-control assessment of formulations and for pharmacokinetic and bioequivalence studies, the method needs to be rapid. Therefore, we chose to use a 50 mm monolithic RP column, which allowed the rapid evolution of MET along with other plasma components. Previous reports of MET analysis by RP HPLC reported the use of SDS to increase the retention time of MET;21,22 thus, we decided to use
SDS in our method to help fi ne tune the chromatographic separation. Other factors that were investigated to tune the chromatographic separation were the concentration of buffer, the pH of the mobile phase, and the type and relative composition of organic solvents of the mobile phase. A mobile phase of 30% acetonitrile/70% sodium dihydrogen phosphate and SDS (10 mM) at pH 4.5 was found to be optimal with good separation of analytes with high sensitivity. Similarly, the fl ow rate of 2.5 mL/min was selected because it allowed good separation of analytes with symmetric peaks at a reasonable time.
Method validation
Newly developed method was validated according to ICH guidelines. Freshly prepared stock solutions were used to establish system suitability tests. The results showed that the variation in selectivity, retention time, resolution, and peak asymmetry were well within in acceptable ranges for both analytes. The analytes were separated with good resolution (2.58) between MET and VLD and selectivity was above 1.47. The capacity factor (K) values observed for the analytes were more than 1.28. The tailing factors and number of theoretical plates were well within the acceptable range.
Linearity
The drug concentrations (mg/ml) and peak area ratios were plotted to construct a calibration curve. LOX was used as an internal standard for analysis of the drugs in pure form
and the formulation. Better linearity was established in the concentration ranges of 0.05-20 μg/mL and 0.1-40 μg/mL with excellent correlations. Calibration curve data are listed in Table 1.
A narrower concentration range was selected for the calibration curve for analysis in plasma using DOR as an internal standard. Linearity was found in the range of 0.1-4.0 μg/mL for MET and 0.1-4.0 μg/mL for VLD. Linear regression equations obtained from the calibration curves were:
Peak area ratio = (0.00172 ± 0.0053) + (0.621 ± 0.025) C (r = 0.9995 ± 0.0003) for MET,
Peak area ratio = (−0.00188 ± 0.0042) + (0.176 ± 0.012) C (r = 0.9994 ± 0.0002) for VLD. The correlation coeffi cients (r) were close to one, which confirmed the excellent linearity of the calibration curve. The concentration of the calibration standards was back calculated using the linear regression equations and found to be 98.01-111.50% for MET and 98.34-108.82% for VLD.
LOD and LOQ
The LOQ and LOD were determined for both formulation and in plasma. The LOD and LOQ for formulation are recorded in (Table 1) and refl ect the good sensitivity of the reported procedure. The LOD and LOQ for plasma were 0.02 μg/mL and 0.07 μg/mL for MET and 0.03 μg/mL and 0.09 μg/mL for VLD, respectively.
Accuracy
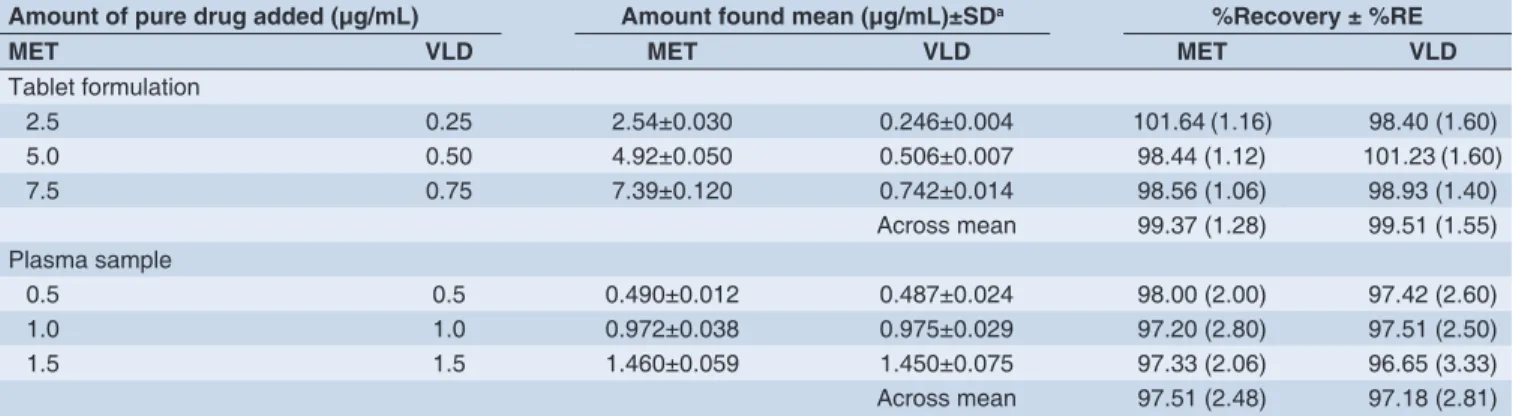
The mean percentage recovery was determined to assess the accuracy of sample preparation. The mean recoveries were 99.37% for MET and 99.51 % for VLD from the formulations and 97.51% for MET and 97.18% for VLD from spiked human plasma (Table 2).
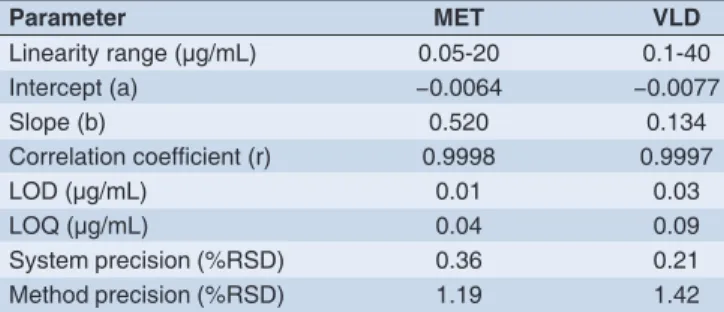
Table 1: Analytical performance data for MET and VLD by the proposed method
Parameter MET VLD
Linearity range (μg/mL) 0.05-20 0.1-40
Intercept (a) −0.0064 −0.0077
Slope (b) 0.520 0.134
Correlation coeffi cient (r) 0.9998 0.9997
LOD (μg/mL) 0.01 0.03
LOQ (μg/mL) 0.04 0.09
Precision
The precision of the proposed method was assessed in terms of system, method, and intermediate precision. The %RSD values for the system precision measurements for both analytes were <0.36%. Method precision indicates the closeness of the estimated results, and six injections were made for separately prepared standard solutions. The %RSD for the compounds were <1.42% and the results listed in Table 1 shows that the proposed procedure is precise.
Intraday and interday precision were exploited to determine the reproducibility of the process. The ratio of peak areas of the analyte versus the internal standard was used as a measurement parameter, and concentrations were computed from the linear regression equations. The % relative error and %RSD values (Table 3) were well within the tolerable range for both drugs, demonstrating that the proposed method has outstanding precision and accuracy.
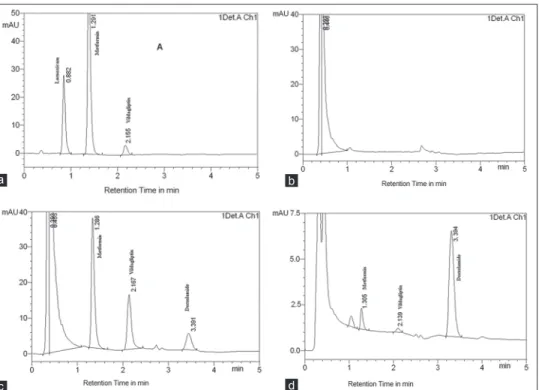
Specificity
Comparison of chromatograms of blank and pure samples with those of plasma and formulation showed that the endogenous material did not interfere with the retention times of the analytes. Representative chromatograms acquired from formulation, blank plasma, and plasma samples containing MET, VLD, and IS are presented in Figure 2a-c.
Robustness
The robustness of the suggested method was confi rmed by performing an experiment with modifi cations to the fl ow rate of the mobile phase, mobile phase pH, detection wavelength, and column temperature. The responses for MET and VLD were noted and the results showed that slight
modifi cations did not affect the resolution, tailing factor, or theoretical plates for both analytes. (Data not shown)
Stability studies
Stability studies were conducted on MET and VLD in human plasma samples under normal storage and working conditions (i.e. three freeze-thaw cycles, 24 h at room temperature, 15 days at −20°C). No considerable decrease in the concentration of analytes was observed in plasma samples. The percentage of concentration measured for MET and VLD were found to be 99.12-101.54% and 98.60-101.82% respectively, indicating the stability of stock solutions in storage condition.
Application of the proposed method
The validated analytical method was used to estimate MET and VLD in their solid dosage form. In general, appropriate recovery was achieved using the proposed HPLC method for both drugs in their formulations and it was found to 99.4 ± 1.13% metformin and 100.39 ± 1.29% vildagliptin. Furthermore, the proposed analytical method was extended to evaluate the drugs in human plasma. Three aliquots of the patient’s sample were analyzed, and the concentration of MET and VLD were found to be 790 ± 8 ng/mL and 285 ± 5 ng/mL, respectively. A typical HPLC chromatogram obtained from the patient’s plasma as shown in Figure 2d.
CONCLUSION
The proposed RP HPLC method using a monolithic column is simple, rapid, specifi c, and robust; the validated analytical method can be adopted for simultaneous determination of MET and VLD in pharmaceutical formulations and human plasma. A simple sample-extraction process, with excellent recovery and reproducibility, was adopted for
Table 2: Absolute recoveries of MET and VLD from pharmaceutical formulation and spiked human plasma
Amount of pure drug added (μg/mL) Amount found mean (μg/mL)±SDa %Recovery ± %RE
MET VLD MET VLD MET VLD
Tablet formulation
2.5 0.25 2.54±0.030 0.246±0.004 101.64 (1.16) 98.40 (1.60)
5.0 0.50 4.92±0.050 0.506±0.007 98.44 (1.12) 101.23 (1.60)
7.5 0.75 7.39±0.120 0.742±0.014 98.56 (1.06) 98.93 (1.40)
Across mean 99.37 (1.28) 99.51 (1.55) Plasma sample
0.5 0.5 0.490±0.012 0.487±0.024 98.00 (2.00) 97.42 (2.60)
1.0 1.0 0.972±0.038 0.975±0.029 97.20 (2.80) 97.51 (2.50)
1.5 1.5 1.460±0.059 1.450±0.075 97.33 (2.06) 96.65 (3.33)
plasma sample preparation. Stability studies showed that MET and VLD were stable under experimental and storage conditions, such that the proposed method can be adopted for preliminary pharmacokinetic studies.
ACKNOWLEDGMENT
The authors extend their appreciation to the Deanship of Scientifi c Research, King Faisal University, Saudi Arabia for funding this project (# 130010). Author also wish their
sincere thanks to Dr. Ibrahim Alhaider, Dean, College of Clinical Pharmacy, King Faisal University, for providing necessary facilities for the work.
REFERENCES
1. Mari A, Sallas WM, He YL, Watson C, Ligueros-Saylan M, Dunning BE, et al. Vildagliptin, a dipep tidyl peptidase-IV inhibitor, improves model-assessed beta-cell function in patients with type 2 diabetes. J Clin Endocrinol Metab. 2005;90:4888-94.
2. Ahrén B, Gomis R, Standl E, Mills D, Schweizer A. Twelve- and 52-week
Figure 2: Representative high performance liquid chromatography chromatogram of solution containing lornoxicam (tR 0.882, 500 ng/mL), metformin hydrochloride (tR 1.291, 10 μg/mL), and vildagliptin (tR 2.155, 1 μg/mL) (a), blank human plasma (b), metformin HCl (tR 1.286, 4 μg/mL), vildagliptin (tR 2.167, 4 μg/mL), and dorzolamide (tR 3.391, 2 μg/mL) in spiked human plasma (c), and patient’s plasma (d)
d c
b a
Table 3: Precision and accuracy data
Amount of drug (μg/mL)
Interday Intraday
Amount found
mean (n=3)±SD %RSD %RE mean (n=9)±SDAmount found %RSD %RE Tablet formulation
MET 0.05 0.049±0.001 2.02 1.0 0.049±0.001 2.03 1.60
10 9.92±0.212 1.21 0.8 10.16±0.193 1.87 1.68
20 19.78±0.281 1.42 1.1 19.69±0.320 1.63 1.55
VLD 0.1 0.97±0.002 1.02 1.5 0.96±0.003 1.53 2.00
20 19.73±0.340 1.72 1.3 19.83±0.290 1.46 0.85
40 40.72±0.370 0.91 1.8 39.82±0.451 1.13 0.45
Plasma spiked with sample
MET 0.1 0.10±0.001 1.76 2.0 0.10±0.001 0.97 3.0
2.0 1.97±0.028 1.42 1.5 1.96±1.172 1.17 2.0
4.0 3.95±0.067 1.70 1.2 4.02±0.052 1.29 0.5
VLD 0.1 0.10±0.002 0.99 1.5 0.97±0.001 0.51 1.5
2.0 1.98±0.031 0.31 1.0 2.01±0.026 1.29 0.5
4.0 4.05±0.043 1.06 1.2 3.96±0.058 1.46 1.0
effi cacy of the dipeptidyl peptidase IV inhibitor LAF237 in metformin-treated patients with type 2 diabetes. Diabetes Care. 2004;27:2874-80. 3. Ahrén B, Landin-Olsson M, Jansson PA, Svensson M, Holmes D,
Schweizer A. Inhibition of dipeptidyl peptidase-4 reduces glycemia, sustains insulin levels, and reduces glucagon levels in type 2 diabetes. J Clin Endocrinol Metab. 2004;89:2078-84.
4. Ristic S, Byiers S, Foley J, Holmes D. Improved glycaemic control with dipeptidyl peptidase-4 inhibition in patients with type 2 diabetes: Vildagliptin (LAF237) dose response. Diabetes Obes Metab. 2005;7:692-8.
5. Consoli A, Gomis R, Halimi S, Home PD, Mehnert H, Strojek K, et al.
Initiating oral glucose-lowering therapy with metformin in type 2 diabetic patients: An evidence-based strategy to reduce the burden of late-developing diabetes complications. Diabetes Metab. 2004;30:509-16.
6. Chawla S, Kaushik N, Singh NP, Ghosh RK, Saxena A. Effect of addition of either sitagliptin or pioglitazone in patients with uncontrolled type 2 diabetes mellitus on metformin: A randomized controlled trial. J Pharmacol Pharmacother. 2013;4:27-32.
7. Bosi E, Dotta F, Jia Y, Goodman M. Vildagliptin plus metformin combination therapy provides superior glycaemic control to individual monotherapy in treatment-naive patients with type 2 diabetes mellitus. Diabetes Obes Metab. 2009;11:506-15.
8. Schweizer A, Dejager S, Bosi E. Comparison of vildagliptin and metformin monotherapy in elderly patients with type 2 diabetes: A 24-week, double-blind, randomized trial. Diabetes Obes Metab. 2009;11:804-12.
9. Zhong GP, Bi HC, Zhou S, Chen X, Huang M. Simultaneous determination of metformin and gliclazide in human plasma by liquid chromatography-tandem mass spectrometry: Application to a bioequivalence study of two formulations in healthy volunteers. J Mass Spectrom. 2005;40:1462-71. 10. Marques MA, Soares Ade S, Pinto OW, Barroso PT, Pinto DP,
Ferreira-Filho M, et al. Simple and rapid method determination for metformin in human plasma using high performance liquid chromatography tandem mass spectrometry: Application to pharmacokinetic studies. J Chromatogr B Analyt Technol Biomed Life Sci. 2007;852:308-16.
11. Heinig K, Bucheli F. Fast liquid chromatographic-tandem mass spectrometric (LC-MS-MS) determination of metformin in plasma samples. J Pharm Biomed Anal. 2004;34:1005-11.
12. Porta V, Schramm SG, Kano EK, Koono EE, Armando YP, Fukuda K, et al.
HPLC-UV determination of metformin in human plasma for application in pharmacokinetics and bioequivalence studies. J Pharm Biomed Anal. 2008;46:143-7.
13. Gabr RQ, Padwal RS, Brocks DR. Determination of metformin in human plasma and urine by high-performance liquid chromatography using small sample volume and conventional octadecyl silane column. J Pharm Pharm Sci. 2010;13:486-94.
14. Zarghi A, Foroutan SM, Shafaati A, Khoddam A. Rapid determination of metformin in human plasma using ion-pair HPLC. J Pharm Biomed Anal. 2003;31:197-200.
15. AbuRuz S, Millership J, McElnay J. Determination of metformin in plasma using a new ion pair solid phase extraction technique and ion pair liquid chromatography. J Chromatogr B Analyt Technol Biomed Life Sci. 2003;798:203-9.
16. Kolte BL, Raut BB, Deo AA, Bagool MA, Shinde DB. Simultaneous high-performance liquid chromatographic determination of pioglitazone and metformin in pharmaceutical-dosage form. J Chromatogr Sci. 2004;42:27-31. 17. Barden AT, Salamon B, Schapoval EE, Steppe M. Stability-indicating RP-LC method for the determination of vildagliptin and mass spectrometry detection for a main degradation product. J Chromatogr Sci. 2012;50:426-32. 18. Thomas A, Patil S, Nanda R, Kothapalli L, Deshpande A. Stability-Indicating RP-HPLC method for determination of metformin hydrochloride and natglinide in bulk and tablet formulations. Curr Pharm Anal. 2012;8:381-8.
19. Hess C, Musshoff F, Madea B. Simultaneous identifi cation and validated quantifi cation of 11 oral hypoglycaemic drugs in plasma by electrospray ionisation liquid chromatography-mass spectrometry. Anal Bioanal Chem. 2011;400:33-41.
20. Santhosha B, Ravindranath A, Sundari CH. Validated method for the simultaneous estimation of metformin hydrochloride and vildagliptin by RP-HPLC in bulk and the pharmaceutical dosage form. Int Res J Pharm Appl Sci. 2012;2:22-8.
21. Abdul-Azim MM, Elkady EF, Fouad MA. Development and validation of a reversed-phase column liquid chromatographic method for simultaneous determination of two novel gliptins in their binary mixtures with metformin. Eur J Chem. 2012;3:152-5.
22. Subhakar N, Krishna RV, Ravindranath R. Development and validation of RP-HPLC method for simultaneous determination of vildagliptin and metformin in bulk and formulation dosage. Int Res J Pharm Appl Sci. 2012;2:44-50.