Multi-temporal analysis of sediment yield caused by hydric erosion in a basin of the Anoia-Penedès vineyard region (NE Spain)
20
0
0
Full text
(2) Martínez-Casasnovas et al.. década 2001-2010, usando datos detallados de suelos, usos del suelo y relieve. Se encontraron diferencias importantes en cuanto a escorrentía y producción de sedimentos a lo largo de los años analizados. Las zonas de bosques y otras con diferente grado cobertura natural fueron responsables del 48.8% de los sedimentos exportados, siendo el 82.0% de estos sedimentos generados en las paredes desnudas de barrancos. Las áreas agrícolas produjeron el 51.2% restante de los sedimentos totales generados. In estas zonas, y particularmente en los viñedos, las prácticas tradicionales de cultivo fueron eliminadas durante las transformaciones de tierras habidas, permaneciendo el suelo prácticamente descubierto durante la mayor parte del año. La década analizada (2001-2010) representa un ejemplo de la situación cada vez más frecuente que se observa en esta región bajo las condiciones del cambio climático actual. Key words: soil erosion, Mediterranean region, agro-forestry system, SWAT. Palabras clave: erosión de suelos, región Mediterránea, sistema agroforestal, SWAT. Enviado el 7 de septiembre de 2011 Aceptado el 11 de noviembre de 2011. *Corresponding: Department of Environment and Soil Science. University of Lleida. Av Rovira Roure 191, E25198 Lleida (Spain). E-mail: [email protected]. 1. Introduction Soil erosion is a known problem in Mediterranean and semiarid environments around the world that leads to the progressive impoverishment of soil as resource for agriculture and natural vegetation development. Factors such as climate, topography, lithology, land use change and management (e.g. intensive agricultural practices) have turned erosion into the major cause of land degradation in those environments (Cerdà, 2008; Zucca et al., 2010; García-Ruiz and Lana-Renault, 2011). A particular example of these land characteristics is the Anoia-Penedès region (Catalonia, NE Spain), which is mainly dedicated to the cropping of vines for high quality wines and “cavas” (Spanish champagnes). In this region, the coincidence of that extensive land use (vineyard in most cases without soil cover), frequent high intensity rainfall, high erodible soil parent materials, land use changes and abandonment of traditional soil conservation measures have accelerated erosion processes (Ramos and Martínez-Casasnovas, 2006a, 2010). Also a dense and deep gully network has been developed in the Tertiary unconsolidated marls that fill the Penedès Depression, which significantly contributes to increase the sediment yield from this area (MartínezCasasnovas et al., 2004, 2009; Martínez-Casasnovas and Ramos, 2009). At present, although gully walls are mostly covered by natural vegetation, being that a sign of stabilization (Crouch and Blong, 1989), and favoring wall protection against splash,. 96. CIG 38 (1), 2012, p. 95-114, ISSN 0211-6820.
(3) Multi-temporal analysis of sediment yield caused by hydric erosion. sheet and rill erosion, gullies are still active, with mass movement and sidewall retreat as the main processes (Martínez-Casasnovas et al., 2009). Previous research in the Anoia-Penedès region (as an example of rainfed Mediterranean areas) has been addressed to analyse and quantify erosion processes from the regional scale to the field scale, determining the affection and quantifying taxes by gully erosion (Martínez-Casasnovas 2003; Martínez-Casasnovas and Ramos, 2009; Martínez-Casasnovas et al., 2009), ephemeral gully erosion (Martínez-Casasnovas et al., 2005) and quantifying soil and nutrient losses (Ramos and Martínez-Casasnovas, 2004, 2006b, 2006c, 2007, 2009) at field scale. Even, an estimation of the cost of erosion based on sediment redistribution expenses and nutrient reestablishment was done (Martínez-Casasnovas and Ramos, 2006). One of these works (Martínez-Casasnovas et al., 2009) supposes the integration of soil erosion quantification at field scale and the relationship with gully erosion in the head of a very active system. Although this study revealed the importance of the maintenance of conservation practices in the agricultural fields and the relationship between the runoff from the catchment with the improvement of vegetation on the gully walls, it did not show the multitemporal behaviour of the typical agro-forestry system in this region (composed of agricultural fields and forest and other natural vegetation in the gullies) with respect to sediment yield under the highly variable Mediterranean rainfall characteristics. In this context, the aim of the present work is to analyse the multitemporal variability of sediment yield in an agro-forestry system of the Penedès region (catchment mainly dedicated to the cropping of vines and with large gullies covered by natural vegetation). In this area high erodible soil parent materials, frequent high intensity rainfall, as well as other external factor such as land use management changes and abandonment of traditional soil conservation measures, favor erosion processes. Traditionally, the studies developed in small catchments, have been focused on direct field measurements (e.g. Bochet et al., 1998; Dunjó et al., 2004). However, for larger areas or regional scales, other approaches that integrate available spatial data need to be applied (Alatorre and Beguería, 2009). In this context, the use of physical simulation models (e.g. Bathurst et al., 2006; Martínez-Carreras et al., 2007; Mueller et al., 2009) at watershed scale has become an important tool to estimate runoff, sediment yield and to quantify the impacts of conservation practices at various spatial and temporal scales (Chiang et al., 2010). In this respect, the Soil and Water Assessment Tool (SWAT) (Arnold et al., 1998) arises as a well known model to quantify soil erosion and sediment yield. Hence, SWAT can assess in a fast and accurate way the effect of individual storms, different topographic, soil and land cover scenarios on runoff and sediment yield (Gassman et al., 2007). In addition to the above mentioned aim, the present work is a contribution to the application of SWAT at detailed scale, in an agricultural area where the development of gullies (mainly covered by forest) is an important erosion process.. CIG 38 (1), 2012, p. 95-114, ISSN 0211-6820. 97.
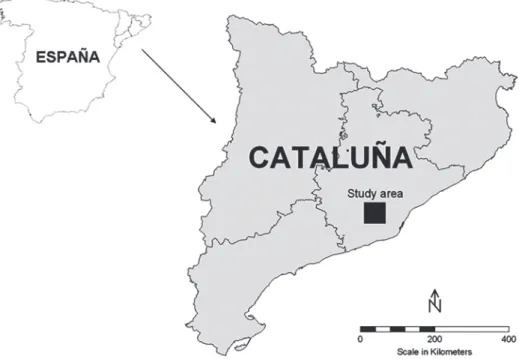
(4) Martínez-Casasnovas et al.. Figure 1. Location of the study area.. 2. Materials and methods 2.1. Study area The study area is a catchment of 2050 ha located in Catalonia, Northeast Spain (1º 47’ 45” E, 41º 31’ 00” N, 290 m.a.s.l.), between the towns of Masquefa and Piera (fig. 1). This area is part of the Penedès Tertiary Depression, where unconsolidated marls outcrop. The climate is Mediterranean, with a mean annual temperature of 15°C and a mean annual rainfall of 520 mm (Ramos and Martínez-Casasnovas, 2010). The rainfall mainly occurs in two periods: September to November and April to June. High intensity rainstorms are frequent during autumn (e.g.>100 mm h-1 in 5-min periods). The average rainfall erosivity factor (R = kinetic energy x maximum intensity in 30-min period) is about 1200 MJ mm ha-1 h-1 y-1 (Ramos, 2002). Nevertheless, in the 2000 decade, values ranging between 1350-3900 MJ mm ha-1 h-1 y-1 based on 1-min intervals have been registered (Ramos and Martínez-Casasnovas, 2009). The dominant soil subgroups are Typic Xerorthents and Typic Calcixerepts (Martínez-Casasnovas and Ramos, 2009). The main agricultural land use in the region is vineyards (Vitis vinifera) for the production of high quality vines. Vineyards alternate either with winter cereals (mainly barley, Hordeum vulgare) and forages (alfalfa, Medicago sativa). The arboreal vegetation,. 98. CIG 38 (1), 2012, p. 95-114, ISSN 0211-6820.
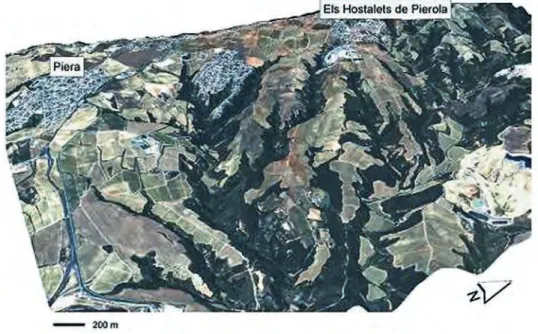
(5) Multi-temporal analysis of sediment yield caused by hydric erosion. present in the gullies, is mainly composed by Pinus halepensis, Quercus ilex and Quercus faginea. In addition, gullies are also covered by herbaceous species such as Arundo donax, Rubus ulmifolius, Cistus albidus, Rosmarinus officinalis, and Thymus vulgaris is common. One of the main characteristics of the study area is the dissection of the landscape by a dense, deep network of gullies (fig. 2). Inter-gully areas are usually undulating to rolling, although in the recent past were intensively levelled due to land transformations to favour vineyard mechanization. The time of gully erosion initiation is difficult to determine, although it could be contemporary to the start of the erosive period in the Pleistocene (Gallart, 1981). At present, there is evidence of active gully erosion, which could have been accelerated by widespread land use changes that started in the late Middle Ages, when massive plantation of vineyards under the protection of temporary contracts called “Rabassa Morta” started. This land use change caused the clearing of forested areas and the increase of runoff rates, accelerating gully erosion (Martínez-Casasnovas and SánchezBosch, 2000). Most of the sediment yield in gullies occurs by sidewall processes. Subsurface flow to sidewalls seems to influence collapse by increasing soil water content reaching saturation, which reduces cohesion of the steep gully-walls, and by increasing the weight of the walls (Martínez-Casasnovas et al., 2004). Sediment mobilised from the gully walls is usually removed by concentrated runoff during and after high-intensity rainstorms. In other cases, the sediment is deposited on the gully bottom, which may lead to bed aggradation (Martínez-Casasnovas et al., 2009).. Figure 2. 3D view of the study area (vertical enhancement x2.5) in which it can be observed the dense and deep gully network (the distance in the scale bar is approximate).. CIG 38 (1), 2012, p. 95-114, ISSN 0211-6820. 99.
(6) Martínez-Casasnovas et al.. 2.2. Estimation of runoff and sediment yield Runoff and sediment yield (sediment delivered to the channels) along the study period (2000-2010) was simulated using the Soil and Water Assessment Tool (SWAT) (Arnold et al., 1998; Neitsch et al., 2005). It is a physical process-based model developed by the United States Department of Agriculture (USDA) and the Agricultural Research Service (ARS). The tool is addressed to simulate and predict impacts of landscape processes and/or management practices on water, sediment and agricultural chemical yields at catchment scale. It uses climate, soil and land use, land management (e.g. crop growth, agricultural management practices) and topographic data to predict, among other, surface runoff, infiltration, soil water content, sediment and nutrient losses. For modelling purposes, SWAT divides a catchment into different watersheds and splits them into smaller units called Hydrological Response Units (HRU). The HRUs are created, in each watershed, by the intersection of land uses, soil types and slope classes (Gassman et al., 2007). Sediment yield is estimated for each HRU by means of the Modified Universal Soil Loss Equation (MUSLE), developed by Williams (1975). In this equation the rainfall energy factor is replaced with a runoff factor, which is used in the computing of detachment and transporting sediment. Then, sediment yield prediction is improved with respect USLE equation (Wischmeier and Smith, 1978) since runoff is a function of antecedent moisture condition as well as rainfall energy. The hydrological model incorporated in SWAT supplies estimates of runoff volume and peak runoff rate, which are used to calculate the runoff erosive energy per storm. The crop management factor is also calculated for each day that runoff occurs, being this a function of the above-ground biomass, the residue on the soil and the minimum C factor for the plant (Neitsch et al., 2005). The other factors in the MUSLE equation are evaluated as described by Wischmeier and Smith (1978). 2.3. Data input SWAT was applied for simulating runoff and sediment yield for the period 20012010. This period included years with extreme situations (dry and wet years and intensive rainfall events), which are more and more frequent in the region during the last decades. For this study the ArcSWAT 2009.93.5 version compatible with ArcGIS 9.3 was used. The GIS input files for SWAT included the detailed soil map of the study area (1:25 000) (DAR, 2008), a 5 m resolution Digital Elevation Model (DEM) built from topographic data and soil lines produced by the Cartographic Institute of Catalonia (topographic map v.2.0 1:5000) and the Land Cover Map of Catalonia (3rd edition) (Ibàñez and Burriel, 2008). Soil information (geometric and descriptive) were extracted from the Detailed Soil Map of Catalonia (DO Penedès region) (DAR, 2008). Input information about soil pro-. 100. CIG 38 (1), 2012, p. 95-114, ISSN 0211-6820.
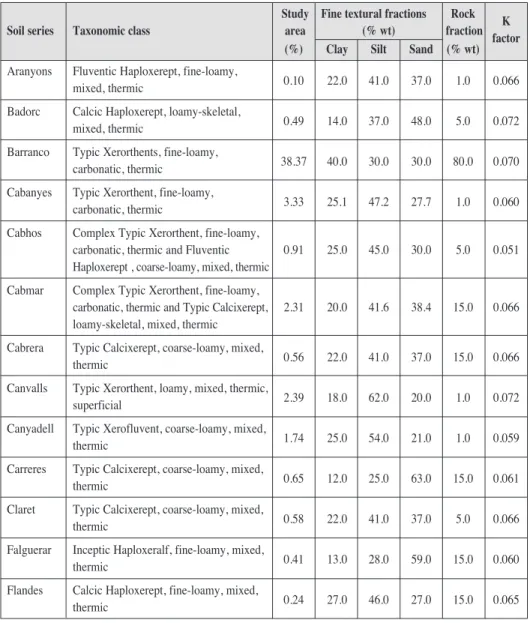
(7) Multi-temporal analysis of sediment yield caused by hydric erosion. perties was obtained from the description of soil cartographic and taxonomic units (soil series) included in the soil survey of the soil survey (DAR, 2008) (table 1). Table 1. Soil taxonomic classes in the study area according to Soil Taxonomy (SSS, 1999) (DAR, 2008), and main soil properties including the K erodibility factor.. Soil series. Taxonomic class. Study Fine textural fractions Rock K area (% wt) fraction factor (%) Clay Silt Sand (% wt). Aranyons. Fluventic Haploxerept, fine-loamy, mixed, thermic. 0.10. 22.0. 41.0. 37.0. 1.0. 0.066. Badorc. Calcic Haploxerept, loamy-skeletal, mixed, thermic. 0.49. 14.0. 37.0. 48.0. 5.0. 0.072. Barranco. Typic Xerorthents, fine-loamy, carbonatic, thermic. 38.37. 40.0. 30.0. 30.0. 80.0. 0.070. Cabanyes. Typic Xerorthent, fine-loamy, carbonatic, thermic. 3.33. 25.1. 47.2. 27.7. 1.0. 0.060. Cabhos. Complex Typic Xerorthent, fine-loamy, carbonatic, thermic and Fluventic Haploxerept , coarse-loamy, mixed, thermic. 0.91. 25.0. 45.0. 30.0. 5.0. 0.051. Complex Typic Xerorthent, fine-loamy, carbonatic, thermic and Typic Calcixerept, loamy-skeletal, mixed, thermic. 2.31. 20.0. 41.6. 38.4. 15.0. 0.066. Cabrera. Typic Calcixerept, coarse-loamy, mixed, thermic. 0.56. 22.0. 41.0. 37.0. 15.0. 0.066. Canvalls. Typic Xerorthent, loamy, mixed, thermic, superficial. 2.39. 18.0. 62.0. 20.0. 1.0. 0.072. Canyadell. Typic Xerofluvent, coarse-loamy, mixed, thermic. 1.74. 25.0. 54.0. 21.0. 1.0. 0.059. Carreres. Typic Calcixerept, coarse-loamy, mixed, thermic. 0.65. 12.0. 25.0. 63.0. 15.0. 0.061. Claret. Typic Calcixerept, coarse-loamy, mixed, thermic. 0.58. 22.0. 41.0. 37.0. 5.0. 0.066. Falguerar. Inceptic Haploxeralf, fine-loamy, mixed, thermic. 0.41. 13.0. 28.0. 59.0. 15.0. 0.060. Flandes. Calcic Haploxerept, fine-loamy, mixed, thermic. 0.24. 27.0. 46.0. 27.0. 15.0. 0.065. Cabmar. The K soil erodibility factor of each taxonomic class (soil family) was calculated according to Wischmeier et al. (1971) (values for each soil class are also included in table 1 in international system units).. CIG 38 (1), 2012, p. 95-114, ISSN 0211-6820. 101.
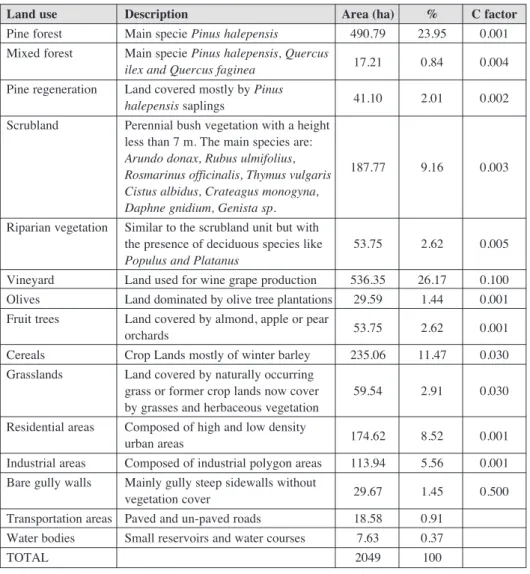
(8) Martínez-Casasnovas et al.. The land use/cover classes were simplified to the ones described in table 2. For each land use/class (except for urban, industrial and water classes), it was necessary to define the USLE cover and management (C) factor, considered by SWAT to compute soil loss and sediment yield. The C factor is defined as the ratio of soil loss for soil managed under specified conditions to losses from clean-tilled, continuous fallow. Calculation of the C value for a particular crop involves several variables, including crop canopy, tillage practices, residue mulch, and land-use residual (Wischmeier and Smith, 1978). For this study, we adjusted the USLE C factor, as proposed by Arnold and Williams (1995), to simulate the effects of increased ground cover in vineyard areas, as well as degraded grass cover conditions in grazed pasture (Potter and Hiatt, 2009). Table 2. Land use / cover classes in the study area and minimum C cover and management factor required by SWAT to compute soil loss and sediment yield. Land use. Description. Area (ha). %. C factor. Pine forest. Main specie Pinus halepensis. 490.79. 23.95. 0.001. Mixed forest. Main specie Pinus halepensis, Quercus ilex and Quercus faginea. 17.21. 0.84. 0.004. Pine regeneration. Land covered mostly by Pinus halepensis saplings. 41.10. 2.01. 0.002. Scrubland. Perennial bush vegetation with a height less than 7 m. The main species are: Arundo donax, Rubus ulmifolius, Rosmarinus officinalis, Thymus vulgaris Cistus albidus, Crateagus monogyna, Daphne gnidium, Genista sp.. 187.77. 9.16. 0.003. Similar to the scrubland unit but with the presence of deciduous species like Populus and Platanus. 53.75. 2.62. 0.005. Vineyard. Land used for wine grape production. 536.35. 26.17. 0.100. Olives. Land dominated by olive tree plantations. 29.59. 1.44. 0.001. Fruit trees. Land covered by almond, apple or pear orchards. 53.75. 2.62. 0.001. Cereals. Crop Lands mostly of winter barley. 235.06. 11.47. 0.030. Grasslands. Land covered by naturally occurring grass or former crop lands now cover by grasses and herbaceous vegetation. 59.54. 2.91. 0.030. Residential areas. Composed of high and low density urban areas. 174.62. 8.52. 0.001. Industrial areas. Composed of industrial polygon areas. 113.94. 5.56. 0.001. Bare gully walls. Mainly gully steep sidewalls without vegetation cover. 29.67. 1.45. 0.500. 18.58. 0.91. 7.63. 0.37. 2049. 100. Riparian vegetation. Transportation areas Paved and un-paved roads Water bodies TOTAL. 102. Small reservoirs and water courses. CIG 38 (1), 2012, p. 95-114, ISSN 0211-6820.
(9) Multi-temporal analysis of sediment yield caused by hydric erosion. In addition to the described spatial data, also daily climatic data for analyzed years was required. Weather inputs included daily data of precipitation, minimum and maximum temperature, solar radiation, wind speed and relative air humidity. These data were collected from a meteorological station located at Els Hostalets de Pierola (1º 48’ 30.50” E, 41º 31’ 51.71” E, 320 m.a.s.l.), which belongs to the network of the Meteorological Service of Catalonia and is inside the study area. Daily rainfall with P> 9 mm, considered by some authors as erosive rainfall (Mannaerts and Gabriels, 2000), were considered in a detailed rainfall analysis.. 3. Results and discussion 3.1. Rainfall, surface runoff and sediment yield Table 3 summarizes the annual rainfall data registered in the study area in the decade 2001-2010, the number of days with erosive events (P> 9 mm) and simulated runoff and sediment yield in the basin. Table 3. Summary of annual rainfall data, number of days with erosive events and runoff and sediment yield modeled by SWAT during the decade 2001-2010. Year. P mm. Days with P> 9 mm. % Days with P> 9 mm. Runoff mm. Sed. yield Mg ha-1. % Runoff in % Sed. yield days with in days with P> 9 mm P> 9 mm. 2001. 448.8. 16. 76.3. 33.9. 0,71. 2002. 612.7. 19. 78.2. 103.9. 3.87. 99.8. 99.8. 2003. 500.3. 17. 68.6. 49.0. 2.86. 98.8. 99.9. 2004. 785.5. 9. 22.4. 23.7. 1.25. 94.1. 94.9. 2005. 365.6. 11. 58.0. 25.5. 0.32. 98.9. 95.1. 2006. 329.9. 11. 74.4. 29.3. 1.28. 99.8. 99.4. 2007. 548.5. 17. 78.0. 77.2. 3.83. 99.5. 99.7. 2008. 751.5. 28. 81.7. 108.0. 4.22. 99.7. 99.7. 2009. 542.9. 14. 79.9. 49.1. 2.16. 99.4. 99.3. 2010. 735.7. 23. 73.2. 93.2. 7.08. 94.3. 92.7. 99.6. 99.0. The average annual precipitation in the basin during the 2001-2010 decade was 562.2±159.2 mm, ranging between 329.9 mm (in 2005) and 785.5 mm (in 2004). The average number of rainy days with erosive rainfall (P> 9 mm) was 16.5, out of 100.4 of rainy days in the year (on average). These days with P> 9mm supposed 69.1% of the total rainfall (on average), which indicates the concentration of rainfall in a reduced number of events that cause erosion, typical of the Mediterranean region. Particularly. CIG 38 (1), 2012, p. 95-114, ISSN 0211-6820. 103.
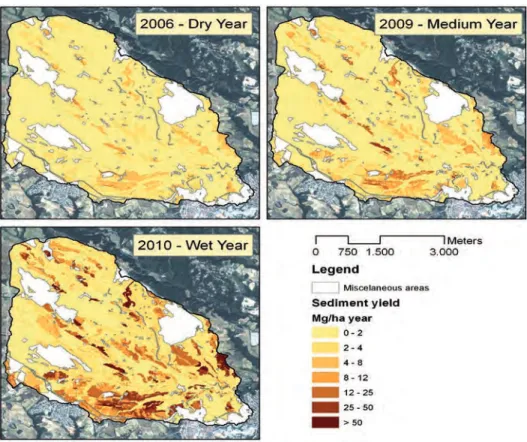
(10) Martínez-Casasnovas et al.. anomalous was the year 2004. It was the wettest year of the series but with the smallest number of erosive events (only 9 along the year). The average runoff estimated by the model according to the input data was 59.3±33.3 mm, with a minimum value of 23.7 mm in 2004 and a maximum of 108 mm in 2008. What is significant is that 98.4±2.2 mm (in average) of the total runoff was caused by the registered erosive events (P> 9mm). The same pattern can be observed in the estimated sediment yield of the basin. In this case the average of the series was 2.76±2.0 Mg ha-1, with a minimum of 0.32 Mg ha-1 in 2005 (dry year) and a maximum of 7.08 Mg ha-1 in 2010 (wet year), being 98.0±2.7% of the losses caused by the few erosive events that supposed 69.1% of the annual rainfall, on average, but representing up to 81.7% of annual rainfall. 3.2. Sediment yield according to land use cover In addition to the differences in runoff and sediment yield between years, important differences depending on the land use cover were also observed (fig. 3 and table 4).. Figure 3. Sediment yield in three representative years of the analyzed series (2001-2010): 2006 (329.9 mm, dry year), 2009 (542.9 mm, medium year) and 2010 (735.7 mm, wet year).. 104. CIG 38 (1), 2012, p. 95-114, ISSN 0211-6820.
(11) CIG 38 (1), 2012, p. 95-114, ISSN 0211-6820. 0.51. 0.16. 0.17. Vineyard. Olives. Fruit trees. 123.26. 0.01. Riparian vegetation. Bare gully walls. 0.07. Scrubland. 1.88. 0.49. Pine regeneration. 22.17. 0.05. Mixed forest. Grasslands. 0.01. Pine forest. Cereals. 2001. Land use / soil cover. 305.49. 82.71. 14.37. 5.82. 4.75. 5.89. 0.55. 2.91. 8.38. 1.55. 0.65. 2002. 194.86. 40.26. 8.81. 6.37. 7.82. 4.00. 0.76. 6.01. 9.65. 1.98. 0.95. 2003. 63.68. 10.85. 1.87. 3.91. 4.31. 1.83. 0.43. 4.02. 4.62. 0.84. 0.57. 2004. 52.46. 7.14. 0.83. 0.07. 0.07. 0.18. 0.01. 0.01. 0.26. 0.04. 0.01. 2005. 58.62. 10.90. 3.19. 3.33. 4.33. 1.32. 0.54. 3.44. 4.03. 0.90. 0.67. 2006. 275.19. 61.91. 4.78. 10.42. 6.80. 6.70. 1.22. 8.72. 17.13. 4.11. 1.65. 2007. 280.43. 59.03. 14.41. 7.56. 2.63. 6.76. 0.45. 2.08. 13.50. 3.15. 0.45. 2008. 188.49. 36.56. 8.74. 3.67. 4.15. 2.57. 0.30. 2.98. 4.83. 0.96. 0.40. 2009. 495.73. 140.64. 43.87. 9.96. 6.64. 9.80. 0.62. 4.07. 16.36. 3.78. 0.71. 2010. 203.82. 47.21. 10.27. 5.12. 4.16. 3.95. 0.49. 3.42. 7.93. 1.74. 0.61. 40.0. 18.6. 16.0. 1.8. 0.8. 14.0. 0.2. 4.2. 2.2. 0.2. 2.0. Annual % with respect average the total soil Mg ha-1 losses. Table 4. Average annual sediment yield according to land use covers in the study basin (Mg ha-1).. Multi-temporal analysis of sediment yield caused by hydric erosion. 105.
(12) Martínez-Casasnovas et al.. As it is well known, the results show that forests, which in this study basin growth in former areas affected by gully erosion, play a very important role as protection cover, avoiding major sediment yield rates. Dense forest vegetation (pine and mixed forests), mostly in steep slopes, had lower sediment yield values than most of the other arboreal and agricultural classes. However, the area covered by pine regeneration (area under natural regeneration after a forest fire) increased by about 1300% the sediment yield rate with respect the well established pine forest. Special mention deserves the sediment yield produced in the bare gully walls, which is the one with the highest rates, with an average along the decade of 203.82 Mg ha-1. Although this class represents only 1.45% of the total study area, it supposes the highest contribution of the basin to the sediment yield (40.0%). This can be explained by the lack of vegetation cover against splash, sheet and rill erosion, the high slope degrees in these areas (fig. 4), the high erodibility of the lithological materials (mainly unconsolidated marls) and the water accumulation in some areas due to subsurface runoff. Bare gully walls were active even in dry years (e.g. 2005 or 2006, table 4). Even more, the contribution of this type of land cover was relatively higher in the dry years than in the wet year. For example, in 2005 the rates of sediment yield in the bare gully sidewalls represented almost the total of soil loss in gully areas (98.5%), while in wet years (as 2010), other vegetated gully areas also contributed to sediment production, representing 18.0% of the total soil loss, but being the non vegetated walls the responsible for the left 82.0% of the total sediment yield in forest and gully cover zones. The important contribution of gully erosion to total sediment yield of basins has been also studied by other researchers, either in the Mediterranean region or in other parts of the world (Bufalo and Nahon, 1992; Poesen et al., 1996; DeRose et al., 1998; Bennet et al., 2000; Vandekerckhove et al., 2000; and others). For example, (MartínezCasasnovas and Poch 1998), in badlands of the Barasona basin, located in the Spanish Pre-Pyrenees, measured 302-455 Mg ha-1. The annual rainfall of the measured period accounted for similar figures than the wettest years in the present study (2004, 2008, 2010, table 3): 767.5 mm in the Barasona basin. Other authors (Bufalo and Nahon, 1992), measured lower rates in badlands of Hautes-Alpes (France): 190 Mg ha-1 for an average rainfall of 840 mm, but these were on Jurassic marls instead of Superior Neocene non consolidated marls as in the study area. In addition, badlands of HautesAlpes were 70% covered by grass or scattered vegetation (Bufalo and Nahon, 1992). Descroix and Olivry (2002) indicated figures of the same order of magnitude in badlands in South Alpine black marls giving erosion rates of 200 Mg ha-1 year-1. Other authors, however, had given rates of a higher order, as for example the 1322 Mg ha-1 year-1 in gullies of the same study region as the present case study (Martínez-Casasnovas, 2003), between 1550 - 2480 Mg ha-1 year-1 in gullies of the Mangatu forest (New Zealand) (DeRose et al., 1999). In this respect, the rates of the present study are 1547 Mg ha-1 year-1, on average, are of this order of magnitude. Another different study on gully erosion in the Penedès region (Martínez-Casasnovas et al., 2004), also confirmed that mass movements can cause the failure and collapse of. 106. CIG 38 (1), 2012, p. 95-114, ISSN 0211-6820.
(13) Multi-temporal analysis of sediment yield caused by hydric erosion. Figure 4. Bare gully walls in the study area cause the highest sediment yields per unit area because the lack of protection, the unconsolidated of the lithological materials and the steepness of the slopes.. gully walls independently of the vegetation cover. Then, the improvement of vegetation cover conditions in gully walls is necessary to avoid major sediment yield but it is not enough to stop sidewall erosion (Martínez-Casasnovas et al., 2009). In this respect, the benefits of having gully walls protected by natural vegetation is confirmed with the results of the present study, being an important factor to avoid the expansion of gullies towards the agricultural land (Rey, 2003; Valentin et al., 2005; Chirino et al., 2006; MartínezCasasnovas et al., 2009). In addition, natural vegetation at the bottom of the gully also would be playing an important role in controlling the sediment delivery ratio of the basin because of its sediment trapping effect, which varies according to the specie composition (Rey, 2003; Rey et al., 2004). Regarding other land covers in the study area, and for the analyzed years, agricultural lands had a greater contribution to total sediment yield than natural vegetation areas and gully walls: 51.2% in agricultural lands versus 48.8% forest and other natural vegetated areas.. CIG 38 (1), 2012, p. 95-114, ISSN 0211-6820. 107.
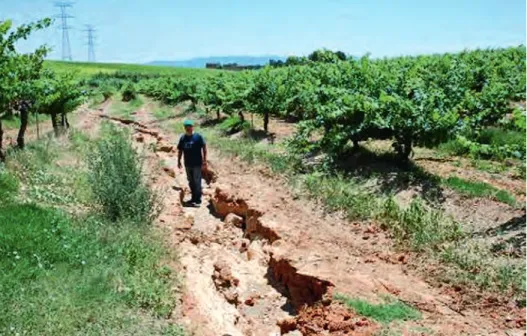
(14) Martínez-Casasnovas et al.. Figure 5. Example of soil erosion, with gully development, in vineyard fields of the study area, which gives an idea of the magnitude of the erosion problem in these lands.. The reason for these numbers has to be sought in the typology of crops and their management in rainfed Mediterranean areas. It is contributing to increase runoff rates and sediment yield, particularly in years with annual rainfall above the average (about 560 mm in the study area). This is reflected in the sediment yield in vineyard lands (3.95±3.21 Mg ha-1 year-1 on average in the study decade), olive (4.16±2.62 Mg ha-1 year-1) and fruit trees (5.12±3.60 Mg ha-1 year-1) (fig. 5). All these crops are among the ones in which higher erosion rates are recorded (Kosmas et al., 1997). Higher values have been reported in vineyards in the Mediterranean area: 47-70 Mg ha-1 yr-1 in NW Italy (Tropeano, 1983) or 35 Mg ha-1 yr-1 in the Mid Aisne region (France) (Wicherek, 1991). In the study case these crops have similar soil cover throughout the year (being the soil bare during the growing season). Furthermore, vineyard lands have suffered big transformations during the last decades in the study area in order to facilitate the mechanization of the tillage operations and to reduce man labor (Martínez-Casasnovas et al., 2009). These practices have conduced to the removing of traditional conservation measures, such as drainage terraces (Martínez-Casasnovas et al., 2005), and the required land leveling for new plantations has made the soil thinner and more susceptible to runoff (Ramos and Martínez-Casasnovas, 2007), affecting the soil properties that are directly related with soil infiltration (Capolongo et al., 2008). These problems were reported by Ramos and Martínez-Casasnovas (2007) in the study area by comparing disturbed and non disturbed soils.. 108. CIG 38 (1), 2012, p. 95-114, ISSN 0211-6820.
(15) Multi-temporal analysis of sediment yield caused by hydric erosion. Figure 6. Example of soil erosion in a field of the study area just before the planting of winter barley.. Regarding cereals and grasslands, these land cover present an important variability in dry and wet years, with average sediment yields of 10.27±12.81 Mg ha-1 year-1 and 42.21±41.34 Mg ha-1 year-1 respectively. Extreme rainfall events may be the cause of these high rates. Along the series of the considered years (2001-2010), most of the main extreme events occurred in the months of September and October, when the land used to growth cereals is under preparation for planting, producing very high sediment loads (fig. 6). In the study area, grasslands usually cover abandon agricultural fields and parts of gully walls. In abandon agricultural fields this vegetation is frequently grazed, or even overgrazed, and partially covers the soil during the summer, leaving soil unprotected again until winter. This explains the high soil losses generated in these lands.. 4. Conclusions The present work shows some first results of the application of the Soil and Water Assessment Tool to model runoff and sediment yield in a typical rainfed Mediterranean basin, with the particularity of the high erodibility of the soils and lithological materials and climatic and land use conditions that favour soil erosion. Although the input data and parameters used by the model were adapted to the crops and conditions of the study area, the results should be considered as relative values and have to be interpreted with caution.. CIG 38 (1), 2012, p. 95-114, ISSN 0211-6820. 109.
(16) Martínez-Casasnovas et al.. In the study area, important differences of runoff and sediment yield, as well among land covers, along the analyzed years were found. Nevertheless, what is a constant through the climatic data series is that runoff and soil erosion is being caused by a reduced number of rainfall events every year. Regarding sediment yield, forest and natural vegetated areas were the responsible for 48.8% of the sediments exported from the basin, being 82.0% of these sediments generated in the bare gully sidewalls of the study area. This indicates that vegetation on gully walls plays a very important role in control erosion, but it seems to be that the responsibility for this is of no one. Agricultural uses (vineyards, olive and rainfed fruit trees) in the basin are the responsible for the rest 51.2% of the total soil losses, since traditional agricultural practices were removed during land transformation and the soil is maintained bare most of the year. Regardless MUSLE integrated in SWAT does not model other processes than sheet and rill erosion, the results obtained in the gully areas are consistent with previous research carried out to determine the contribution of sediment yield in gullies to total sediment yield generated in a catchment. This is because bare gully sidewalls have very high slope degrees and high erodible lithological materials (unconsolidated marls), which made them very prone to sheet and rill erosion. The selected decade (2001-2010) represent an example of the situation that more and more frequently are observed in the area under the climate change conditions, in which the extreme events with high intensity rainfall are recorded, which underscores the importance of this type of studies.. Acknowledgements This work is part of the research project AGL2009-08353 funded by the Spanish Ministry of Science and Innovation. We thank very much Dr. R. Srinivasan (Texas A&M University) for his help in the model set up and the adaptation of different model parameters for a better fit to the study case and for his support with troubleshooting.. References ALATORRE, L. C., BEGUERÍA, S. (2009). Identification of eroded areas using remote sensing in a badlands landscape on marls in the central Spanish Pyrenees. Catena, 76: 182-190. ARNOLD, J. G., WILLIAMS, J. R. (1995). A watershed scale model for soil and water resources management. In: Computer models of watershed hydrology (Singh, V. P., ed.). Water Resources Publications, pp. 847-908. ARNOLD, J. G., SRINIVASAN, R., MUTTIAH, S., WILLIAMS, J. R. (1998). Large area hydrologic modeling and assessment part I: Model development. Journal of the American Water Resources Association, 34: 73-89.. 110. CIG 38 (1), 2012, p. 95-114, ISSN 0211-6820.
(17) Multi-temporal analysis of sediment yield caused by hydric erosion. BATHURST, J. C., BURTON, A., CLARKE, B. G., GALLART, F. (2006). Application of the SHETRAN basin-scale, landslide sediment yield model to the Llobregat basin, Spanish Pyrenees. Hydrological Processes, 20: 3119-3138. BENNET, S. J., CASALÍ, J., ROBINSON, K. M., KADAVY, K. C. (2000). Characteristics of actively eroding ephemeral gullies in an experimental channel. Transactions of ASAE, 43: 641-649. BOCHET, E., RUBIO, J. L., POESEN, J. (1998). Relative efficiency of three representative matorral species in reducing water erosion at the microscale in a semi-arid climate (Valencia, Spain). Geomorphololgy, 23: 139-150. BUFALO, M., NAHON, D. (1992). Erosional processes of Mediterranean badlands: a new erosivity index for predicting sediment yield from gully erosion. Geoderma. 52: 133-147. CAPOLONGO, D., PENNETTA, L., PICCARRETA, M., FALLACARA, G., BOENZI, F. (2008). Spatial and temporal variations in soil erosion and deposition due to land-levelling in a semi-arid area of Basilicata (Southern Italy). Earth Surface Processes and Landforms, 33: 364-379. CERDÀ, A. (2008). Erosión y degradación del suelo agrícola en España. Universitat de Valencia, Càtedra Divulgació de la Ciencia, Valencia. CHIANG, L., CHAUBEY, I., GITAU, M. W., ARNOLD, J. G. (2010). Differentiating impacts of land use changes from pasture management in a CEAP watershed using the SWAT model. Transactions of ASABE, 53: 1569-1584. CHIRINO, E., BONET, A., BELLOT, J., SÁNCHEZ, J. R. (2006). Effects of 30-year-old Aleppo pine plantations on runoff, soil erosion, and plant diversity in a semi-arid landscape in south eastern Spain. Catena, 65: 19-29. CROUCH, R. J., BLONG, R. J. (1989). Gully sidewall classification: methods and applications. Zeitschrift fur Geomorphologie, 33: 291-305. DAR (2008). Mapa de Sòls (1:25.000) de l’àmbit geogràfic de la Denominació d’Origen Penedès. Departament d’Agricultura, Alimentació i Acció Rural, Generalitat de Catalunya, Vilafranca del Penedès-Lleida. DEROSE, R. C., GÓMEZ, B., MARDEN, M., TRUSTRUM, N. A. (1998). Gully erosion in Mangatu forest, New Zealand, estimated from digital elevation models. Earth Surface Processes and Landforms, 23: 1045-1053. DESCROIX, L., OLIVRY, J. C. (2002). Spatial and temporal factors of hydric erosion in black marls bad lands of the French southern Alps. Hydrological Sciences Journal, 47: 227-242. DUNJÓ, G., PARDINI, G., GISPERT, M. (2004). The role of land use-land cover on runoff generation and sediment yield at a microplot scale, in a small Mediterranean catchment. Journal of Arid Environments, 57: 239-256.. CIG 38 (1), 2012, p. 95-114, ISSN 0211-6820. 111.
(18) Martínez-Casasnovas et al.. GALLART, F. (1981). Neógeno superior y Cuaternario del Penedès (Catalunya, España). Acta Geológica Hispánica, 16: 151-157. GARCÍA-RUIZ, J. M., LANA-RENAULT, N. (2011). Hydrological and erosive consequences of farmland abandonment in Europe, with special reference to the Mediterranean region-A review. Agriculture, Ecosystems and Environment, 140: 317-338. GASSMAN, P. W., REYES, M. R., GREEN, C. H., ARNOLD, J. G. (2007). The soil and water assessment tool: Historical development, applications, and future research directions. Transactions of ASABE, 50: 1211-1250. IBÀÑEZ, J. J., BURRIEL, J. A. (2008). Mapa de cubiertas del suelo de Cataluña: Metodología de la tercera edición. In: Tecnologías de la Información Geográfica para el Desarrollo Territorial. XIII Congreso Nacional de tecnologías de la información geográfica. Las Palmas de Gran Canaria. CD-ROM edition. KOSMAS, C., DANALATOS, N., CAMMERAAT, N. H., CHABART, M., DIAMANTOPOULOS, J., FARAND, R., GUTIERREZ, L., JACOB, A., MARQUES, H., MARTÍNEZ-FERNANDEZ, J., MIZARA, A., MOUSTAKAS, N., NICOLAU, J. M., OLIVEROS, C., PINNA, G., PUDDU, R., PUIGDEFABREGAS, J., ROXO, M., SIMAO, A., STAMOU, G., TOMASI, N., USAI, D., VACCA, A. (1997). The effect of land use on runoff and soil erosion rates under Mediterranean conditions. Catena, 29: 45-59. MANNAERTS, C. M., GABRIELS, D. (2000). Rainfall erosivity in Cape Verde. Soil and Tillage Research, 55: 207-212. MARTÍNEZ-CARRERAS, N., SOLER, M., HERNÁNDEZ, E., GALLART, F. (2007). Simulating badland erosion with KINEROS2 in a small Mediterranean mountain basin (Vallcebre, Eastern Pyrenees). Catena, 71: 145-154. MARTÍNEZ-CASASNOVAS, J. A., POCH, R. M. (1998). Estado de conservación de los suelos de la cuenca del embalse Joaquín Costa. Limnética, 14: 83-91. MARTÍNEZ-CASASNOVAS, J. A., SÁNCHEZ-BOSCH, I. (2000). Impact assessment of changes in land use/conservation practices on soil erosion in the Penedes-Anoia vineyard region (NE Spain). Soil and Tillage Research, 57: 101-106. MARTÍNEZ-CASASNOVAS, J. A. (2003). A spatial information technology approach for the mapping and quantification of gully erosion. Catena, 50: 293-308. MARTÍNEZ-CASASNOVAS, J. A., RAMOS, M. C., POESEN, J. (2004). Assessment of sidewall erosion in large gullies using multi-temporal DEMs and logistic regression analysis. Geomorphology, 58: 305-321. MARTÍNEZ-CASASNOVAS, J. A., RAMOS, M. C., RIBES-DASI, M. (2005). On-site effects of concentrated flow erosion in vineyard fields: some economic implications. Catena, 60: 129-146. MARTÍNEZ-CASASNOVAS, J. A., RAMOS, M. C. (2006). The cost of soil erosion in vineyard fields in the Penedes-Anoia Region (NE Spain). Catena, 68: 194-199.. 112. CIG 38 (1), 2012, p. 95-114, ISSN 0211-6820.
(19) Multi-temporal analysis of sediment yield caused by hydric erosion. MARTÍNEZ-CASASNOVAS, J. A., RAMOS, M. C. (2009). Erosión por cárcavas y barrancos en el área de viña del Alt Penedés-Anoia (NE España). Cuadernos de Investigacion Geografica, 35: 223-238. MARTÍNEZ-CASASNOVAS, J. A., RAMOS, M. C., GARCÍA-HERNÁNDEZ, D. (2009). Effects of land-use changes in vegetation cover and sidewall erosion in a gully head of the Penedès region (northeast Spain). Earth Surface Processes and Landforms, 34: 1927-1937. MUELLER, E. N., FRANCKE, T., BATALLA, R. J., BRONSTERT, A. (2009). Modeling the effects of land-use change on runoff and sediment yield for a meso-scale catchment in the Southern Pyrenees. Catena, 79: 103-111. NEITSCH, S. L., ARNOLD, J. G., KINIRY, J. R., WILLIAMS, J. R. (2005). Soil and Water Assessment Tool, Theoretical information, Version 2005. Texas Water Resources Institute. Temple, Texas, USA. POESEN, J., VANDAELE, K., VAN WESEMAEL, B. (1996). Contribution of gully erosion to sediment production on cultivated lands and rangelands. In: Erosion and Sediment Yield: Global and Regional Perspectives (Walling, D.E., Webb, B.W., ed.), pp 251266, IAHS Press, Wallingford. POTTER, C., HIATT, S. (2009). Modeling river flows and sediment dynamics for the laguna de Santa Rosa watershed in Northern California. Journal of Soil Water Conservation, 64: 383-393. RAMOS, M. C., MARTÍNEZ-CASASNOVAS, J. A. (2004). Nutrient losses from a vineyard soil in Northeastern Spain caused by an extraordinary rainfall event. Catena, 55: 79-90. RAMOS, M. C., MARTÍNEZ-CASASNOVAS, J. A. (2006a). Impact of land levelling on soil moisture and runoff variability in vineyards under different rainfall distributions in a Mediterranean climate and its influence on crop productivity. Journal of Hydrology, 321: 131-146. RAMOS, M. C., MARTÍNEZ-CASASNOVAS, J. A. (2006b). Erosion rates and nutrient losses affected by composted cattle manure application in vineyard soils of NE Spain. Catena, 68: 177-185. RAMOS, M. C., MARTÍNEZ-CASASNOVAS, J. A. (2006c). Nutrient losses by runoff in vineyards of the Mediterranean Alt Penede’s region (NE Spain). Agriculture Ecosystems & Environment, 113: 356-363. RAMOS, M. C., MARTÍNEZ-CASASNOVAS, J. A. (2007). Soil loss and soil water content affected by land leveling in Penedès vineyards, NE Spain. Catena, 71: 210-217. RAMOS, M. C., MARTÍNEZ-CASASNOVAS, J. A. (2009). Impacts of annual precipitation extremes on soil and nutrient losses in vineyards of NE Spain. Hydrological Processes, 23: 224-235.. CIG 38 (1), 2012, p. 95-114, ISSN 0211-6820. 113.
(20) Martínez-Casasnovas et al.. RAMOS, M. C., MARTÍNEZ-CASASNOVAS, J. A. (2010). Soil water balance in rainfed vineyards of the Penedès region (Northeastern Spain) affected by rainfall characteristics and land levelling: influence on grape yield. Plant and Soil, 333: 375-389. REY, F. (2003). Influence of vegetation distribution on sediment yield in forested marly gullies. Catena, 50: 549-562. REY, F., BALLAIS, J., MARRE, A., ROVÉRA, G. (2004). Role of vegetation in protection against surface hydric erosion. Comptes Rendus Geoscience, 336: 991-998. SSS [SOIL SURVEY STAFF] (1999). Soil taxonomy: a basic system of soil classification for making and interpreting soil surveys (2ª ed.). US Department of Agriculture Soil Conservation Service, Washington, D.C. TROPEANO, D. (1983). Soil erosion on vineyards in the Tertiary Piedmontese basin (northwestern Italy): studies on experimental areas. Catena Supplement, 4: 115-127. VALENTIN, C., POESEN, J., LI, Y. (2005). Gully erosion: Impacts, factors and control. Catena, 63: 132-153. VANDEKERCKHOVE, L., POESEN, J., OOSTWOUD WIJDENES, D. J., GYSSELS, G., BEUSELINCK, L., DE LUNA, E. (2000). Characteristics and controlling factors of bank gullies in two semi-arid Mediterranean environments. Geomorphology, 33: 37-58. WICHEREK, S. (1991). Viticulture and soil erosion in the North of Parisian Basin. Example: The Mid Aisne Region. Zeitschrift für Geomorphologie N.F., Suppl.-Bd., 83: 115-126. WILLIAMS, J. R. (1975). Sediment-yield prediction with universal equation using runoff energy factor. In: Present and prospective technology for predicting sediment yield and sources: Proceedings of the sediment yield workshop, pp. 244-252. USDA Sedimentation Lab, Oxford, MS. WISCHMEIER, W. H., JOHNSON, C. B., CROSS, B. V. (1971). A soil erodibility nomograph for farmland and construction sites. Journal of Soil and Water Conservation, 26: 189-193. WISCHMEIER, W. H., SMITH, D. D. (1978). Predicting rainfall losses: A guide to conservation planning. USDA Agricultural Handbook No, 537, U.S, Gov, Print, Office, Washington, D.C. ZUCCA, C., CANU, A., PREVITALI, F. (2010). Soil degradation by land use change in an agropastoral area in Sardinia (Italy). Catena, 83: 46-54.. 114. CIG 38 (1), 2012, p. 95-114, ISSN 0211-6820.
(21)
Figure
+7


Related documents
Suryanarayana et al., [4] carried outanalysis of G+15 RCC and composite structure by response spectrum and equivalent static methods having a soft storey at
In this study, in parallel with the total heterotrophic bacteria that colonize water- treatment systems, comprising the current recommendation according to the AAMI standards, we
Synthesis of bimetallic nanoparticles is using inorganic layered materials which also predominantly role in stabilization as well as catalytically activity because of
As the 14 genes selected in this study were previously shown to be upregulated during protein secretion, our results indicate that increased expression may be a way for the cell
Then, effective values have been calculated and indexed by incorporating the green space and socio- cultural facility values and the effectiveness change values
He’d cheated on her before, and every time she’d found out, she’d accepted his apology even though a part of her knew she hadn’t forgiven him.. Accepting was easier when the acts
Dishington, Erin, "The role of orphan nuclear receptor DAX-1 (NR0B1) in human breast cancer cells: expression, proliferation and metastasis"
Telomere length and telomerase activity in non-small cell lung cancer prognosis: clinical usefulness of a specific telomere status.. Tamara Fernández-Marcelo 1,4 , Ana Gómez 2,4 ,
