Optimization of Electricity Generation Schemes in the Java-Bali Grid System
with Co
2Reduction Consideration
Farizal
1, Wenty Eka Septia
1*, Amar Rachman
1, Nasruddin
2, and Teuku Meurah Indra Mahlia
31.Department of Industrial Engineering, Universitas Indonesia, Depok 16425, Indonesia 2.Department of Mechanical Engineering, Universitas Indonesia, Depok 16425, Indonesia
3.Department of Mechanical Engineering, Universiti Tenaga Nasional, Selangor,43650 Bandar Baru Bangi, Malaysia *
e-mail: [email protected]
Abstract
This research considers the problem of reducing CO2 emissions from the Java-Bali power grid system that consists of a variety of power-generating plants: coal-fired, natural gas, oil, and renewable energy (PV, geothermal, hydroelectric, wind, and landfill gas). The problem is formulated as linear programming and solved using LINGO 10. The model was developed for a nation to meet a specified CO2 emission target. Two carbon dioxide mitigation options are considered in this study, i.e. fuel balancing and fuel switching. In order to reduce the CO2 emissions by 26% in 2021, State Electric Supply Company (PLN) has to generate up to 30% of electricity from renewable energy (RE), and the cost of electricity (COE) is expected to increase to 617.77 IDR per kWh for a fuel balancing option, while for fuel switching option, PLN has to generate 29% of electricity from RE, and the COE is expected to increase to 535.85 IDR per kWh.
Abstrak
Optimasi Skema Pembangkitan Listrik pada Sistem Jaringan Listrik Jawa-Bali dengan Memperhatikan Aspek Pengurangan Emisi CO2. Penelitian ini membahas tentang masalah pengurangan emisi CO2 dari jaringan listrik Jawa-Bali yang pembangkitnya terdiri dari kombinasi berbagai jenis pembangkit yaitu: batubara, gas alam, minyak, dan energi terbarukan RE (yang meliputi solar cell, panas bumi, tenaga air, angin, dan gas dari sampah). Permasalahan dimodelkan dengan programa linier dan dipecahkan dengan menggunakan bantuan perangkat lunak LINGO 10. Dalam penelitian ini digunakan dua opsi pengurangan emisi CO2, yaitu keseimbangan bahan bakar (fuel balancing) dan penggantian bahan bakar (fuel switching). Hasil penelitian menyebutkan bahwa untuk mencapai target pemerintah yaitu pengurangan emisi CO2 hingga 26% di tahun 2021, Perusahaan Listrik Negara (PLN) harus membangkitkan listrik hingga 30% dari sumber energi terbarukan dan dengan biaya listrik (cost of electricity COE) akan meningkat menjadi Rp. 617.77 per kWh untuk opsi fuel balancing, sedangkan untuk opsi fuel switching, PLN harus membangkitkan listriknya sebesar 29% dari RE dan dengan COE diperkirakan meningkat menjadi Rp. 535.85 per kWh.
Keywords: linear programming, electricity generation, CO2 mitigations, renewable energy.
1.
Introduction
Fossil fuels burning contributes 80% of the energy consumption in the world (UNFCCC, 2008). Burning of fossil fuels produces green house gases (GHG) that cause global warming and destroy the earth. GHG emissions which result from fossil fuels burning have increased extensively over the past two decades. Since 2009, many countries have committed to reduce GHG emissions by 2020 with the aim of inhibiting the pace of global warming (UNEP, 2011). Indonesia is among the five emitters of GHG in the world. In 2000, Indonesia was accounted for 12% of the world's GHG emissions, an increase of 27% from 1990 levels (Globe International,
2011). To reduce regional GHG emissions, Indonesian government's was issuing the Presidential Regulation No.61 of 2011 on the reduction of GHG by 2020 by 26% on their own effort or as high as 41% with the international assistance.
growth in emissions. When the total emissions grew about 7.5 percent per year, emissions from electricity grew at about 11 percent per year over the last two decades.
Given the growth in power generation capacity and the increase of CO2 emissions in Indonesia, it makes sense to require a power generation capacity expansion plan to have to meet the electricity needs while reducing overall CO2 emissions at the same time. Therefore, this study aims to obtain an optimization model to minimize the cost of power generation and CO2 emission reduction targets using a mix of fossil fuels and renewable energy. The research question in this study will be: "With the CO2 reduction target, what are the best mixed power generation plants in Indonesia with the minimum cost but those have to meet future electricity needs?
Some previous researchers have developed models of energy power generation technologies in the context of emissions reductions. Rubin et al. (2005) developed the Integrated Environmental Control Model/Integrated Environmental Control Model (IECM) as a comparative analysis of various environmental controls for fossil-fueled power plants. The model was built in a modular fashion that allows the new technology to be incorporated into the overall framework. Then the user can configure and evaluate a specific environmental control system design. Environmental control options include a variety of conventional and advanced systems to control SO2, NOx, CO2, particulate matter, and mercury emissions. The IECM framework is expanded to include a wider array of options and power generation systems of multi-pollutant carbon management.
Han (2012) planned a power plant based on CO2 mitigation (Carbon Emission Trading & Carbon Capture and Storage). The goal is maximizing total benefits and minimizing the financial risk while meeting power needs. Trade off between risks and profits is taken into consideration in the model. Bai and Wei (1997) developed a linear programming model to evaluate the effectiveness of CO2 mitigation options for the electricity sector in Taiwan. Strategies include alternative fuels, reducing the peak load, energy conservation, improved efficiency of power generation, and CO2 capture technologies. The result shows that the combination of peak production declines and increases efficiency of power plants with CO2
conservation, without considering the cost-effectiveness, an effective strategy to reduce CO2 emissions significantly.
Iniyan et al. (2006) developed a linear program to determine the optimal allocation of final energy by a variety of environmental constraints. The paper estimates that the demand and supply of energy for 2020 will be using the econometric model. The gap between energy demand and energy supply will be met by renewable energy by using models Optimal Renewable Energy Mathematical (OREM) based on cost, efficiency, social acceptance, reliability, potential of renewable energy, and energy requirements. The scope of the renewable energy that exists in this paper is limited to a few types of renewable energy.
Hashim (2005) developed a model using Mixed Integer Linear Programming (MILP) and implemented in GAMS (General Algebraic Modeling System) to reduce CO2 emissions from the electricity grid contained in Ontario. The number of different power generation plants, such as coal, natural gas, nuclear, hydroelectric, and alternative energy, is to be variable. The model is applied in three different operating modes: (1) economic mode, (2) environmental mode, and (3) integrated mode. The integration model combines the goals of both economic and environmental modes using an external pollution index as a conversion factor to the cost of pollution. However, the analysis in this paper is that the static what? is constant, while for the demand for the electricity supply in the real situation there is a high variability in the electricity demand. The optimization model for renewable energy generation for the country has also been studied by Cong (2012). Cong proposed a new model, Renewable Energy Optimization Mode (REOM) combined with a model of the learning curve, technology diffusion models and prospects for economic development in the future to analyze the development of the three sources of renewable energy (wind power, solar power, and biomass energy) in China.
The purpose of this paper is to determine the maximum possible capacity of various sources of renewable energy generation in order to plan the construction of the power grid including environmental aspects in the study.
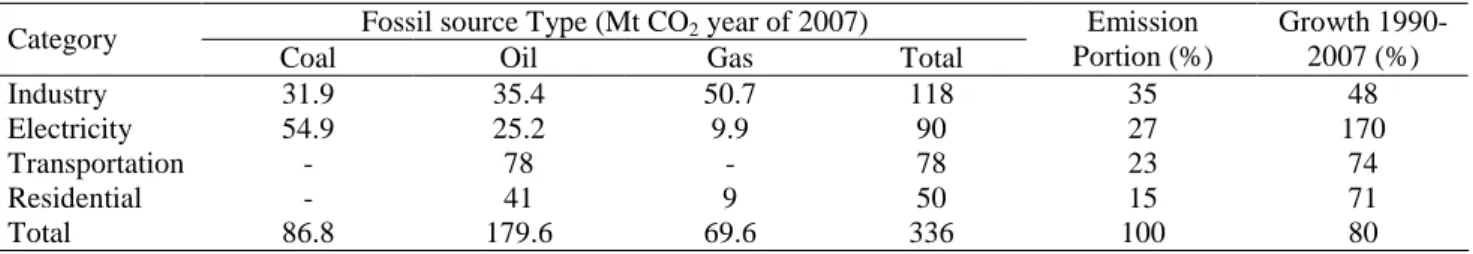
Table 1. Emission per Sector in Indonesia
Fossil source Type (Mt CO2 year of 2007) Category
Coal Oil Gas Total
Emission Portion (%)
Growth 1990-2007 (%)
Industry 31.9 35.4 50.7 118 35 48
Electricity 54.9 25.2 9.9 90 27 170
Transportation - 78 - 78 23 74
Residential - 41 9 50 15 71
From a variety of existing research, it is clear that GHG emission and economic aspects should be considered in evaluating the power generation mix with a different power supply. The holistic analysis needs to be done in order to meet the ever demand increase for electrical energy supply with respect to environmental and economic aspects. Indonesia should find a sustainable energy mix in order to realize the challenges of the future. Therefore, renewable energy, such as solar, wind, geothermal, and biomass, has been introduced as a mitigation strategy to reduce CO2 emissions (Hasan et al., 2012).
2.
Methods
Superstructure development.The superstructure concept represents all possible configurations of alternative electrical energy. The concept can be very complex if the sources have many varieties. Units of fossil power plant energy sources that were analyzed in this study include: coal, natural gas, petroleum. Petroleum further consists of high speed diesel, HSD & marine fuel oil, and MFO. Moreover, the renewable energy power generation sources include solar, geothermal, hydro, wind power, and biomass. Six types of new generating unit candidates in this study are: geothermal plant, solar farm, biomass plant, hydro, wind plant, and ultrasupercritical (pulverized) coal plant.
For the purpose, two CO2 mitigation strategies are applied: Fuel Balancing (base model) and Fuel Switching. In the fuel balancing strategy, the operation of the two plant types, i.e. fossil-fueled plant and renewable energy plant, will be adjusted to meet the energy demand. When the CO2 reduction targets are put in the constraint, power plants that produce low emissions, such as hydroelectric and geothermal power plants, will be prioritized to get into the power system. Fuel switching strategy will change the use of petroleum gas in the power plant, combined cycle and gas engine (PLTMG). Direct fuel switching will also reduce CO2 emissions because they have lower gas emissions than petroleum emission factors. When the fuel of the power plants is switched, there will be no cost to retrofit or to replace the technologies, but it will be additional investment for installing gas pipelines and gas tank.
Mathematical model. This study has adopted a mathema-tical model proposed by Muis et al. (2010). The model consists of an objective function and twelve constraints. This model was implemented for the Java-Bali interconnection system that takes into consideration the operating cost of the existing generating units and the investment costs of new units while at the same time fulfilling the CO2 reduction targets. For the purpose, the objective function of the model is to minimize the cost of electricity generation which consists of the operating cost in place units and investment costs and operating
costs of new generating units. The objective function of the model is represented on Equation 1.
The complete mathematical model is as follows:
(
)
(
)
(
NewO&MPP)
E M PP New t cos n Investatio y E S PP M & O Operation E V E V Z new p New p new p p new p New p new p j ij ij NF i j ij ij F i∑
∑
∑
∑
∑
∑
∈ ∈ ∈ ∈ + + + = min (1) Demand E E E NFi i F j
ij New p New p NF
i ≥
+ +
∑
∑
∑ ∑
∈ ∈ ∈ (2) j , F i X EEij ≤ ijmax ij' ∀ ∈ ∀ (3)
NF i , E
EiNF ≤ imax ∀ ∈ (4)
New p , y E
ENewp ≤ maxp i ∀ ∈ (5)
j , F i X l
Fij ≥ ij× ij' ∀ ∈ ∀ (6)
NF i , l
Fi ≥ i ∀ ∈ (7)
New ,
y l
Fp ≥ p× p ∀p∈ (8) F i , E f
Eij = ij imax ∀ ∈ (9)
NF i , E f
Ei= i imax ∀ ∈ (10)
New i , y E f
Ep= p maxp p ∀ ∈ (11)
∑
∑
∈ ∈ ≤ + new C p p new p new p F ij F i ijFij E CO E CO lim
CO2 2 2 (12)
New p , R E
VpRE REp ≤ p ∀ ∈ (13)
Index: i = power plants in the Java-Bali grid system
where I = 1, 2, …, 84
j = plant fuel type where j = 1, 2, …, 9
p = a new power plant candidate where p = 1,
Sets: F = for a fossil power plant where F = 1, 2,
…, 35.
NF = non fossil power plant where NF = 1, 2, …., 49.
New = for a new power plant where New = 1,
2, …, 33.
Binary Variables:
{
, plantiisoperated with fuel j otherwise ,ij
x
01{
, newplant iis operated}
otherwise ,
i
y
01Decision Variables:
=
ijE
actual electricity generated from plant i with fuel type j (in MWh)=
new p
E
electricity generated from new plant p (in MWh)Parameters:
=
ij
V
O&M costs of existing power plants i with fuel type j (IDR/MWh)=
new i
S
Capital cost of new power plants i (IDR/MWh)=
new i
M
O&M cost of new power plants i (IDR/MWh)=
ijR
the fuel switching cost from coal to natural gas (IDR/MWh)l
i(l
ij) =
the annual minimum capacity factor of theplants
fi (fij) = the annual capacity factor of plant i
CO2ij = CO2 emission from the i plant with fuel j over the generated electricity (ton CO2/MWh)
CO2p = CO2 emission from a new plant (ton CO2/MWh)
=
RE i
V
the conversion factor from the RE plant toelectricity for fuel type j (ton/MWh) R p = RE availability for new plant p
Equations (2)–(13) are the constraints of the model. Equation (2) is electricity demand constraint. This constraint will make sure that the electricity needed in the year 2021 will be fulfilled by both existing and new plants. In this case, the electricity generated is set at least the same as the demand. Equations (3)–(5) are operational constraints that state that the electricity produced by all plants should not exceed the full installed capacity. Equations (6)–(8) are a lower bound operational constraint. The annual capacity factor of each plant must be greater than a certain minimum value; otherwise, the plant will be shut down. Equations (9)–(11) relate between the annual capacity factor and electricity generated. Equation (12) restricts each plant, either the existing or the new ones, should emit CO2 emissions less than a specified government target. Mean-while, the last equation, equation (13), is RE availability constraint. Energy from renewable resources cannot exceed the availability of renewable energy resources. Data collection. Data collected for this study were electricity demand, CO2 emissions for each existing and new plant, actual electricity production, O&M costs, fuel costs, fuel swiching costs and investment costs, plant capacity factors. These data were projected for the year 2021. 2021 is the year when the 26% emission target is set to be reached.
3.
Results and Discussion
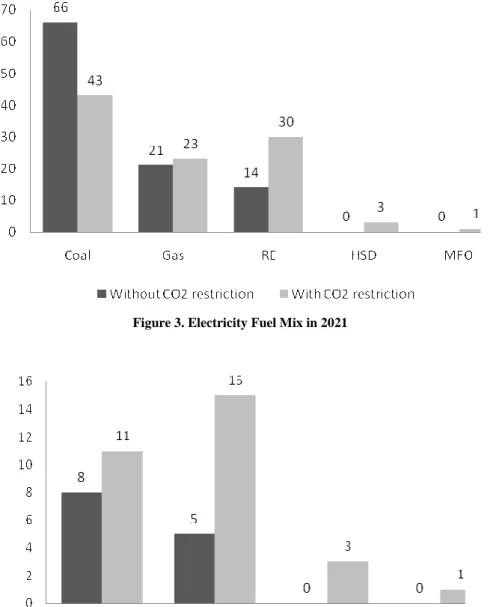
Electricity mix optimization of a fuel balancing strategy. For a fuel balancing strategy, the cost of electricity (COE) is 451.87 IDR/kWh with the total CO2 emissions in 2021 of 212,540,143.30 tons. This value is slightly better than the PLN’s RUPTL (state owned electricity company’s electricity long range plan) which is 214 million tons. When the CO2 reduction is impossed, the COE is obtained as 617.765 IDR per kWh with CO2 emissions as 158,360,000.00 tons. Imposing CO2 reduction is indeed reducing the emissions, but it increases the electricity price.
Electricity fuel mix results and RE fuel mix results are shown in Figures 3 and 4, respectively.
Figure 3. Electricity Fuel Mix in 2021
Figure 4. RE Fuel Mix in 2021
Further explanation is depicted from Figure 4. Not only does the portion of RE fuels increase,but the fuel type is also more diverse. When the 26% reduction is impossed, solar and biomass appear as fuel alternatives besides geothermal what? and hydroelectric what? However, suppressing CO2 emission is not free. The trade off is a higher electricity price. In this scenario, petroleum in a form of HSD and MFO is still used since they release less CO2 emissions than coal, even though their fuel prices are higher.
For the electrical energy mix, NRE generation tech-nologies contribute up to 30% of the total electrical energy utilization. Utilization of NRE mostly comes from existing plants that have been in operation before,
such as the hydroelectric and geothermal power plants and from the development of new generating units, such as hydropower, geothermal, wind, and Biomass plants. Utilization of solar energy as electrical energy only comes from purchasing electricity from IPP.
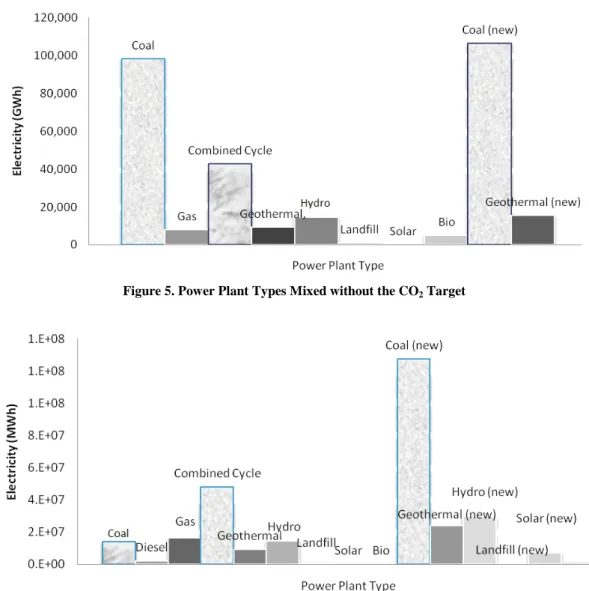
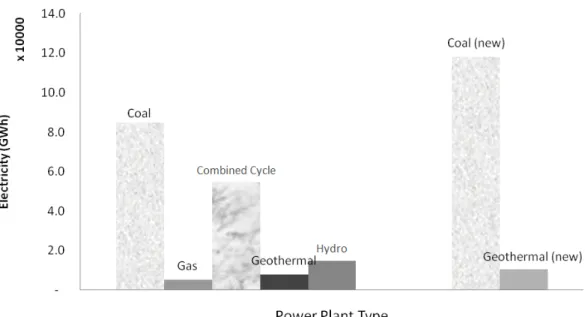
Figure 5. Power Plant Types Mixed without the CO2 Target
Figure 6. Power Plant Mixed with 26% of the CO2 Target
When CO2 emissions are applied, the energy mix is composed with more diverse sources as shown in Figure 6. With this option, a combined cycle plant that produces less GHG emission dominates the energy mix, and even a diesel plant contributes to the energy mix. However, when considering new plant expansion, this emission restriction forces the utility company to utilize more NRE sources, such as geothermal power, hydro power, and solar plants as well. As a result, new coal plants just contribute 67% of the total new plants compared to 80% when the restriction is relaxed.
Electricity mix optimization of the fuel switching strategy. PLN plans to transform an oil based power plant to a gas power plant, combined cycle and gas engine plants. This fuel switching strategy will directly reduce CO2 emissions because of the lower gas emissions than the petroleum CO2 emission factor.
The COE when the fuel switching strategy is implemented is 434.62 IDR/kWh. This COE is a bit less than the
COE of the fuel balancing strategy mentioned earlier. For the fuel switching strategy, the investment cost includes gas pipelines installation to transport the gas from transmission pipelines closest to the plant and tanks. The length of gas pipelines to be installed to connect 11 units and a combined cycle power plant is about 584 miles long. For this strategy, the CO2 emissions produced by 2021 are estimated to become 214,000,000 tons. When this strategy is coupled with implementing the emission reduction target, the COE is 535.85 IDR/kWh and with the CO2 emissions going down to 158,360,000 tons.
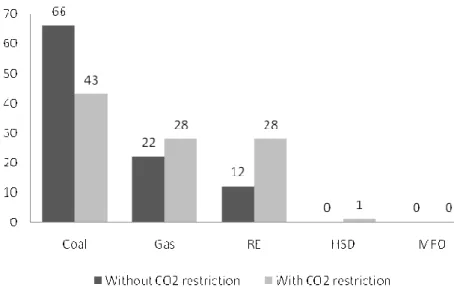
The electricity mix fuel switching strategy is shown in Figure 7 and Figure 8.
CO2 is put into the system constraints. Utilization of natural gas also increases from 22% to 28%. The increased use of natural gas as fuel due to substitution of petroleum fuels in a combined cycle power plant and natural gas. The use of petroleum is as fuel electricity generation using only petroleum type High Speed Diesel (HSD) by 1% because there are some steam generating units that are still using HSD as fuel as well as coal. Therefore, some operating power plants using coal instead of the HSD given emission factor of coal generate higher emission? (this sentence is confusing! Power plants are higher than emissions? That does not make sense!) than the emission factor of HSD.
To meet CO2 reduction targets, PLN prioritizes power plants with low fuel emission plants, such as natural gas
and RE generation technologies, i.e. hydroelectric and geothermal plants, and even the trade-off is a higher electricity price. Figure 8 shows that the geothermal plant percentage is almost twice the CO2 restriction applied. Even hydro plant utilization becomes triplet with this scenario.
Mix types of power plants are shown in Figures 9 and 10. At the conditions of business as usual, in Figure 9, the dominated plant is the power plant that has been operating to produce electricity. This is because the installed capacity plant is greater than the capacity of other plant types. For the new development, the result is not that different from the fuel balancing strategy.
Figure 7. Fuel Switching Electricity Generation Mix
Figure 9. The power Plant Mix with the Fuel Switching Strategy
Figure 10. The Fuel Switching Strategy Power Plant Mix with 26% of the CO2 Target
However, to achieve CO2 emission reduction targets, existing generating units produce less electricity. This is because the units already in operation are generally dominated by fossil fuel, such as coal, natural gas, and oil that emit large CO2 emissions when operated. The use of a combined cycle plant becomes dominant because the entire combined cycle fuel produces low-emission than natural gas. Comparing Figures 6 and 10, the fuel switching strategy is about 2% on using a coal plant for new plants.
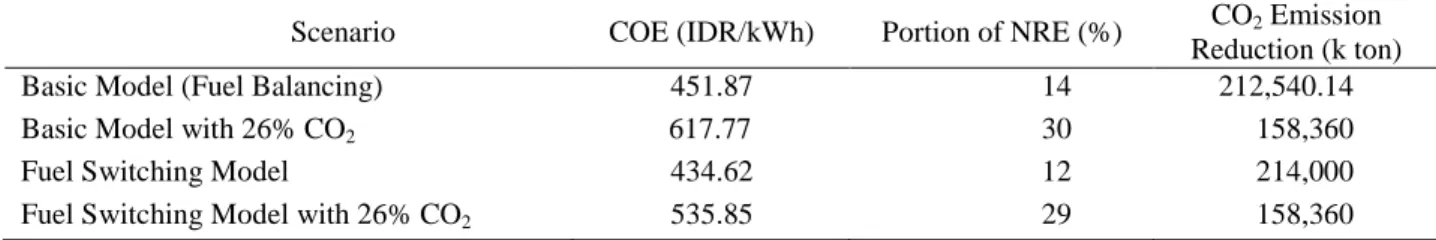
Table 2 shows the summary of each scenario. For both scenarios, imposing the CO2 restriction drives to use more NRE sources of energy. For both scenarios, the NRE portions become double. These conditions furthermore
Table 2. Result Summary
Scenario COE (IDR/kWh) Portion of NRE (%) CO2 Emission
Reduction (k ton)
Basic Model (Fuel Balancing) 451.87 14 212,540.14
Basic Model with 26% CO2 617.77 30 158,360
Fuel Switching Model 434.62 12 214,000
Fuel Switching Model with 26% CO2 535.85 29 158,360
4. Conclusions
The mathematical model developed for configurating the type of planning power plants and energy sources can be used as a tool to achieve government target to reduce CO2 emissions by 26% by 2021. Using the model, the lowest electricity cost to meet the electricity demand of the grid and at the same time fulfilling the CO2 reduction target is 535.85 IDR/kWh. This COE is achieved though utilizing fuel switching strategy.
Lifting up the utilization of NRE as electrical energy source will reduce CO2 emissions on one hand but it will increase COE. While fuel strategy or fuel switching from oil to natural gas in power generation unit will reduce the COE, but on the other side it will reduce the portion of NRE utilization.
References
[1] H. Bai, J-H. Wei, Energy Policy. 24/3 (1996) 221. [2] BAPPENAS, Development of the Indonesian
NAMAs Framework, 2012.
[3] R-G. Cong, Renew. Sust. Energ. Rev. 17 (2013) 94.
[4] ESDM, Realisasi Produksi Listrik tahun 2012, Dirjen Listrik dan Pemanfaatan Energi, Jakarta, 2012. [In Indonesia]
[5] M.H. Hasan, T.M.I. Mahlia, H. Nur, Renew. Sust. Energ. Rev. 16 (2012) 2316.
[6] H. Hashim, P. Douglas, A. Elkamel, A. Croiset, Ind. Eng. Chem. Res. 44 (2005) 879.
[7] Indonesia Power, Indonesia Power Annual Report 2012, 2013.
[8] S. Iniyan, L. Suganthi, A.A. Samuel, Energy Policy 34 (2006) 2640.
[9] P. Linares, C. Romero, Int. J. Manage. Sci. 30 (2002) 89.
[10] G. Mavrotas, Int. Trans. Oper. Res. 6 (1999) 231. [11] Z.A. Muis, H. Hashim, Z.A. Manan, F.M. Taha,
Renew. Energ. 35 (2010) 2562.
[12] Peraturan Presiden No 61 tahun 2011, Rencana Aksi Nasional Penurunan Emisi Gas Rumah Kaca, Republik Indonesia, 2011. [In Indonesia]
[13] PLN, Rencana Usaha Penyediaan Tenaga Listrik 2012-2021. PT PLN, Jakarta, 2012. [In Indonesia] [14] PLN, Statistik PLN . PT PLN, Jakarta, 2012. [In
Indonesia]
[15] PT PJB, PT PJB Annual Report, 2013. [In Indonesia]
[16] United Nations Environment Programme, UNEP Year Book 2012 Emerging Issues in Our Global Environment, UNEP, Nairobi, 2012.