122
RESULTS REGARDING THE EFFECT OF PEAS IN THE COWS’
RATION ON THE FORAGE EFFICIENCY
COLĂ MUGUREL, COLĂ FLORICA
Key words: forage, protein, peas, ration, soybean meal
ABSTRACT
The forage consumption higher than the one necessary for the support functions determines an increase of the milk production corrected to 3.5% fat and of the forage efficiency from 1.29 to 1.93, corresponding to the increase with once to five times of the forage consumption. Unfortunately, the increase of the forage consumption also affects the ration digestibility. In this case, the digestibility decreases with almost 3 digestible units or 0.03 Mcal/kilogram.
REZUMAT
Consumul de furaje mai mare decât cel necesar pentru funcţiile de întreţinere determină o creştere a producţiei de lapte corectată la 3,5% grăsime şi a eficienţei furajere de la 1,29 la 1,93, corespunzătoare creşterii cu o dată până la cinci ori a consumului de furaje.
Din nefericire, creşterea consumului de furaje, de asemenea, afectează digestibilitate raţiei. În acest caz digestibilitatea scade cu aproape 3 unităţi digestibile sau 0,03 Mcal/kilogram.
INTRODUCTION
For supporting the high performance levels of the milk cows, the forage rations should provide both the synthesis maximization of the microbial nutrients of the structural carbohydrates at the rumen level and the necessary bypass nutrients directly to the small intestine. The protean sources used in the forage concentrates for the milk cows are few, including here mainly the soybean meal, the sunflower meal and soya beans. The protean alternative sources are very necessary for partially or totally replacing soybean meal.
Peas may be considered as a forage source having a double role for its content of protein and energy. If we compare it to soya, the peas protein is richer in lysine, and if we combine it with maize, we may avoid the methionine deficit.
The ruminal degradability and the soluble fractions are higher for peas in report to soybean meal. Investigations are necessary in order to include peas as a protean source for the partial replacement of soybean meal in the milk cows’ rations.
The simplest measure of the forage efficiency is the report between the kilograms of milk accomplished per kilogram of dry substance consumed by the milk animal.
MATERIAL AND METHOD
The purpose of this research referred to the evaluation of the effect of partially replacing the soybean meal and the grain maize by peas, on the forage efficiency.
The experiment was developed in 2011 at S.C.D.A. Şimnic-Craiova and it contained 6 Holstein Friza cows, at the second lactation. Two forage rations were formulated, a control one and an experimental one. (Table 1)
The forage efficiency (EF) of the peas ration.
The forage efficiency of the milk cows is a measure of converting the forage nutrients into milk. The simplest measure of the forage efficiency is the report between the achieved kilograms of milk and the consumed kilogram of dry substance. This report is an estimation of the efficiency by means of which the consumed energy (“input”) appears as milk production (“output”).
123
Table 1
Ingredients of the ration and chemical composition
Ingredientes Ration (% of the dry substance)
Control Experimental
Lucerne hay 27,0 27,0
Maize silo 25,0 25,0
Grain maize 19,0 11,5
Soybean meal (48 % PB) 7,4 1,6
Peas - 15,0
Brewery mash 7,0 6,0
Grain barley 12,5 11,8
Vitamin-mineral premix 2,1 2,1
Composition
Gross protein 15,6 15,2
Neutral detergent fibre 35,0 38,1
Whereas the “output” energy quantity known as milk varies depending on the fat content of the milk, for the measuring of the forage efficiency, we used the kilogram of milk corrected for the fat content. This is an adjustment to a standardized value (for example, to 3.5% or 4% fat). The analysis of the forage efficiency of the milk cows with rations including peas is made depending on the lactation stage, the forage digestibility and the fibre content of the ration.
RESULTS AND DISCUSSIONS
It has been recently established for the report between the milk quantity corrected to fat and the S.U. quantity consumed by the milk animals to be used as the index of the forage efficiency
Forage efficiency = the milk quantity corrected for fat / consumed S.U.
Most of the farms monitor the S.U. consumption, the milk production and the milk composition. In these conditions, we may calculate milk values corrected with 3.5% or 4% fat. The calculation formulas for milk corrected in fat were made with standardization means of the milk production based on the energetic equivalence necessary for the genetic analyses. The milk fat represents 50% or more of the energetic milk content, and the fat is the most variable content of milk, both regarding the race and between the races or across the lactation of a cow. The calculation formulas for the milk corrected in fat were made based on the milk combustion energy, namely:
E (Mcal/kg) = 109.21 x milk quantity x (2.66 + % fat) For the milk having a content of 4% fat:
E (Mcal/kg) = 109.21 x milk quantity x (2.66 + 4) = 109.21 x milk quantity x 6.66 = 727 Kcal/kg = 0.727 Mcal/kg.
For standardizing the milk production to the milk energetic constant value with 4% fatt:
It was decided to round off the values:
Concentrated milk 4% =0.4 x kg of milk +15 x kg of fat. In our case:
1) Concentrated milk with 4% fat = 0.4 x 34.7 +15 (34.7 x 3.5%) =13.88+18.15 =32.03 kg of milk for the control lot;
2) Corrected milk with 4% fat = 0.4 x 35.4 + 15(35.4 x 3.6%) = 14.16 + +19.11 = 33.27 kg of milk for the experimental lot.
124
percentage. In this case, the formula is:
Corrected milk with 3.5% fat = 0.4318 x kg of milk + 16.23 x kg of fat. In our case:
1) corrected milk with 3.5% fat =0.4318 x 34.7 + 16.23 (34.7 x 3.5%) = 14.98 + 19.63 =34.61 kg of milk for the control lot and,
2) corrected milk with 3.5% fat = 0.4318 x 35.4 + 16.23(35.4 x 3.6%) =15.28 = 20.61 = 35.89 kg of milk for the experimental lot.
The effect of the S.U. consumption of the forage efficiency
The milk cows that consume more will give more milk. As a result, both the consumption and the production increase, and so does the forage efficiency.
The reason of the improvement of the forage efficiency is that a bigger part of the forage consumption is used for the milk production and a smaller part is used for the supporting function. This is shown in figure 1, where the effects of the consumption on digestibility were not adjusted.
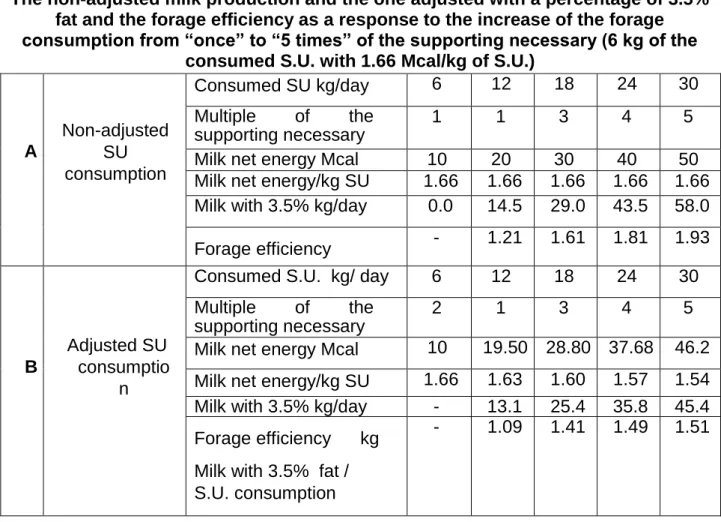
The forage consumption higher than the one necessary for the supporting functions determines an increase of the milk production corrected to 3.5% fat and of the forage efficiency from 1.29 to 1.93, corresponding to the increase with once to five times the forage consumption.
Unfortunately, the increase of the forage consumption also affects the ration digestibility. In this case, the digestibility decreases with almost 3 digestible units or 0.03 Mcal/kilogram
Of net energy of milk for every multiple of the supporting necessary. This is shown in table 2.
Table 2
The non-adjusted milk production and the one adjusted with a percentage of 3.5% fat and the forage efficiency as a response to the increase of the forage consumption from “once” to “5 times” of the supporting necessary (6 kg of the
consumed S.U. with 1.66 Mcal/kg of S.U.)
A
Non-adjusted SU consumption
Consumed SU kg/day 6 12 18 24 30
Multiple of the supporting necessary
1 1 3 4 5
Milk net energy Mcal 10 20 30 40 50 Milk net energy/kg SU 1.66 1.66 1.66 1.66 1.66 Milk with 3.5% kg/day 0.0 14.5 29.0 43.5 58.0
Forage efficiency - 1.21 1.61 1.81 1.93
B
Adjusted SU consumptio
n
Consumed S.U. kg/ day 6 12 18 24 30
Multiple of the supporting necessary
2 1 3 4 5
Milk net energy Mcal 10 19.50 28.80 37.68 46.2
Milk net energy/kg SU 1.66 1.63 1.60 1.57 1.54 Milk with 3.5% kg/day - 13.1 25.4 35.8 45.4
Forage efficiency kg
Milk with 3.5% fat / S.U. consumption
125
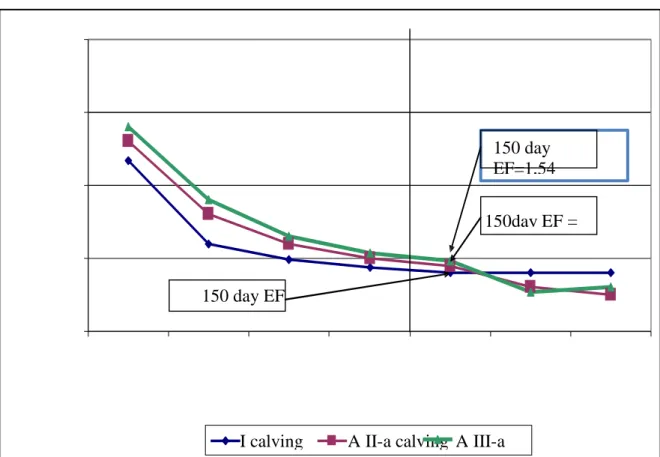
I calving A II-a calving A III-a calving
150 day EF=1,54
150 day EF =1,44 1,44
150day EF =
1,44
From the table, it results that, for each multiple of the supporting necessary, the
milk net energy decreases from
1.66 Mcal/kg of S.U. to 1.54 Mcal/kg of S.U. As a consequence, the forage efficiency increases from 1.09 to 1.51 as a response to the increase of the S.U. consumption from “once” to “5 times” the necessary for supporting the vital functions.
We should mention the fact that the forage efficiency is very low, more than “4 times” the supporting necessary (1.49 in report to 1.52). This response shows the fact that a very high milk production does not determine a very high forage efficiency.
For establishing certain standard values of the forage efficiency, we need several operations, starting with the accomplishment of the lactation curves for the milk production, for the fat percentage and for the milk production corrected to 3.5% fat percentage.
The S.U. consumption may be recalculated by using the NRC formulas (2001) across the recalculated lactation curve. The forage efficiency is calculated by using the presented formulas.
Figure 1 presents the effect of the number of the animal’s lactation and of the lactation days on the forage efficiency to a herd of Holstein cows having a production of 9,800 kilograms of milk.
Figure 1. The effect of the number of the animal’s lactationon the forage efficiency
The factor affecting the forage efficiency is the lactation stage. The forage efficiency decreases from about 2.25 at the beginning of the lactation to 1.30 at the end of the lactation.
The fast decrease of EF after calving occurs due to following factors.
1. After calving, cows have a negative energetic balance so that a part of the milk quantity is made of the energy mobilized from the corporal tissues, not from forage.
126
consequence, the forage efficiency decreases. When the S.U. consumption reaches the peak, the EF decreases linearly up to 100 days of lactation.
The forage efficiency is higher when animals pass from lactation I to lactation II or III, due to the increase of the milk production.
Because of the fast decrease of EF at the same time with the increase of the S.U. consumption, the evaluation at the beginning of the lactation (under 60 days of lactation) has a reduced signification. A very high efficiency at the beginning of the lactation is a consequence of the use of the energy from the corporal tissues for supporting the milk production and it reflects a higher weight loss and a very reduced forage consumption.
Generally, the maximum S.U. consumption occurs at 100 days p.p., and EF decreases linearly until the end of the lactation. This allows the determination of the forage efficiency adjusted to the number of lactation days of a herd or group of cows.
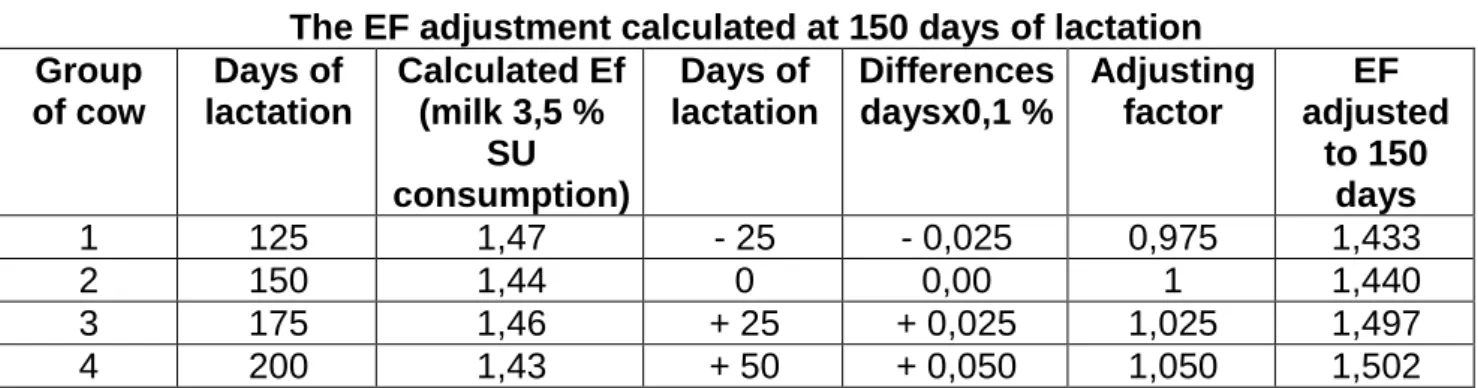
It was established that the EF decrease after 100 days of lactation is about 0.1% daily. The conversion of a current EF to the EF at 150 days of lactation is made by decreasing the number 150 from the current number of days in lactation, correcting the EF with or without 0.1% daily.
Table 3. Shows the correction to 150 of the EF for 4 groups of cows.
Table 3
The EF adjustment calculated at 150 days of lactation Group
of cow
Days of lactation
Calculated Ef (milk 3,5 %
SU
consumption)
Days of lactation
Differences daysx0,1 %
Adjusting factor
EF adjusted
to 150 days
1 125 1,47 - 25 - 0,025 0,975 1,433
2 150 1,44 0 0,00 1 1,440
3 175 1,46 + 25 + 0,025 1,025 1,497
4 200 1,43 + 50 + 0,050 1,050 1,502
The forage-related factors may influence the EF. The actual management of the forage resources is the most important method for improving the use of forage.
To 1.55 for the experimental lot, respectively with 0.05 units.
This is explained by the fact that, by introducing peas into the ration, the fibres in the ration are better used. The peas starch has a slow degradability and there is no decrease of the ruminal pH. In conclusion, 15% of the dry substance of the peas included in the ration has led to the EF improvement with 0.05 units.
CONCLUSIONS
1. The pulses for grains constitute a main protean vegetal source having a high digestive value for the animals’ forage and for the humans’ food.
2. Peas is a unique forage, it contains proteins and energy as starch and also some phenolic compounds having a strong antioxidant reaction, contributing to the improvement of the milk flavour.
3. The peas produced at S.C.D.A. Șimnic has an average content of gross protein of 26% of dry substance. The analysed sort was Rodil.
4. The arginine, lysine, methionine, cystine, threonine and tryptophan amino acids from the peas protein are positively correlated to the gross protein percentage.
6. The total carbohydrates content was at Rodil peas 67.5% of the dry substance (S.U.) among which 20.3% structural ones and 47.2% non-structural ones.
127
detergent fibre
8. The inclusion of peas in the milk cows’ ration improves the forage efficiency of the ration with 0.05 units.
BIBLIOGRAPHY
1. Dewhhurst et al., 2003, Comparation of grass and legume silage for milk
production. J. Dairy Science 86: 2598-2611
2.Ferguson J.D., 2011, Protein in Dairy Rations, [email protected]
septembrie 2011
3. Găvan C., Maximizarea consumului de substanțe uscate la vaci, Lucrări
științifice SCA Șimnic, vol. 8
4.Gilbery, G.P. Lardy, S.A. Soto-Navarro, M.L. Baurer, V.L Andersen, 2007,
Effect of pea field, chickpeas and leantils on rumen fermentation, digestion, microbial protein synthesis and feedlot performance in reeciving diets for beef cattle, J. Anim. Sci 85:3045-3053