ESTIMATING THE SECTION ELEVATION ANGLE OF CUBES ON A
CUBIC MESH. APPLICATION TO NICKEL MICROSTRUCTURE SIZE
ESTIMATION
C
HRISTIANG
ERMAIN, R
ÉMYB
LANC, M
ARCD
ONIAS, O
LIVIERL
AVIALLE, J
EAN-P
IERRE DAC
OSTA ANDP
IERREB
AYLOUEquipe Signal et Image, LAPS - UMR 5131 CNRS – ENSEIRB, ENITAB, Bordeaux1 University, 351 cours de la Libération - 33405 Talence cedex - France
e-mail: [email protected], [email protected] , [email protected], [email protected], [email protected]
(Accepted September 27, 2005)
ABSTRACT
This paper discusses two new image analysis methods for estimating the elevation angle of the section plane of a material. These methods are applicable to materials such as nickel base superalloys, the microstructure of which shows cubes arranged on a cubic regular grid. 3-D models were proposed that help interpret the section images and validate our approach. Our first method operates in the Fourier domain, and is based on the estimation of the spatial frequencies of the network of lines observed on the section. The second method is based on the average distance measured between hazy areas. Both methods are independent. Applied to synthetic images or to real material samples, they produce comparable estimations. The values of the elevation angle allow us to cancel the bias associated with the estimation of the material pattern dimensions. Keywords: 3-D simulation, cubic mesh, elevation angle, nickel superalloy, size estimation.
INTRODUCTION
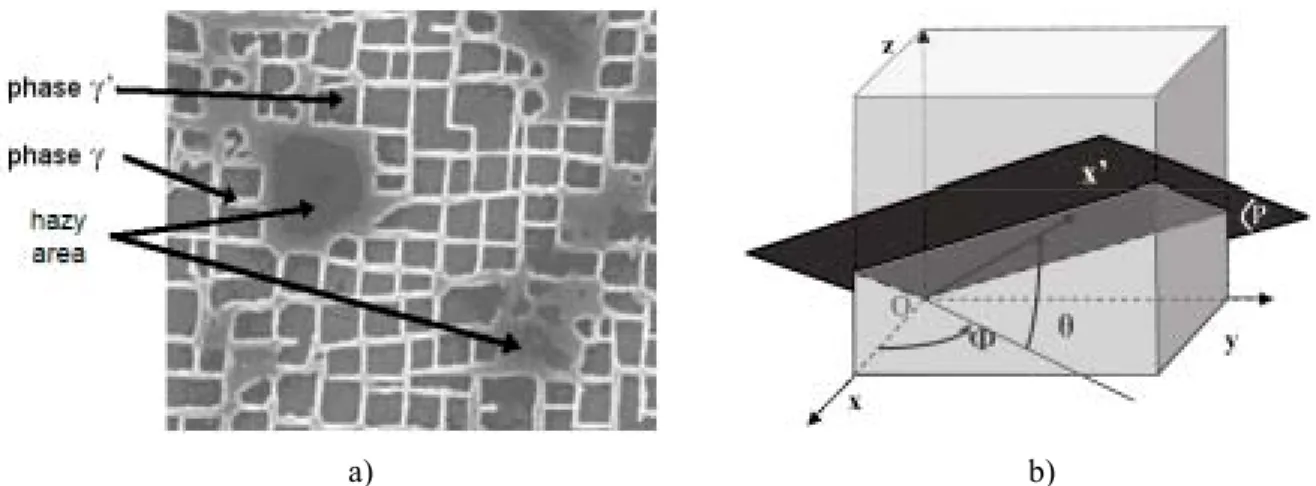
The microstructure of monocrystalline nickel base superalloys consists of two phases called γ and
γ′. The γ′ phase appears as a rectangular grid of quasi-parallelepipedal particles. The mean size of a particle side is about 400 nanometres. The γ phase constitutes walls and provides a partition between the γ′ nodules. The thickness of the γ walls is roughly ten nanometres.
Appropriate specimen etching causes some altitude differences between the two phases. The scanning electron microscope transforms the altitude differences into grey scale variations.
In Fig. 1a, γ′ sections appear in dark grey and they most frequently have the shape of parallelograms. The intersections of γ walls appear in light grey. Some irregular and intermediate grey shapes also appear. These are called hazy areas. They are usually cons-idered phases with intermediate chemical properties. We propose an interpretation for these hazy areas in section ’Material and method.’
Estimating the size of γ′ particles is necessary in order to control the physical and mechanical properties
of the nickel base superalloy. One approach to such estimation consists of characterising the material using a morphological analysis of γ′ particles (Georget
et al., 1990). More specifically, this approach is based on statistical measurement of the sizes of the parallelepiped sides and on the estimation of the average side size, believed to be identical along each of the three main crystal axes.
Unfortunately, these measurements are affected by the elevation angle between the sectioning plane and the main directions of the crystal. Indeed, a non-zero elevation angle leads to the overestimation of the parallelepiped sizes, whereas an oblique section plane has no effect on the relationship between surface and volume ratios (Russ et al., 2000; Blanc et al., 2004).
In a first section, we propose a 3-D model of the material and provide 3-D simulations of section images. Within the context of these simulations, we present the effect of the inclination of the section plane on the image aspect. This allows us to propose an inter-pretation for the hazy areas observed in real images.
Then, in a second section, we propose an initial method for estimating the elevation angle θ from the trans-formation of the section image in the Fourier domain. Indeed, in this space, the mean orientations of the sides of γ′ modules are detectable.
In a third section, we introduce a competing approach for elevation angle θ estimation. This approach is based on the analysis of the hazy areas.
We provide some results obtained with SEM images of nickel base superalloy using both estimation approaches. We also specify the correction to apply to the morphological measurements of γ′ particles and discuss the results obtained.
The last section is devoted to the conclusion.
MATERIAL AND METHOD
THREE-DIMENSIONAL MODEL AND
SIMULATIONS
In this section we introduce a 3-D model that describes the morphology of the γ and γ′ phases that compose a mono-crystal nickel base superalloy. This model allows the simulation of the γ/γ′ intersection with a sloped plane. In a first stage, our model uses identical cubes arranged on a regular cubic mesh. The length of the cube side is represented by the constant value c and the width of the separation wall is the constant value e (Fig. 2a).
For such a material, a horizontal section parallel to one of the principal directions of the cube could produce either an image showing squares arranged on a regular grid (Fig. 2b, section plane A) or a uniformly white picture (section plane B) .
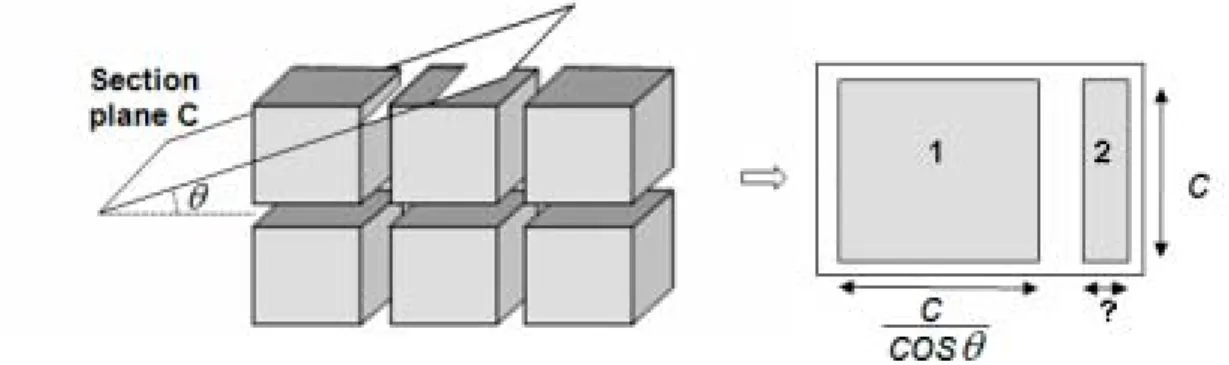
When the section plane parameters are ϕ = 0° and θ ≠ 0° (Fig. 3), the intersection shows rectangles.
a) b)
Fig. 1. a) Section of a nickel base superalloy. b) Section plane azimuth ϕ and elevation θ.
a) b)
Fig. 3. Cubic grid model for ϕ = 0° and θ≠ 0° and the related image of the section plane.
a) b)
Fig. 4. a) Vertical view for ϕ = 0° and θ = 20°. b) Image of the oblique section plane.
Some rectangle sides are related to the size of the cubes (c and c/cosθ), and some other rectangles have one side related to the size of the cube c and the other side related to the vertical position of the section plane. Only the rectangles of the first kind allow the reconstruction of the morphological parameters of the material.
Fig. 4a shows the various intersections observed in a vertical view. Fig. 4b shows the image of the corr-esponding section plane.
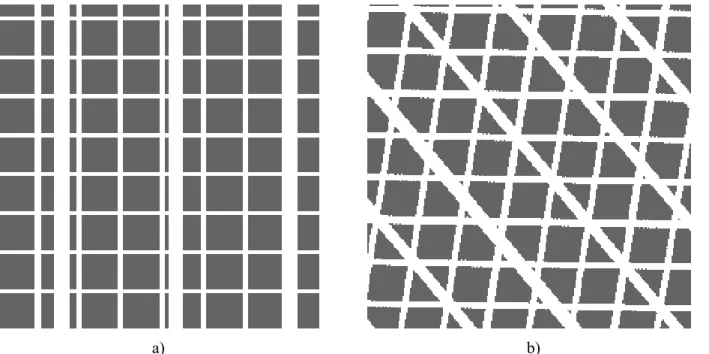
In order to qualify our model, we have simulated some images of section planes with various azimuth and elevation angles. Fig. 5a shows such a simulation with ϕ= 0° and θ = 20°. We observe that this image is in accordance with the prediction given in Fig. 4b.
In Fig. 5b we have carried out another simulation with ϕ= 45° and θ = 20°. Using this azimuth, we see that the complete intersections of cubic particles are diamond-shaped, whereas incomplete intersections show triangular and pentagonal shapes.
In order to obtain more realistic simulations, we have also introduced fluctuations in the previous model. We have replaced the cubes with parallelepipeds and slightly shifted their locations. The model becomes irregular and thus provides a better description of the actual material layout.
Fig. 6a shows the simulation of a section drawn according to this new model. The section plane crosses several γ layers, thus forming several large γ areas surrounded by γ′ squares. Theses areas give an interpretation for the hazy areas observed on the real sections. Indeed, both kinds of areas have consistent shapes. Moreover, the grey scale variations inside the hazy areas can be explained by the chemical etching of the γ phase. The results in section ‘Results’ confirm this interpretation for various azimuth and elevation angles. Fig. 6b confirms that our model is realistic when ϕ≠ 0° and θ≠ 0°.
a) b) Fig. 5. Section simulations a) ϕ = 0°, θ = 20°, b) ϕ = 45°, θ = 20°.
a) b)
Fig. 6. Real section and simulations using the realistic model a) ϕ = 0°, θ = 0°, b) ϕ≠ 0°, θ≠ 0°.
ESTIMATION OF THE ELEVATION
ANGLE IN THE FOURIER DOMAIN
The complete intersection between a cube and an oblique section plane is a parallelogram. In our case, the set of cubes forms two networks of equidistant parallel lines on the section plane. Let d1 be the period of one network, d2 the period of the second one, and ω the angle between the two networks. d1 and d2 are related to the parallelogram shape of the γ′We can deduce the azimuth ϕ and the elevation angle θ from d1, d2 and ω.
∆
r
∆
r
Arc
+
−
+
−
=
1
1
tan
22
ϕ
and∆
r
∆
Arc
θ
−
+
=
21
2
tan
(1)with
∆ =
r
4+
(
4cos
2ω
−
2
)
r
2+
1
and2 1/d d
r= (2)
The estimation of d1 and d2 is much easier in the Fourier domain, considering the periodicity of networks. Actually, the 2-D Fourier transform F(i,j) computed from the grey levels f(x,y) of an image represent the luminance changes with respect to spatial distances (Jain, 1989). Thus, when a peak appears in the Fourier spectrum, the coordinates (i,j) of this peak make it possible to directly obtain the frequency and the orientation of the corresponding periodic pattern appearing in the image.
Fig. 8b shows the central area of the Fourier spectrum of the image in Fig. 8a. The contrast has been enhanced in order to improve the visibility. Indeed, two significant pairs of peaks appear on this spectrum around the central blob. They correspond to the frequencies f1 = 1/d1 and f2 = 1/d2. Knowing f1 and
f2 allows us to compute d1 and d2 and then θand ϕ, according to Eq. 1. The angle ω between the two
networkscan be measured using either the image or the Fourier spectrum according to the quality of the Fourier spectrum.
ESTIMATION OF THE SECTION PLANE
ELEVATION ANGLE USING THE HAZY
AREAS
As shown in section ‘Three-dimensional model and simulations’, the intersection between the section plane and the various horizontal γ layers produces some hazy areas.
Let c be the size of γ′ cubes, e the width of γ
walls, and D the distance between two consecutive hazy areas, then (c + e) / D = sin(θ) and, finally:
sin
c e
Arc
D
θ
=
+
. (3)Considering the width e as a fraction of the size c,
c + e = k · c, we obtain:
.
sin
c e
sin
k c
Arc
Arc
D
D
θ
=
+
=
(4)The average value of D can be measured on the image. Indeed, in Fig. 8a we can observe quasi-parallel hazy areas. The main difficulty lies in the estimation of c. The value of c is estimated using the average S of the surface of the complete intersections between the section plane and the γ′ particle.
Fig. 9. Distance D between two consecutive hazy areas.
θ
cos
2c
S
=
. (5)Using Eq. 4 and Eq. 5, we obtain the expression of θ:
4 2 4 2
2
4 cos
2
k S D k S
Arc
D
θ
= ± + −
. (6)
Let us note that when the size c is far larger than the width e, k becomes close to 1. Thus, we can obtain an approximate expression for Eq. 3, which does not involve the measurement of the ratio between c and e.
≅ + = D c Arc D e c
Arcsin sin
θ
(7)Eq. 6 then becomes:
± + −
= 2 2 4
2 4 cos D S D S Arc
θ . (8)
Nevertheless, if the width e is not insignificant, this expression will underestimate θ.
RESULTS
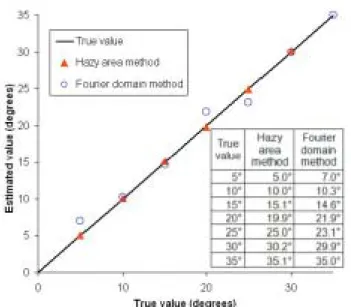
In order to assess the accuracy of both methods, experiments using sections taken from synthetic 3-D blocks were carried out. The 3-D blocks used are based on our most realistic model, introduced in section ‘Three-dimensional model and simulations’. The elevation angle θof the sections goes from 0° to 35°, with ϕ = 25°. We used Eq. 1 for the estimation of θ based on the Fourier spectrum and Eq. 6 for the method based on the hazy areas.
For both methods, size, surface, angle and frequency measurements were computed on a Microsoft Windows PC using the Aphelion software version 3.2g.
The results obtained for these synthetic images are presented in Fig. 10. It shows that the method based on the hazy areas gives a very accurate estimation of the elevation angle, because the largest deviation is less than 0.2°. The method based on the Fourier spectrum
is more sensitive to the accuracy of the location of the peak. Nevertheless, the deviation observed is always less than 2°. This angular deviation is equivalent to 0.7% deviation for the correction factor.
Fig. 10. Estimation of θ using synthetic image coming from 3D models section.
Experiments using real nickel superalloy sections were also carried out. These sections show various azimuth and elevation angles and are shown in Fig. 11.
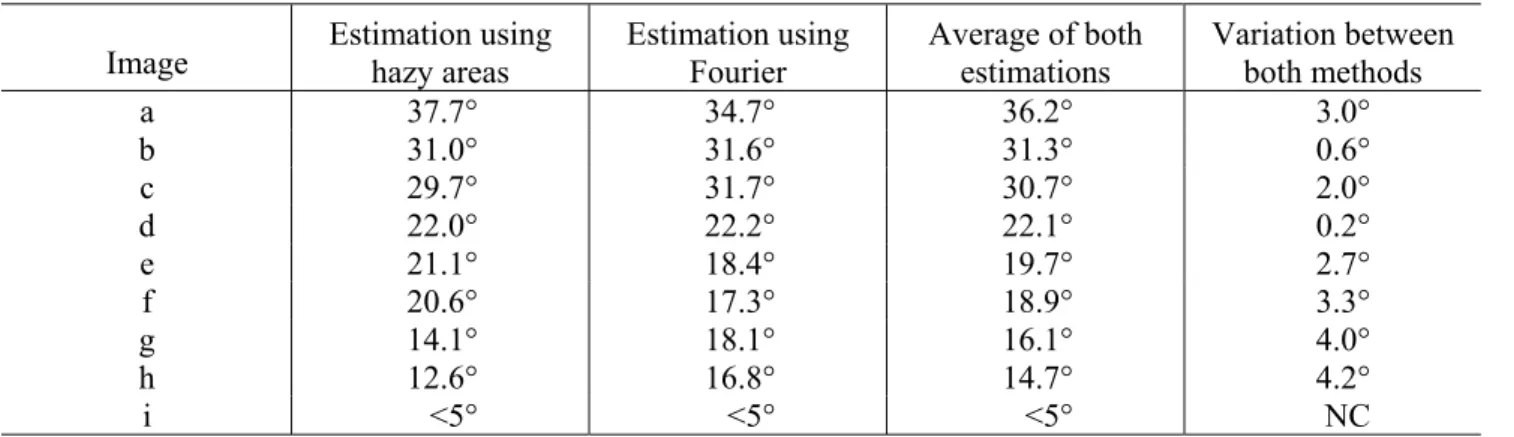
The estimations of the elevation angle using both approaches are given in Table 1.
The results provided by both approaches are consistent because the differences observed between the Fourier spectrum and the hazy area methods are always less than 4.2°.
In addition, in the case of images coming from the same material section (i.e., Fig. 11e,f), the elevation angle estimates given by each method are closer than 1°.
The differences observed between the two approaches come from the lack of periodicity within the material. Therefore, it becomes more difficult to estimate the average value of k, S and D in Eq. 6 and, especially, of d1 and d2 in Eq. 1 and Eq. 2.
In the case of the hazy areas approach, the accuracy of the estimation of θ relies on the estimations of S and
D. The accuracy of S depends on the good selection of complete intersections. In addition, the undulation of the γ layers reduces the estimation accuracy of the distance D on the image.
Nevertheless, averaging the results given by both approaches makes it possible to provide the correction factor f = (cos θ)1/2 for the average size c of the γ′ particles, thus cancelling the overestimation bias (Table 2). The worst bias factor observed in our image
database is f = +10.2% with θ= 36.2° for the section in Fig. 11a.
Let us note that we did not compute any estimation of the elevation on the section shown in Fig. 11i because no periodicity appears between hazy areas. It means that either the periodicity does not exist, or this periodicity is greater than the size of the image. In both cases, the elevation angle is less than 5°, and the overestimation of the particle size is smaller than 0.1% and does not need to be corrected.
Table 1. Elevation angle estimations for samples in Fig. 11.
Image Estimation usinghazy areas Estimation usingFourier Average of bothestimations Variation betweenboth methods
a 37.7° 34.7° 36.2° 3.0°
b 31.0° 31.6° 31.3° 0.6°
c 29.7° 31.7° 30.7° 2.0°
d 22.0° 22.2° 22.1° 0.2°
e 21.1° 18.4° 19.7° 2.7°
f 20.6° 17.3° 18.9° 3.3°
g 14.1° 18.1° 16.1° 4.0°
h 12.6° 16.8° 14.7° 4.2°
i <5° <5° <5° NC
Table 2. Correction factor estimations for samples in Fig. 11.
Image Correction factor(Hazy areas) Correction factor(Fourrier) Average correctionfactor Variation betweenboth methods
a +11.0% +9.3% +10.2% +1.7%
b +7.4% +7.7% +7.6% +0.3%
c +6.8% +7.8% +7.3% +1.0%
d +3.7% +3.8% +3.7% +0.1%
e +3.4% +2.6% +3.0% +0.8%
f +3.2% +2.3% +2.8% +1.0%
g +1.5% +2.5% +2.0% +1.0%
h +1.2% +2.2% +1.7% +0.9%
i 0% 0% 0.0% 0.0%
CONCLUSION
In this paper, we have introduced two new methods for estimating the elevation angle of the section plane. These methods can be applied to materials such as nickel base superalloys, the microstructure of which shows cubes arranged on a cubic regular grid.
In order to validate our approaches and to help interpret the section images, we also introduced 3-D models for this kind of materials. From these models, we have drawn simulations of section images that appear to be realistic compared to actual section images. Both methods, exercised on synthetic images drawn from our 3-D model, provide very accurate estimations of the elevation angle. When applied to actual material samples, they give independent and comparable estimations.
The resulting values of the elevation angle of the section plane allow us to improve the characterisation of the microstructure, thus cancelling the bias for the estimation of the particle size, which can exceed 10% in the worst cases.
Because both methods are complementary, we are currently working on the combination of their results in order to improve the accuracy of our elevation angle estimation.
ACKNOWLEDGEMENTS
This work has been partly funded by the Region Aquitaine, with the financial and technical support of the Safran group.
REFERENCES
Blanc R, Germain Ch, Da Costa JP, Baylou P, Cataldi C (2005). Fiber orientation measurements in composite materials. To be published in the Journal of Composite Material. Part A.
Georget D, Peyroutou P (1990). Characterization of the γ’ phase in a superalloy by image analysis. Proceedings of the High Temperature Materials for Power Engineering Conference, 1990; Liège, Belgium, 1377-86. Jain AK, (1989). Fundamentals of digital image processing.
Englewood Cliffs: Prentice Hall, 16-8.
Russ JC, Dehoff RT (2000). Practical Stereology. 2nd edition.