Volume 4, Issue 6, November – December 2015 Page 84
Abstract
Today, the advancement in organizations across public and private sectors have made unprecedented growth in data, From the analysis it’s predicted that the digital universal data will be 35 trillion gigabytes by 2020. The massive growth in data so called big data, emerges out with a lot of challenges. To name a few, managing the huge volume of data, analyzing it , storing and the visualizing data . Numerous big company partners comes out with various alternative solutions. Out of which, the most familiar framework that provides a good solution is the Hadoop Ecosystem. The word Ecosystem is coined as the framework is the combination of many components. The two most vital components in the Ecosystem are the hadoop distributed file system and the Map Reduce. The former is the storage part of hadoop and the later is the processing part. In this paper we strive hard to focus on the processing part of the hadoop. The Map reduce process need some technical experts to process Big Data. Apache Pig is one of the Hadoop component used to process Big Data in minimum time duration with less technical knowledge. In this paper an insight on Big Data analytics using pig script is made using Library data set. From the analytics the frequent library users, the books accessed frequently by the students, authors preferred routinely by the students, and most regular date and time of students are analyzed.
Keywords:- Big Data, Map Reduce, Hadoop, Apache Pig, HDFS
I.Introduction
Today we are living in a digitalized world, with this digitalization the amount of data generated is increased with huge volume with variety of data , this leads to Big Data. Big Data is a popular term used to describe the exponential growth, availability of data in structured and unstructured format. Sam Madden [SM12] stated that the data are too big, too fast, too hard and too complex to analyze with the existing system which is known as Big Data. It is difficult to collect, store, manage, analyze, predict, visualize, and model the data. According to marko grobelnik [W1] Big-data is similar to small-data, but bigger, having data bigger consequently requires different approaches, techniques, tools and architectures to solve new problems and old problems in a better way. Big Data is characterized by 5v’s, Doug laney [KN13] he introduced 3 v’s of data management, the 3 main components of data are volume of data, variety of data, the
velocity of data. As the technology increases with time the significance of the data has increased automatically, so there is a need of 4th v veracity of the data and 5th v value of the data.
Marko Grobelnik [W1], Andrew Brust [NK14] stated that between now and 2020, the amount of information in the digital universe will grow by 35 trillion gigabytes. Data is generated from different sources in different forms like traditional data, sensor data, satellite data, social networks, media etc. Big Data is mainly collection of huge volume of complex data that are very difficult to handle using available database management tools. V. A. Ayma et.al in [AV15] says Big Data is a buzzword used to describe a massive volume of both structured and unstructured data which is difficult to process using traditional database and software techniques. According to Nawsher khan et. Al.,[NK14], sherin et.al.,[SA14] and vibhavari chavan et .al.,[VC14] a huge parallel processing framework is required to analyze Big Data since Big Data is huge in size with different data format.
Big data analytics is the advanced analytic techniques to analyze very large data sets that include different types such as structured/unstructured. Analyzing big data allows business users and researchers to make better and faster decisions using data that are inaccessible. Using advanced analytics techniques such as text analytics, machine learning, predictive analytics, data mining, statistics, and natural language processing, businesses and researchers can analyze previously untapped data to gain new insights with better and faster decisions.
The Hadoop ecosystem is a parallel management process used effectively on structured and unstructured for better analysis. Apache Hadoop is an open-source software framework that supports distributed processing of vast amounts of data across clusters of computers by using a simple programming model.
In this paper we discussed one of the Hadoop components "Apache pig" for analysing Big Data in minimum time duration. The pig script method for analyze Big Data is described in section 4. The paper is organized as follows section2 provides with an explanation about Big Data technologies used to analyze bid data. Section3 describes different pig script statements used for analyzing Big Data, section 4 presented with use case to analyze library
An Insight on Big Data Analytics Using Pig
Script
J.Ramsingh1, Dr.V.Bhuvaneswari2
1
Ph.D research scholar Department of Computer Applications, Bharathiar University ,2Assistant professorDepartment of Computer Applications, Bharathiar University
Volume 4, Issue 6, November – December 2015 Page 85 Big Data using pig script and finally we discussed the
performance of pig script.
II.Big Data File System - An Overview
This section provides an overview about Big Data Management tools and technologies to handle Big Data. The current computing technology can manage the Big Data without using super computers or spending high cost to handling them. The special tools and technologies have been developed ,that stores, access, and analyze large amounts of data very efficiently as it incurs low cost and less processing time. The most commonly used tools and techniques to handle Big Data are Hadoop, MapReduce and BigTable [NK14]. Figure 1 shows the Hadoop ecosystem which is used to handle Big Data very effectively.
A.Hadoop
Hadoop is an open-source framework that allows users to store and process Big Data in a distributed environment across clusters of computers using simple programming models. It is designed to scale up from single servers to thousands of machines with high degree of fault tolerance. Data in a Hadoop cluster is broken down into smaller pieces and distributed throughout the cluster like the Map and Reduce functions that are executed on smaller subsets of larger data sets, and this provides the scalability needed for Big Data processing.
The Hadoop framework is composed of the Hadoop components like Hadoop Distributed File System (HDFS), YARN(Yet Another Resource Negotiator), MapReduce, HBASE, Pig, Hive, ZooKeeper, Oozie etc., The two main components of Hadoop are HDFS ( storage part), Hadoop MapReduce (processing part) and YARN(resource manager)
Figure 1 : Hadoop Ecosystem
a)Hadoop Distributed File System (HDFS)
The Hadoop Distributed File System (HDFS) is designed based on the Google File System (GFS) and a distributed file system that is designed to run on large clusters of small computer machines in a reliable and fault-tolerant manner. The master/slave architecture is used in HDFS, where master consists of a single name node and one or more data nodes. The name node manages the metadata and data nodes stores the actual data. The name node determines the mapping of blocks to the data nodes. The data nodes take care of read and write operation with the file system.
b)Hadoop MapReduce
Hadoop MapReduce is a software framework used to process large amount of data in-parallel on large clusters. MapReduce is a processing technique and a program model for distributed computing based on java. The MapReduce algorithm contains two important tasks, map and reduce task. Map takes a set of data and converts it into another set of data, where individual elements are broken down into tuples (key/value pairs). The framework sorts the outputs of the maps, which are the input to the reduce tasks. Typically both the input and the output of the job are stored in a file-system. The framework takes care of scheduling tasks, monitoring them and re-executes the failed tasks. The MapReduce framework consists of a single master resource manager, one slave node manager per cluster-node.
c)YARN
YARN is a cluster management technology. It is one of the key features in second-generation of Hadoop, designed from the experience gained from the First generation of Hadoop. YARN provides resource management and a central platform to deliver consistent operations, security and data governance tools across Hadoop clusters.
Some of the additional components that can be installed on top Hadoop framework to handle Big Data are listed in table 1.
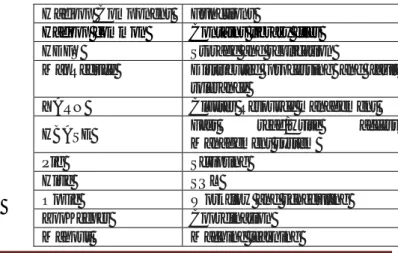
Table 1: Hadoop components and functionalities.
Hadoop Component Functions
Hadoop common Contains library files HDFS Storage and replication
MapReduce Distributed processing and fault tolerance
YARN Cluster Resource management HBASE Fast read/write access
Management system
Pig Scripting
Hive SQL
Oozie Workflow and scheduling ZooKeeper Coordination
Volume 4, Issue 6, November – December 2015 Page 86 MapReduce is an important task to process Big Data
which requires skilled java programmers to write standard MapReduce programs. Due to this high programming complexity there is a need of a platform with less programming complexity. Apache pig gives solution to the above problem, pig was initially developed by yahoo using apache Hadoop framework to analyze large data sets and spend less time to write mapper and reducer programs.
III.Data Analytics
Big data are mostly generated from social media, websites, sensors, electronic devices, blogs, log files etc., and much of it is generated in real time and on a very large scale. Big data analytics is the process of examining this large amount of different data types, and mine the hidden patterns to get some useful information. Big data analysis allows market analysts, researchers and business users to develop deep insights from the available data, resulting in numerous business advantages
Iv.Apache pig
Section III gives an overview about Apache Pig and its command to handle Big Data. This section presents with a use case to analyze library Big Data set with 3.40 lakh record using pig script.
Apache pig is a project which is lies on top of Hadoop, and it provides scripting language to use Hadoop’s MapReduce library, pig script is used to perform read, filter, transform, join, and write data with less programming skills [SD13]. Pig enables data workers to write complex data transformations without the knowledge of java programming.
Pig works with data from many sources, including structured and unstructured data, and stores the results into the HDFS. Sanjay rathee [SR15] used pig script to analyze social media log files and concluded that it can access data fast with high efficiency. S. Dhawan et al.,[SD13] has made an analysis on Big Data using pig script and compared with hive and conclude that the performance of both pig and hive was nearly same. Anjali p and Binu a [AB14]has made use of pig script to analyze the net flow data collected from routers, switches etc. Data types in pig are divided into two mode simple and complex modes, table 2 shows two modes of pig data type with description.
Table 2: Simple and complex data types
Simple data types Description
Int Signed 32-bit integer
Long Signed 64-bit integer
Float 32-bit floating point
Double 64-bit floating point
Arrays Array
Chararray Character array in unicode format
Bytearray Byte array
Complex data types Description
Tuple An ordered set of fields.
Bag An collection of tuples.
Map A set of key value pairs.
Pig is made up of two main components a)Pig latin
b)Runtime environment. a)Pig latin
Pig uses simple sql-like scripting language called pig latin. Pig latin is relatively simple language that executes a set of statements. Pig latin statements works with relations (bag with collection of tuple), a pig relation is similar to a table in a relational database, where the tuples in the bag correspond to the rows in a table. Pig latin statements can be in multiple lines and it must end with a semi-colon. Pig latin helps non-java programmers as it takes less time to code, for example in a test 10 lines of pig latin ≈ 200 lines of java. This takes 4 hours to write in java but 15 minutes in pig latin
Pig latin script is organized as follows
A load statement reads data from the file system.
A series of "transformation" statements (FILTER, FOREACH, GENERTE) to process the data.
A store statement writes output to the file system or, a dump statement displays output to the screen. Pig latin includes operators that are used to read the data from the file, execute the data and storing the data into the file table 3 illustrates the pig commands and its functionalities.
Table 3 : Pig commands and function
Pig commands Function
Command to Load
Load() Used to load data from the
file system
PigStorage() Default load function
BinStorage() Used to load data in
machine readable format TextLoader() Used to load unstructured
text file
JsonLoader Used to load file in JSON format
Command
to work
with data
Filter Used to access tuples or
rows of data.
Foreach Used to access columns of
data.
Group Used to group data in a
single relation
Cogroup Used to group two or more
relations .
Join Used to join two or more
relations.
Union Used to merge the contents
Volume 4, Issue 6, November – December 2015 Page 87
Split Used to partition the
contents of a relation into multiple relations.
Command to debug the data
Describe Used to review the schema
of a relation.
Explain Used to view the logical,
physical, or MapReduce execution plans.
Illustrate Used to view the
step-by-step execution of a series of statements.
Command to retrieve results
Dump Used to display results on
the screen.
Store Used to write results into a
file (csv,.txt) on the file system.
b) Run time environment
The pig execution environment has two modes of execution they are,
1.Local mode: Pig scripts runs on a single machine were Hadoop MapReduce and HDFS are not required. 2.Hadoop or MapReduce mode: pig scripts runs on a
Hadoop cluster.
Pig programs can be executed in three different ways, in which all the three are executed in both local and Hadoop modes
1.Grunt shell: Allows users to enter pig commands manually using pig’s interactive shell, grunt.
2.Script file: Place pig commands in a script file and run the script file.
3.Embedded: Embed the pig commands in a host language and run the program.
V.Big Data analyses using pig script : A Use
case
Pig script is used to analyze library transaction data, to analyze the data; an environment is created using Hadoop and pig in Ubuntu operating system, the analysis is made to identify the frequent library users, the books accessed frequently by the students, authors preferred routinely by the students, and most regular date and time of students using library.
Data
An analysis is performed using a college library database with 3.40 lakh records with 28 attributes which includes member code, date, author name, book title etc.,
Data analysis and methodology
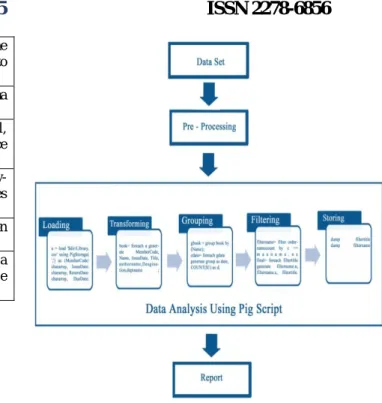
The library data set collected from the college library is consists of noise and incomplete data, using pre-processing techniques noisy and inconsistent data are reduced. After pre processing the pig script is used to analyse the library data set. Figure 2 presents with a framework for analysing the library dataset.
Figure 2: Data analysis frame work
The process of analysing the library data using pig script can be accomplished within five steps.
As a first step the data are loaded using the load command into the pig storage area. The library databases with 28 attributes are loaded with their specific supported data type in pig script. After loading the data set the transformation statements like for each, generate are used to extract the required attributes from the loaded file. The extracted attributes are then grouped individually based on library member code, book title, issue date, name of the students etc.
Using the grouped attributes the count of each fields are calculated using the count operation figure 3 shows the sample output of the member code count. After calculating the count the attributes are arranged in ascending or in descending order using order operation.
Volume 4, Issue 6, November – December 2015 Page 88 The filter command is used to filter a particular student
name, library member code, book title etc., based on the count calculated. The maximum count of individual attributes (student name , library member code, book title) are compared and the frequent library users , authors preferred , date and time accessed by the students frequently are extracted. The dump command is used to display the output and using the store command the output of the analysis are stored into the local directory. Figure 4 shows the sample result of the analysis using pig script.
Figure 4 Sample output DataAnalyzed
Time optimization in pig
The pig script is said to run in linear fashion because the execution time is directly proportional to the size of input data i.e. increase in size of data increases the execution time. The Linear time taken to process 3.40 lakh record using pig script is O(n). The following paragraph explains the time complexity calculation to process 3.40 lakh
record using
Pig script.
The time taken by the above Pig script to execute a Load query increase linearly, So the load query executes n times.
The time taken by the pig script to generate the required fields depends on the size of the data set. The execution time increases in a linear fashion as the size of n (Number of records) increases.
t = time taken for execution n= Number of records
The time taken by the Pig script to group and calculate the count depends on the size of the generated data set. The time it takes to execute the pig statement increase linearly as the size of N (number of records generated) increases.
The time taken by the Pig script to filter is N +1. Since it filters the data from the data set of N size and it has on comparison statement.
The time taken by the Pig script to Limit the filtered result and dump the result is 1 time. So the linear time taken to execute the above query is 1.
So using the Equation 1, 2, 3, 4 and 5 we can calculate the linear time complexity of the pig script for the use case example.
Figure 5, shows the execution time of the Pig script with the same data set with different size. In figure 5 the x axis denotes the Pig query used and the Y axis denotes the
Volume 4, Issue 6, November – December 2015 Page 89 execution time of that particular query in seconds. In the
analysis the size of the data set considered differs, the size of the data set is tabulated in table 5.
Figure 5 Time sequence Table 5: Size of data set
Series Size of the data set (Lakh)
Series 1 3.48
Series 2 2.20
Series 3 1.50
Series 4 1.00
VI.Conclusion
A study on Hadoop component apache pig is made in order to write MapReduce code to analyze the Big Data in a minimum of time with simple coding format. An experimental analysis is made using a library data set with 3.40 lakh record made an analysis of frequent library users, authors preferred by the students, date and time accessed by the students frequently are extracted .The above results are extracted within five steps of coding using Pig script and the results are obtained on average of 35 sec of time duration. So from the above analyze it is concluded that using pig script it is possible to handle Big Database in an easy and efficient manner with minimum of time duration with simple coding.
Reference
[1] [AB14] Anjali p p and Binu a "a comparative survey based on processing network traffic data using Hadoop pig and typical mapreduce" International Journal Of Computer Science & Engineering Survey (IJCSES) vol.5, no.1, february 2014.
[2] [AV15] V. A. Ayma et.al.,"Classification algorithms for Big Data analysis, a MapReduce approach",The International Archives of the Photogrammetry, Remote Sensing and Spatial Information Sciences, Volume XL-3/W2, 25–27 March 2015, Munich, Germany
[3] [BT14] Bharti thakur et.al.," Data mining for Big Data: a review " international journal of advanced research in computer science and software engineering 4(5), may - 2014, pp. 469-473.
[4] [DT15] Deepak s. Tamhane et.al "Big Data analysis using hace theorem" International Journal of Advanced Research in Computer Engineering & Technology (IJARCET) volume 4 issue 1, january 2015.
[5] [JB12] Joseph Bonneau “An overview of Big Data”, April 27, 2012.
[6] [KN13] Kevin Normandeau " Beyond volume, variety and velocity is the issue of Big Data veracity" sep 12,2013
[7] [NK14] Top 10 categories for Big Data sources and mining technologies by andrew brust for big on data | july 16, 2012. [NK14] Nawsher Khan et al "Big Data: Survey, Technologies, Opportunities, and Challenges" Hindawi Publishing Corporation the Scientific World Journal Volume 2014, Article ID 712826.
[8] [PS14] Patricia Saporito 2 more Big Data v’s — value and veracity by, published on january 23, 2014. [9] [SA14] Sherin A et al. " Survey on Big Data mining
platforms, algorithms and challenges " International Journal of Computer Science & Engineering Technology” (IJCSET) Sep 2014.
[10][SD13] Sanjeev Dhawan et al "Big Data analytics using Hadoop components like pig and hive" American International Journal of Research in Science, Technology, Engineering & Mathematics, 2(1), march-may, 2013, pp.88-93.
[11][SM12] Sam Madden "From databases to Big Data" ieee computer society 1089-7801 2012.
[12][SR15] Sanjay Rathee " Big Data and hadoop with components like flume, pig, hive and jaql" International Conference on Cloud, Big Data and trust 2013, Nov 13-15.
[13][VC14] Vibhavari Chavan et al, "survey paper on Big Data" (IJCSIT) International Journal of Computer Science And Information Technologies, vol. 5 (6) , 2014, 7932-7939
[14][W1] Marko grobelnik " Big Data tutorial " jozef stefan institute ljubljana, slovenia http://www.planet-data.eu/sites/default/files/presentations/Big_Data_Tut orial_part4.pdf
Authors
Mr J Ramsingh received his Bachelor’s Degree (B.Sc.) in Computer science from Bharathiar University, India 2008, Master’s Degree (MCA) in Computer Applications from Anna University, India 2011, M.Phil in Computer Science in 2014 from Bharathiar University,He is currently pursuing his doctoral research in School of Computer Science and Engineering at Bharathiar University in the area of Big Data mining.
Volume 4, Issue 6, November – December 2015 Page 90 Dr V Bhuvaneswari received her Bachelor’s Degree
(B.Sc.) in Computer technology from Bharathiar University, India 1997, Master’s Degree (MCA) in Computer Applications from IGNOU, India , M.Phil in Computer Science in 2003 from Bharathiar University, India and Ph.D in Computer Science in 2013 from Bharathiar University, India She has qualified JRF, UGC-NET, for Lectureship in the year 2003. Her research interests include Big Data , Data mining, Bioinformatics, Soft computing and Databases. She is currently working as Assistant Professor in the School of Computer Science and Engineering, Bharathiar University, India. She has credit for her publications in journals, International/ National Conferences.