WATER COMMITTEE ACTIVITIES AND CHARACTERISTICS AFFECTING WATER SYSTEM
MANAGEMENT IN NORTHERN GHANA
Allison N. Fechter
A thesis submitted to the faculty of the University of North Carolina at Chapel Hill in partial fulfillment of the requirements for the degree of Master of Science in the Department of Environmental Sciences and
Engineering in the Gillings School of Global Public Health.
Chapel Hill 2017
Approved by:
Pete Kolsky
Jamie Bartram
ii
iii
ABSTRACT
Allison N. Fechter: Water Committee Activities and Characteristics Affecting Water System Management in Northern Ghana
(Under the direction of Pete Kolsky)
iv
ACKNOWLEDGEMENTS
This research would not have been possible without the support of many people. I would first like to thank Dr. Pete Kolsky for his endless support and invaluable feedback throughout all stages of this research. I would like to thank my committee members, Dr. Jamie Bartram and Jordan Smoke for their support and input. I would also like to thank Dr. Michael Fisher who provided invaluable guidance and assistance throughout.
In the early stages of this research, I received essential guidance from Kaida Liang, Kate Shields Dr. Ryan Cronk, and Tori Klug. I am grateful to Teresa Edwards, a survey methodology expert at the Odum Institute, for reviewing survey questions. I’d also like to thank Dr. Ted Mouw for providing crucial feedback on statistical methods. Additionally, I’d also like to thank the people who took time to review the report and provide comments: Dr. Jacky MacDonald Gibson, Dr. Jill Stewart, Lauren Joca, Lisa Fleming, and Ben Gregory.
This research would not have been possible without the World Vision Ghana data collection staff. I would especially like to thank Zakaria Seidu for his leadership, support, and insight.
v
TABLE OF CONTENTS
LIST OF TABLES ... vii
LIST OF FIGURES ... viii
LIST OF ABBREVIATIONS ... ix
CHAPTER 1: INTRODUCTION ... 1
Background ... 1
Research Objectives: ... 2
Literature Review ... 2
Financial Management... 3
Activity Level ... 5
Community Engagement ... 7
Knowledge, Skills, and Supporting Environment ... 8
Summary ... 10
CHAPTER 2: METHODS ... 11
Background ... 11
Survey Development and Piloting ... 12
Survey Development ... 12
Piloting ... 12
Ethical Approval ... 12
Data Collection ... 13
Sampling Methods ... 13
Data Collection Methods ... 15
Statistical Analysis ... 16
Functionality Model ... 16
User Satisfaction Model ... 17
CHAPTER 3: RESULTS ... 19
Community and Management Committee Characteristics ... 19
Activity Level ... 21
vi
Financial Management... 22
Knowledge, Skills and Supporting Environment ... 22
Functionality ... 23
Water Point Characteristics ... 23
Functionality Model Results ... 24
User Satisfaction with Water Service ... 29
Household and Water Service Delivery Characteristics ... 29
User Satisfaction with Water Service Model Results ... 30
CHAPTER 4: DISCUSSION ... 34
Community Engagement ... 34
Financial Management... 36
Activity Level ... 38
Knowledge, Skills, and Supporting Environment ... 39
Limitations... 40
CHAPTER 5: CONCLUSION ... 42
APPENDIX: SURVEY INSTRUMENTS ... 44
vii
LIST OF TABLES
Table 1: Financial management activities and characteristics………5
Table 2: Activity level management activities and characteristics………7
Table 3: Community engagement management activities and characteristics……….8
Table 4: Knowledge, skills, and supporting environment activities and characteristics……….…10
Table 5: Management activities and characteristics considered in analysis……….…21
Table 6: Facility characteristics………...24
Table 7: Multilevel logistic regression analysis of variables associated with water point functionality….…26 Table 8: Household and water service delivery characteristics………..…30
viii
LIST OF FIGURES
Figure 1: Map of 124 study communities showing district boundaries for Savelugu and Tolon………..14
Figure 2: Conceptual model linking management, supporting environment,
additional input, and control variables to outcomes of interest……….…………18
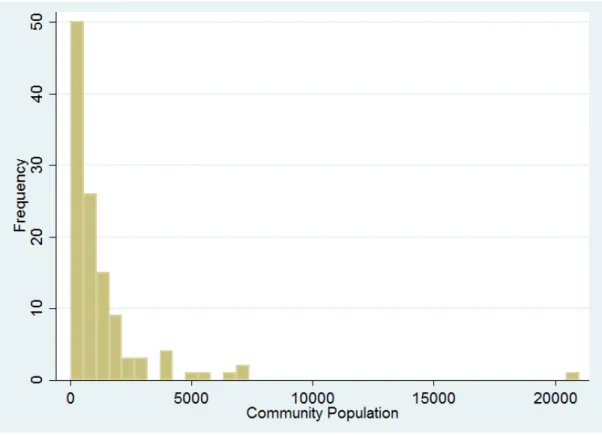
Figure 3: Frequency of populations for all 124 sample communities………..20
ix
LIST OF ABBREVIATIONS
CQI Continuous Quality Improvement IRB Institutional Review Board M&E Monitoring and evaluation MDG Millennium Development Goal NGO Non-governmental organizations PCS Post-construction support SDG Sustainable Development Goal
1
CHAPTER 1: INTRODUCTION
Background
The United Nations Sustainable Development Goal (SDG) 6 is to “ensure availability and sustainable management of water and sanitation for all” by 2030 (United Nations, n.d.-a). This goal comprises several targets, including Target 6.B: to “Support and strengthen the participation of local communities in improving water and sanitation management” (United Nations, n.d.-a). The Millennium Development Goals (MDGs), which set the 2000 to 2015 agenda for sustainable development, had focused on increasing access to sources classified as “improved”1 (United Nations, n.d.-b).The SDGs build on the MDGs by requiring that water sources be not only “improved,” but also “safely managed2.” In response to SDG 6, governments, non-governmental organizations (NGOs), and other stakeholders involved in the international water, sanitation, and hygiene (WaSH) sector must now support and strengthen community management institutions, while also working to deliver a higher level of service than would be needed to meet the MDGs.
The community management model has dominated rural water sector policy and practice since the 1990s (Schouten & Moriarty, 2003). Inherent to the community management model are water committees, a group of elected or volunteer community members who oversee financial and technical management of local water systems (Chowns, 2015). It is believed that the presence of a management committee, combined with access to resources such as tools and post construction support, enhances functionality of water systems (Whittington et al., 2009). However, the success of community
management varies. Target 6.B presents an opportunity for stakeholders to re-evaluate the assumptions surrounding the community management model, and implement approaches that support and strengthen
1 “An ‘improved’ drinking-water source is one that, by the nature of its construction and when properly used, adequately protects the source from outside contamination, particularly fecal matter”
(WHO/UNICEF, 2015)
2
water committees. To determine the best approach that stakeholders can take to support water committees, it is useful to better understand committee activities or characteristics are associated with better water system outcomes.
Past research suggests a relationship between water committee effectiveness and sustainability of water systems, and several studies have identified specific management activities and characteristics that are believed to promote water system sustainability (See Literature Review section). Frequently mentioned management activities include collecting revenue from users, holding regular committee meetings, and keeping financial and maintenance records. The most frequently mentioned characteristics involve gender balance: committees that have female members or female members holding key
positions. To date, no studies have explored the association between management and water system outcomes by considering an extensive list of management activities and characteristics in unison. This research, which focuses on water committees in Northern Ghana, seeks to fill this gap by examining the association between a comprehensive list of activities and characteristics and two outcomes of interest: water source functionality and user satisfaction.
Research Objectives:
1) Conduct a literature review to identify management characteristics to include in the study and develop survey tools to measure these characteristics in Northern Ghana
2) Evaluate the relationship between management activities and characteristics and two outcomes of interest: water source functionality and user satisfaction
Literature Review
This literature review seeks to answer the following research question: Which water committee management activities and characteristics (including those that relate to external support) are associated with improved water system outcomes? Studies were identified from peer review literature using the Web of Science online database. Bibliographies of included studies were searched to identify additional
3
the author analyzed a dataset and identified specific management activities or characteristics related to water system outcomes such as functionality. Both quantitative and qualitative studies were included in the review. Eligibility was limited to studies of rural areas, but not otherwise restricted geographically. Management activities and characteristics were extracted from each study. Following data extraction, four distinct categories of activities and characteristics were identified: a) financial management, b) activity level and accountability, c) community engagement, and d) knowledge, skills, and supporting
environment.
Financial Management
Collecting revenue from water users is often referenced as an important measure in ensuring the sustainability of community managed water sources. Three studies included in this review cited revenue collection as a management characteristic (Adank et al., 2014; Fisher et al., 2015; Foster, 2013). In a study of 25,000 handpumps across Liberia, Sierra Leone, and Uganda, Foster (2013) found that the odds of a handpump being functional was higher when fee collection was practiced. Fisher et al. (2015), running a somewhat similar multivariate logistic regression model for handpumps in Ghana, found the same relationship between functionality and fee collection. Also focusing on handpumps in Ghana, Adank at al. (2014) found a strong positive correlation between fee collection and service level (a categorical variable encompassing functionality and service standards).
4
Mihelcic (2012) developed a sustainability assessment tool for community managed water systems in the Dominican Republic and cited both sufficient revenue to cover O&M and “significant” savings as indicators of financial durability.
Some studies asked, “who is paying?” and “when?” Three studies considered the proportion of debtors in a community as a financial management characteristic (Madrigal et al., 2011; Schweitzer & Mihelcic, 2012; van den Broek & Brown, 2015). In a study on the functionality of handpumps in Uganda, van den Broek and Brown (2015) highlight the importance of considering percent debtors since some communities may not require all users to pay for water. Foster (2013) considered the effectiveness of proactive versus reactive payments and found mixed results: proactive payments were related to higher levels of handpump functionality in Sierra Leone but lower levels in Liberia.
5
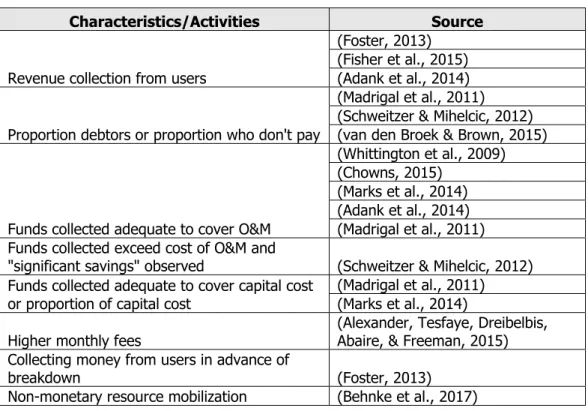
Table 1: Financial management activities and characteristics
Characteristics/Activities Source
Revenue collection from users
(Foster, 2013) (Fisher et al., 2015) (Adank et al., 2014)
Proportion debtors or proportion who don't pay
(Madrigal et al., 2011) (Schweitzer & Mihelcic, 2012) (van den Broek & Brown, 2015)
Funds collected adequate to cover O&M
(Whittington et al., 2009) (Chowns, 2015)
(Marks et al., 2014) (Adank et al., 2014) (Madrigal et al., 2011) Funds collected exceed cost of O&M and
"significant savings" observed (Schweitzer & Mihelcic, 2012) Funds collected adequate to cover capital cost
or proportion of capital cost
(Madrigal et al., 2011) (Marks et al., 2014)
Higher monthly fees (Alexander, Tesfaye, Dreibelbis, Abaire, & Freeman, 2015) Collecting money from users in advance of
breakdown (Foster, 2013)
Non-monetary resource mobilization (Behnke et al., 2017)
Activity Level
Water committees are usually expected to hold regular committee meetings and keep records of meetings and/or finances. Three studies found positive relationships between committees that had at least one of these characteristics and improved outcomes. Foster (2013) found that holding regular committee meetings and having six or more committee members were both related to improved functionality in Uganda. Alexander et al. (2015) found that holding committee meetings at least every three months and keeping good records was positively associated with functionality in Ethiopia. In Ghana, Adank (2014) found that having up-to-date records was correlated with level of service.
6
Two studies mention the importance of accountability in relation to water system maintenance activities. Using multivariate logistic regression, Foster (2013) found that the odds of a handpump being functional in Uganda were higher when maintenance activities were performed. Similarly, Schweitzer and Mihelcic (2012) found that more hours per month of system maintenance was correlated with better functionality.
Female representation is often considered an important characteristic for sustainable
7
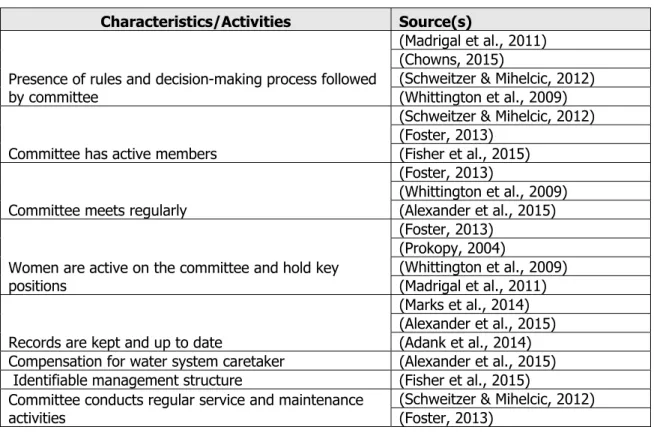
Table 2: Activity level management activities and characteristics
Characteristics/Activities Source(s)
Presence of rules and decision-making process followed by committee
(Madrigal et al., 2011) (Chowns, 2015)
(Schweitzer & Mihelcic, 2012) (Whittington et al., 2009)
Committee has active members
(Schweitzer & Mihelcic, 2012) (Foster, 2013)
(Fisher et al., 2015)
Committee meets regularly
(Foster, 2013)
(Whittington et al., 2009) (Alexander et al., 2015)
Women are active on the committee and hold key positions
(Foster, 2013) (Prokopy, 2004)
(Whittington et al., 2009) (Madrigal et al., 2011)
Records are kept and up to date
(Marks et al., 2014) (Alexander et al., 2015) (Adank et al., 2014) Compensation for water system caretaker (Alexander et al., 2015) Identifiable management structure (Fisher et al., 2015) Committee conducts regular service and maintenance
activities
(Schweitzer & Mihelcic, 2012) (Foster, 2013)
Community Engagement
Two aspects of community engagement, community meetings and participation in water system decision making, are addressed in four of the studies included in this review (Marks et al., 2014; Prokopy, 2004; Schweitzer & Mihelcic, 2012; Walters & Chinowsky, 2016). Marks et al. (2014) found that project outcomes in Ghana were better when a larger proportion of households reported participating in water system decisions. Although Prokopy (2004) did not find a link between female participation and project improvements in India, she did find a relationship between overall participation and improvements. Walters and Chinowsky (2016) found that organizing and holding community meetings was a key activity related to water system functionality for communities in Nicaragua. Schweitzer and Mihelcic (2012) included percent attendance at community meetings in their water system sustainability assessment scoring tool.
8
Dominican Republic. They found that these measures of transparency were positively correlated with higher payments of water user fees.
It is possible that sense of ownership also relates to community engagement activities. Marks, Onda, and Davis (2013) found that community members’ sense of ownership was associated with user confidence in water system and sustainable water system management in Kenya. Community
engagement management activities and characteristics are summarized in Table 3.
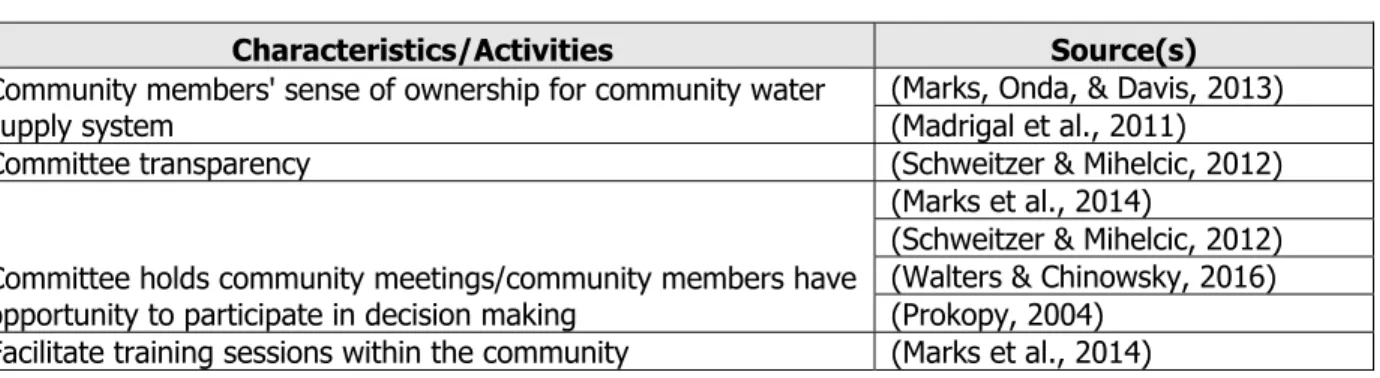
Table 3: Community engagement management activities and characteristics
Characteristics/Activities Source(s)
Community members' sense of ownership for community water supply system
(Marks, Onda, & Davis, 2013) (Madrigal et al., 2011)
Committee transparency (Schweitzer & Mihelcic, 2012)
Committee holds community meetings/community members have opportunity to participate in decision making
(Marks et al., 2014)
(Schweitzer & Mihelcic, 2012) (Walters & Chinowsky, 2016) (Prokopy, 2004)
Facilitate training sessions within the community (Marks et al., 2014)
Knowledge, Skills, and Supporting Environment
9
Availability of tools and spare parts are supporting environment characteristics, particularly for minor repairs that do not warrant a PCS visit. Foster (2013) found that handpumps were more likely to be functional in Sierra Leone when spare parts were located within 20 miles. Bayesian network analysis revealed that access to spare parts and tools increased the likelihood of a source being functional in Ghana (Fisher et al., 2015). Using qualitative methods, Chowns (2015) found that willingness to pay for replacement parts was slowing down repair time for water systems in Malawi.
10
Table 4: Knowledge, skills, and supporting environment activities and characteristics
Characteristics/Activities Source(s)
Ability to access support from outside the community ("post construction support" or area mechanics) when needed
(Marks et al., 2014) (Whittington et al., 2009) (Foster, 2013)
(Kayser, Moomaw, Miguel, Portillo, & Grif, 2014) (Davis et al., 2008) Number of days required to obtain the services of a
mechanic/downtime
(Fisher et al., 2015)
(Schweitzer & Mihelcic, 2012)
Availability of spare parts
(Foster, 2013) (Chowns, 2015) (Fisher et al., 2015) Willingness to pay for replacement parts (Chowns, 2015)
Availability of tools (Fisher et al., 2015)
Committee can identify someone who is responsible for repairs (Chowns, 2015) Committee has capacity to make minor repairs
(Alexander et al., 2015) (Marks et al., 2014) Capacity building training related to administrative and financial
function (Davis et al., 2008)
Operator and/or committee training
(Whittington et al., 2009) (Davis et al., 2008) (Foster, 2013) Ability to apply skills learned in training (Chowns, 2015)
External agency audits records periodically (Alexander et al., 2015)
Summary
This review compiled a comprehensive list of water committee activities and characteristics that appear in the literature on community managed rural water systems. However, the list of characteristics for which one or more studies examine a statistical relationship between management activities and characteristics and improved water system outcomes (e.g. functionality, user satisfaction) is much
11
CHAPTER 2: METHODS
Background
This research was conducted as part of an ongoing monitoring and evaluation (M&E) partnership between the NGO World Vision and the Water Institute at the University of North Carolina at Chapel Hill (UNC). The ongoing partnership uses data collected through household, community, and water point survey instruments to evaluate the impact of World Vision’s WaSH programs across four districts in Northern Ghana: Savelugu, Tolon, Gushiegu and Karaga. Since 1990, World Vision has implemented a number of WaSH programs in these districts, including water source installation (primarily boreholes with handpumps), water committee training, and hygiene and/or sanitation program implementation.
12
Survey Development and Piloting
Survey Development
I reviewed literature concerning community managed water systems and compiled a list of water committee management activities and characteristics that are associated with increased functionality and service reliability (see Literature Review section). Four categories of activities and characteristics were identified based on the results of the literature review:
a) Financial management (e.g. collecting water user fees, saving money) b) Activity level (e.g. holding meetings, having a gender balanced committee)
c) Community engagement (e.g. holding community meetings, transparency with the community) d) Knowledge, skills, and supporting environment (e.g. access to outside support, access to spare parts)
Survey questions were developed to collect data on management activities and characteristics associated with each category. Questions developed specifically for this technical report were included in the community and household surveys.
Piloting
The survey questions were piloted in 29 communities in Northern Ghana in November 2016. Pilot data were reviewed to evaluate the effectiveness of the questions and data collectors gave feedback on their experience administering the surveys. After piloting, some survey questions were re-written for clarity and others were eliminated.
Ethical Approval
13
Data Collection
Sampling Methods
The ongoing M&E partnership, which predates this study, collects data on WaSH services in Northern Ghana using a cluster-randomized trial approach with repeat measures. The ongoing study includes a total of 224 communities across four districts in Northern Ghana: Savelugu, Tolon, Gushiegu, and Karaga. World Vision had previously installed water points in every study community. These 224 communities were randomized to two equal study arms: an intervention and a control arms. During the initial data collection in 2014, 926 waterpoints and 527 households were visited. For the purposes of the study described in this technical report, data collected during a monitoring cycle in 2017 from only two of the four districts was analyzed (Savelugu and Tolon), for a total of 124 study communities (Figure 1). Samples used for each of the statistical analysis (functionality and user satisfaction) are described in the following sections.
14
Figure 1: Map of 124 study communities showing district boundaries for Savelugu and Tolon
Functionality Sampling Methods
An analysis of water point functionality across the study communities was conducted using a sample of 440 water points. The initial data set consisted of 720 water points, and included all water points used for drinking within each study community. However, only source types that require a similar level of management were included in the sample: a) borehole with manual pump, b) protected dug well with handpump and c) public taps/standpipe. The initial sample also included three mechanized
boreholes, but these were omitted from the analysis because all three were dysfunctional. Source types that do not require a similar level of management because they are not susceptible to mechanistic failure, such as surface water, were excluded from the analysis. The sample was further restricted to water points managed by a water committee, thereby excluding water points managed by schools or private operators.
User Satisfaction Sampling Methods
15
community were chosen for inclusion in the ongoing study using random sampling methods. Due to loss to follow-up, the total number of households per community in this sample ranges from two to six.
Data Collection Methods
Data were collected between December 2016 and March 2017 by World Vision Ghana data collectors. Two data collectors visited each community in the study and conducted mixed methods surveys of the community, water points, and households.
One community survey was completed for each community. This survey captures information on WaSH services available to the community and water committee activities and characteristics. The respondent for the community survey was water committee members (each sample community had one water committee), or a community leader when the committee was not available.
The household survey captured information on WaSH related behaviors and services and user satisfaction with water service, in addition to basic demographic and socioeconomic information. Surveys were conducted after informed consent was obtained and respondents could end the survey at any time. Surveys were conducted in the local language and data collectors were instructed to interview the female head of household whenever possible. If a female head of household was not available, data collectors interviewed a female household member over the age of sixteen. Households did not receive
compensation for their participation.
16
Statistical Analysis
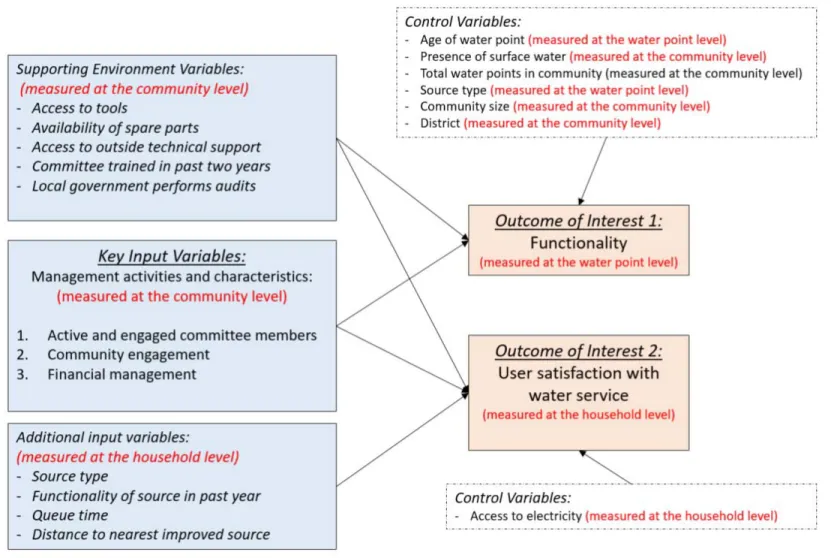
Data were cleaned and analyzed using Stata 14 (Statacorp., College Station, TX). Two multivariable models were designed to examine the relationship between management characteristics (i.e. the key input variables) and improved outcomes (i.e. higher levels of functionality and user satisfaction). A conceptual diagram guided the development of both models (Figure 2).
Summary statistics were tabulated and a univariate regression was performed to identify which management characteristics identified in the literature review had the greatest association with water system functionality and user satisfaction (Table 5). The results of the univariate regression analysis helped the author identify key management characteristics to include as variables in the final models.
In addition to the key management characteristics, supporting environment variables which may enable water committees to achieve better outcomes, such as access to tools and availability of spare parts, were included in each model. The models also controlled for other factors believed to influence functionality (e.g. age of water point, population of community) and user satisfaction (e.g. source type, functionality of source in the past year).
Functionality Model
The functionality model analysis was conducted at the water point level, based on data collected on 440 water points. Functionality is a dichotomous outcome variable at the waterpoint level defined by the direct observation of whether water could be obtained from the water point at the time of the visit. Water points categorized as not functional included those that were out of service due to mechanical failures and those that were experiencing seasonal water shortages (note: protected dug wells with handpumps were categorized as not functional if the handpump was not working, regardless of whether water could be drawn from the well).
17
considering the varying number of water points per community. Imagine conducting this analysis using single level logistic regression: each water point would be considered a completely independent data point regardless of the total number of water points per community. The theory surrounding community managed water systems leads us to believe that functionality of a single community water point may be correlated with the functionality of other water points in the community. Therefore, a single level model is insufficient and a multilevel model is needed. Multilevel models are adept at handling this type of problem: they allow us to conduct a functionality analysis at the water point level, while still considering the effect of community on the functionality of individual water points.
User Satisfaction Model
User satisfaction was based on responses to the following household survey question: “How satisfied or dissatisfied are you with your water service?” Two hundred respondents answered this question on a three-point Likert scale of: “very satisfied,” “somewhat satisfied,” and “dissatisfied.”
I assessed the relationship between independent variables and user satisfaction using ordered logistic regression analysis. This model was chosen because the dependent variable (user satisfaction) is based on ordinal data: three ordered categories increasing in value from “dissatisfied” to “very satisfied.”
Note: One water committee was responsible for managing water point(s) per community
Figure 2: Conceptual model linking management, supporting environment, additional input, and control variables to outcomes of interest
19
CHAPTER 3: RESULTS
The following section presents results from the analysis. First, community and management committee summary statistics are presented. All committee activities and characteristics are summarized based on the four categories specified previously: a) financial management, b) activity level, c)
community engagement, and d) knowledge, skills, and supporting environment. Next, results from the functionality analysis are presented. This is broken into two sub-sections: first summary statistics are presented for all water point characteristics, followed by results from the multivariable functionality model. Finally, results from the user satisfaction analysis are presented. This includes summary statistics for household and water service variables, and results from the multivariable user satisfaction model.
Community and Management Committee Characteristics
Data were collected in 124 communities. There was a large variance in population per
20
21
Table 5: Management activities and characteristics considered in analysis
Management Variables N (%) n=124*
Activity Level
Committee prepares maintenance schedules 20 (16%)
Committee keeps financial records 53 (43%)
Committee meets regularly and had 100% of committee members attended the last
meeting 70 (56%)
Committee held a meeting in the last month 41 (33%)
Mean percent of committee that is female (39%)
Committee meets regularly and have women on the committee that attend as often, or
more often, than men on the committee 95 (77%)
Committee has a female in a key financial position (financial clerk, revenue collector,
treasurer, or vendor) 59 (48%)
Committee has a female chair or vice chair 16 (13%)
Government checked financial records in the past year 11 (9%)
Community Engagement
Committee held a community meeting in the past 6 months 83 (67%)
Financial Management
Community members pay for water 75 (60%)
Committee practiced non-monetary resource mobilization (community labor and/or
donations) 66 (53%)
Committee collected additional money from users in response to the last breakdown 44 (35%)
Committee has more than 500 Ghana Cedis in savings 20 (16%)
Committee has an administrative or financial clerk 91 (73%)
Committee has a vendor at every water point 27 (22%)
Knowledge, Skills, and Supporting Environment
Repair person received training in past two years 38 (31%)
Repair person has access to tools and spare parts 67 (54%)
Committee has access to outside technical support when needed 106 (85%) Committee received training related to financial management 28 (23%) *Data incomplete for some variables
Activity Level
22
and 16% reported preparing maintenance schedules but only a small proportion showed the records to data collectors (13% and 3% respectively).
Community Engagement
Most communities (81%) reported that the water committee had held a community meeting at some point, and 67% reported that a community meeting had taken place in the last six months. Thirty-six percent of household survey respondents had attended a community meeting led by the water committee. However, only 15% of household respondents reported involvement in a decision about the water system.
Financial Management
The water committee reported that users paid for water in 60% of communities (most of which reported that 100% of users paid for water). Most of these committees (80%) practiced regular fee collection (yearly, quarterly, monthly, weekly, or every time they fetch water), while 20% of committees collected money following breakdown. Some communities practiced non-monetary resource mobilization (53%), through either a) communal labor (e.g. communal farming), b) donating goods or livestock (e.g. shea nuts, maize, bowl of rice), c) other fundraising activities, or a combination of the three mechanisms. Communal labor was the most common response. In particular, communities in this region are known to organize communal farming activities where community members will collectively farm a piece of land to raise money for the water system. About half of all committees (55%) had money saved for repairing water points when needed, and 16% had more than 500 Ghana Cedis (approximately 100 USD). Financial positions were common: 73% of committees had an administrative or financial clerk, and 22% had vendors.
Knowledge, Skills and Supporting Environment
23
committees (85%) had a repairperson or team outside of the community who they could contact for advanced technical support when needed. “Area mechanic” and “private maintenance person” were the two most-commonly cited forms of outside support. All committees that had called for outside support in the past year reported that the support person, or team, came when they were called and 71% reported that the person/team came within one day.
Functionality
The following sub-sections present results from the functionality analysis. First water point summary statistics are presented, followed by results from the multivariable functionality model.
Water Point Characteristics
24
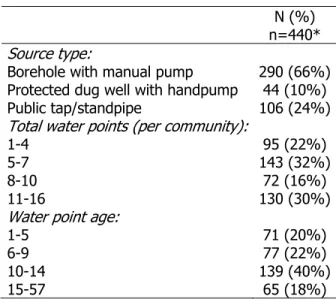
Table 6: Facility characteristics
N (%) n=440* Source type:
Borehole with manual pump 290 (66%) Protected dug well with handpump 44 (10%) Public tap/standpipe 106 (24%) Total water points (per community):
1-4 95 (22%)
5-7 143 (32%)
8-10 72 (16%)
11-16 130 (30%)
Water point age:
1-5 71 (20%)
6-9 77 (22%)
10-14 139 (40%)
15-57 65 (18%)
*Data incomplete for some variables
Figure 4: Frequency of water point ages for 440 water points included in the sample
Functionality Model Results
25
26
Table 7: Multilevel logistic regression analysis of variables associated with water point functionality
OR (95% CI) P-value
Community Characteristics (control variables)
Population 1.000 (1.000 - 1.000) 0.011
Presence of surface water in community: yes vs. no 0.190 (0.0662 - 0.544) 0.002
District: Savelugu vs. Tolon 0.596 (0.263 - 1.350) 0.215
Facility Characteristics (control variables) Source type:
Source type: Protected dug well with handpump vs. borehole with
manual pump 0.113 (0.0338 - 0.377) 0.000
Source type: Public tap/standpipe vs. borehole with manual pump 0.480 (0.202 - 1.142) 0.097 Total water points:
Total water points: 5-7 vs. 1-4 0.194 (0.0688 - 0.549) 0.002
Total water points: 8-10 vs. 1-4 1.274(0.385 - 4.213) 0.691
Total water points: 11-16 vs. 1-4 0.459(0.122 - 1.724) 0.249
Water point age:
Age: 6-9 vs. 1-5 0.154 (0.0571 - 0.417) 0.000
Age: 10-14 vs. 1-5 0.816(0.321 - 2.076) 0.669
Age: 15-57 vs. 1-5 0.432(0.145 - 1.289) 0.132
Key Supporting Environment Variables
Repair person has access to tools and parts: yes vs. no 2.504 (1.053 - 5.953) 0.038 Access to outside technical support:
Access to outside support but never called or “N/A” vs. no access to
outside support 4.788 (1.135 - 20.20) 0.033
Received outside support vs. no access to outside support 2.885 (0.938 - 8.871) 0.065
Key Management Variables
Committees that have held a community meeting in last 6 months:
yes vs. no 2.348 (1.045 - 5.277) 0.039
Savings:
Savings: 1-500 Cedis vs. no savings 0.201 (0.0690 - 0.588) 0.003 Savings: 501-8,000 Cedis vs. no savings 0.277 (0.0949 - 0.811) 0.019 Resource mobilization type (monetary or non-monetary)
Only monetary resource mobilization vs. no resource mobilization 2.048 (0.666 - 6.302) 0.211 Combination monetary and non-monetary resource mobilization vs.
no resource mobilization 2.351 (0.753 - 7.343) 0.141
Only non-monetary resource mobilization vs. no resource
mobilization 6.787 (1.609 - 28.63) 0.009
Proportion of committee that is female 7.484(0.281 - 199.6) 0.230 Committee meets regularly and had 100% of committee members
attended the last meeting: yes vs. no 0.949(0.437 - 2.058) 0.894
Constant 4.209(0.401 - 44.21) 0.231
Observations, Number of groups 333,
103
27 Key supporting environment variables
The model suggested a statistically significant association between functionality and two supporting environment variables: access to tools and spare parts and access to outside technical support. Both variables were measured at the community level. Water points managed by committees that had access to tools and spare parts were over two times more likely to be functional compared to water points managed by committees that did not have access to these resources (p=0.04). Outside support was categorized as a) committee does not have someone outside of the community who they could call if the water point breaks down, b) committee does have someone outside of the community who they could call but they never have, and c) committee has received outside support following a breakdown. Water points managed by committees that had received outside support were almost three times more likely to be functional than water points managed by committees that did not have access to outside support (p=.07). Water points managed by committees that had access but had not called were almost five times as likely to be functional as water points managed by committees who did not have access to outside support (p=.03).
Key management variables
Two financial management variables were included in the multivariate model based on the results of the preliminary analysis: resource mobilization and savings. The model explored the relationship between functionality and two types of resource mobilization: monetary fee collection and non-monetary fee collection activities such as communal farming or donation of goods/livestock. The resource
28
Ghana Cedis) or less (80% less likely to be functional) and savings that were greater than 100 USD (72% less likely to be functional).
The model results revealed a statistically significant relationship between the community
engagement variable and functionality. Water points managed by committees that had held a community meeting in the past 6 months had over two times greater odds of being functional as compared to water points located in communities where a water committee had not held a meeting in the past six months (p=.04).
The model did not suggest an association between activity level variables (proportion of females on the committee and regular meetings with 100% committee attendance at the last meeting) and functionality. Increased proportion of females on the committee had an odds ratio greater than one but the variable was not significant. Regular meetings and 100% committee attendance had an odds ratio less than one but also was not significant.
Community and facility characteristics
Population of community, presence of surface water in the community, and district all served as community-level control variables. Population had a statistically significant but practically negligible effect on functionality with an odds ratio of one. Water points located in communities with a surface water source were 80% less likely to be functional compared to communities that did not have a surface water source (p=0.002). The effect of district (Savelugu district vs. Tolon district) was not significant in the multivariate model.
Water points that were six to nine years old were less likely to be functional than water points that were one to five years old (p<0.001). No statistically significant relationship existed for older water points. The source type was also significant: the handpumps installed in protected dug wells and public taps/standpipe were much less likely to be functional than boreholes with manual pumps3 (p<0.001 and p=0.1). Total number of water points was also significant: water points located in communities with five
29
to seven water points were 80% less likely to be functional than water points located in communities with one to four water points (p=0.00).
User Satisfaction with Water Service
The following sub-sections present results from the user satisfaction analysis. First household and water service delivery characteristics are summarized for the study sample, followed by results from the multivariable user satisfaction model.
Household and Water Service Delivery Characteristics
Two hundred respondents across the 48 communities where household surveys were conducted answered the question “how satisfied or dissatisfied are you with your water service” (See Sampling Methods section for a description of household sampling methods). Respondents ranged in age from 20 to 80 (mean of 37) and were almost entirely female (99%). The average household size was six people (range 2 to 13). Of the 200 households interviewed, 38% were dissatisfied with their water service, 33% were somewhat satisfied, and 29% were very satisfied. The majority of respondents identified an
improved source as their main household water source in both the wet and dry season (68%) (Table 8). Most households were within 500 m of an improved source, with a mean distance of 370 m (median 155 m). The median reported queue time was 20 minutes, with a much higher mean of 55 minutes due to some very high reported queue times (seven respondents reported five to six hours in queue). Seventy-two percent of households reported that their most recent water source had broken down for one day or more in the past year.
30
Table 8: Household and water service delivery characteristics
N (%)
Variable n=200*
Household Characteristics Variables
Household has electricity 115 (58%)
Pay frequency:
Don’t pay 88 (44%)
Every time they fetch water 50 (25%)
Monthly 27 (14%)
When the system breaks 35 (18%)
Water committee holds community meeting and respondent attendance
Committee hasn’t held a community meeting 82 (41%)
Committee held a community meeting but respondent didn’t attend 46 (23%)
Respondent attended community meeting 72 (36%)
Respondent has been involved in a decision about the water system 30 (15%)
Key Water Service Delivery Variables
Source type:
Main wet and dry season sources are a mix of improved and unimproved 44 (22%)
Main wet and dry season sources unimproved 40 (20%)
Main wet and dry season sources improved 115 (68%)
Most recent source broke down for more than 1 day in past year 141 (72%)
Variable Mean (median)
Queue time (minutes) 55 (20)
Distance to nearest improved source (m) 370 (155)
*Data incomplete for some variables
User Satisfaction with Water Service Model Results
Results from the multilevel logistic regression analysis of variables associated with user
31
Table 9: Ordered logit regression analysis of variables associated with user satisfaction with water service
OR (95% CI) P-value
Key Water Service Delivery Variables
Source type:
Main wet and dry season sources unimproved vs. mix of improved and unimproved
0.281(0.0909 - 0.868) 0.027 Main wet and dry season sources improved vs. mix of improved and
unimproved 3.806(1.614 - 8.976) 0.002
Most recent source broke down for more than 1 day in past year: yes
vs. no 0.410(0.200 - 0.840) 0.015
Queue time 0.996(0.992 - 1.000) 0.062
Distance to nearest improved source 1.000(1.000 - 1.001) 0.406
Household Characteristics Variable
Household has electricity: yes vs. no 0.849(0.438 - 1.644) 0.627
Key Supporting Environment Variables
Repair person who has received training in past two years: yes vs. no 2.047(1.027 - 4.081) 0.042 Committee received training related to financial management 2.653(1.313 - 5.364) 0.007
Key Management Variables
Pay frequency:
Pay frequency: every time they fetch vs. don’t pay 1.537(0.630 - 3.747) 0.345
Pay frequency: monthly vs. don’t pay 1.167(0.398 - 3.420) 0.778
Pay frequency: when the system breaks vs. don’t pay 0.598(0.243 - 1.474) 0.264 Water committee holds community meeting and respondent
attendance
Committee held a community meeting but respondent didn’t attend vs.
no meeting 1.487(0.616 - 3.592) 0.378
Respondent attended community meeting vs. no meeting 2.113(0.962 - 4.637) 0.062 Respondent has been involved in a decision about the water system:
yes vs. no 0.565(0.225 - 1.417) 0.223
Committee prepares maintenance schedules: yes vs. no 3.448(1.191 - 9.983) 0.022 Committee has met in the past month: yes vs. no 0.574(0.264 - 1.249) 0.162
Observations 182
32 Key supporting environment variables
Both supporting environment variables (repair person who has received training in the past two years and committee that had received training related to financial management) were associated with increased user satisfaction. The odds of households being very satisfied (as opposed to somewhat satisfied or dissatisfied) with their water service are two times higher in communities where the water committee had received training in the past two years compared to communities where the water committee had not received training in the past two years (p=0.04). Similarly, the odds of households being very satisfied were almost three times higher in communities where water committees had been trained and reported that training had improved their financial management skills (p=0.007).
Key management variables
One financial management variable, whether households pay for water, was included in the multivariable model but was not significantly associated with user satisfaction. Two activity level variables were included in the model: whether or not the water committee had met in the past month and whether or not the committee keeps maintenance schedules. The odds of households being very satisfied with their water service were lower if their community’s water committee had met in the past month, but this relationship was not significant. Keeping maintenance schedules was significant: households were three and a half times as likely to be very satisfied in communities where committees prepared maintenance schedules (p=0.02).
33 Water service delivery and household characteristics variables
Access to improved sources was related to water user satisfaction in this model. Households that used an unimproved source in both the wet and dry season were significantly less likely to be very satisfied than households that used a mix of improved and unimproved sources (p=0.03). Households that used an improved source in both the wet and dry seasons were almost four times as likely to be very satisfied as households that used a mix of improved and unimproved sources (p=0.002). Functionality was also related to water user satisfaction: users were 0.41 times less likely to be very satisfied if their most recent source had broken down for more than one day in the past year (p=0.02). Distance from the nearest improved water source was not significant in the multivariate model, but amount of time spent queueing for water was marginally significant. The odds that a user was very satisfied with his/her water service decreased slightly for each additional minute spent queueing for water (p=0.06). For example, there is a 24% decrease in the odds of a user being very satisfied for each additional hour spent
34
CHAPTER 4: DISCUSSION
The results reveal an association between key management activities and improved water system outcomes in Northern Ghana. Holding community meetings and practicing non-monetary resource
mobilization were associated with higher odds of functionality. Attending community meetings and living in a community where the water committee prepared maintenance schedules were associated with higher odds of users being very satisfied. While it is certainly plausible that these activities could directly
contribute to better functionality and greater user satisfaction, it may also be that they are by-products of other practices which produce these desirable outcomes; given the limitations of a study designed to make the most of available data, we cannot attribute causality to these practices. Whether or not they may be viewed as direct “causes”, however, these activities can be considered useful indicators of effective management leading to better outcomes for water committees in Northern Ghana. Furthermore, the results show that the right supporting environment factors also promote improved water system outcomes: access to tools and spare parts, access to outside support, and training.
Community Engagement
35
satisfaction, and community engagement would be beyond the scope of this research. Results from qualitative research that examined the relationship between social capital and sense of ownership and improved outcomes for community managed water systems in Ghana, Kenya, and Zambia (Kelly et al., n.d.) provide additional insight: successful water committees use inclusive decision making as a tool to foster a sense of ownership among community members, which can lead to greater participation in the decision making process or resource mobilization activities.
This finding is supported by Walters and Chinowky (2016), who used graphical modeling and factor networks to examine factors related to functionality of community managed water points in Nicaragua. They found that organizing and holding community meetings was a key factor related to water system functionality.
Other studies that have examined the relationship between community meetings and improved outcomes focus on participation during the project planning phase. Prokopy (2004) and Marks et al. (2014) found that household participation during the project planning phase was linked to improved project outcomes in India and Ghana, respectively. Although our findings on the benefits of community engagement are similar, it is difficult to compare the effect of water committee efforts to engage a community after construction to efforts made during the planning phase. The former relates to
management effectiveness while the latter could be the result of short-term efforts made by an NGO to engage the community during project implementation. It is plausible that post-construction community engagement initiated by the water committee has a more meaningful association with project success in the long term. However, this type of community engagement is seldom mentioned in the literature, and the results of this study suggest that it should be considered for future research.
36
Financial Management
Much of the research surrounding financial management concerns fee collection or payments in the form of money. This research looked at an expanded concept of resource mobilization by considering not only whether users pay for water, but also whether users engage in other forms of non-monetary resource mobilization (defined as either communal labor (e.g. communal farming), contribution of goods or livestock (e.g. shea nuts, maize, bowl of rice), fundraising activities, or a combination of the three mechanisms):
“In some communities, water users will make non-monetary contributions to help keep water facilities running. Do you know of one or more community members who have contributed the following: [Read answer choices and choose all that apply]?
a) Community labor (e.g. communal farming)
b) Non-monetary contributions (e.g. shea nuts, maize, bowl of rice) c) Fundraising activities
d) Other, please specify e) Don’t know
f) Not applicable”
Communal labor was the most common response (46% of communities reported practicing) and contribution of goods or livestock was the second most common (15%). In particular, communities in this region are known to practice community labor by organizing communal farming activities in which
community members collectively farm a piece of land to raise money for the water system.
Although the intention of asking water committees about communal labor practices was to discern whether communities were coming together in a collective effort to raise money for the water system, it is certainly possible that this response could have been selected in communities where water users volunteer their time to fix the water system. However, this question was not intended to capture community labor in the form of repairs. The term “community labor” was derived by the data collectors who had extensive experience working in this region, and the intention of this term was emphasized through training.
37
functionality. The two other resource mobilization categories, only monetary and combination of monetary and non-monetary, were not significant. It is unclear why practicing only non-monetary resource mobilization would have a significant association with functionality but practicing both monetary and non-monetary resource mobilization would not. One possible explanation is that non-monetary resource mobilization has an element of community engagement. Communities where some users pay money and others contribute non-monetary resources may not fully benefit from this community engagement component. This is consistent with findings from qualitative research on resource mobilization in Ghana, Kenya, and Zambia (Behnke et al., 2017) which suggested that non-monetary resource mobilization might contribute to inclusivity and greater community participation in water point management.
Two studies using multivariate regression showed that monetary water user payments were associated with higher odds of borehole functionality in specific countries within Sub-Saharan Africa ((Fisher et al., 2015), (Foster & Hope, 2016)). Our preliminary analysis also indicated that water user payments were associated with functionality. However, once we accounted for non-monetary resource mobilization, monetary fee collection was no longer significantly associated with functionality.
Surprisingly, water points that were managed by committees that had money saved for repairs had significantly lower odds of functionality. This was true for both savings categories: those with 500 Ghana Cedis (approximately 100 USD) or less and those with more than 500 Ghana Cedis. It is possible that some water committees save money because they are managing water systems that break down more frequently, or alternatively, water committees with no savings may have higher odds of
functionality because they are spending income regularly on maintenance or repairs to keep the system running. Given the cross-sectional study design, it is not possible to determine which came first: savings or breakdowns.
38
identified “significant” savings as an indicator of financial durability for community managed water systems in the Dominican Republic. The culture surrounding savings likely vary by context. Although having money on hand to pay for repairs may be beneficial in some contexts, excess cash may be a burden or liability in others (Whittington et al., 2009). This could be true for our study, especially considering the success of non-monetary resource mobilization, which is likely to reduce the amount of excess funds that committees have on-hand. Regardless, our findings show that quantity of money in savings is not an indicator of effective management for the communities included in this study.
Activity Level
Preparation of maintenance schedules by committees was significantly associated with user satisfaction. Two past studies considered the role of maintenance activities in improving water system outcomes, but both studies examined the effect of maintenance on functionality. Foster (2013) and Schweitzer and Mihelcic (2012) found an association between maintenance activities and functionality in Uganda and the Dominican Republic respectively.
Two activity-level variables, 1) proportion of committee that is female, and 2) committees meet regularly with 100% attendance at the last meeting, were included in the functionality model and neither was found to be significantly associated with functionality. This is surprising because preliminary analysis revealed that both variables were significantly associated with functionality in univariate regression. However, in a multivariable model that controlled for community and facility characteristics along with other management variables, these variables were no longer significant contributors to functionality outcomes.
39
project outcomes, while Foster (2013) found that handpumps were more likely to be functional with women on the committee, and Madrigal et al. (2011) found that committees performed better with female members.
Knowledge, Skills, and Supporting Environment
The results from both models indicated an association between supporting environment variables and improved water system outcomes. Users were two times more likely to be satisfied with their water service when their water committee had received training in the past two years and almost three times more likely to be satisfied if that committee reported that the training had improved their financial
management skills. Preliminary analysis revealed that training was not associated with functionality in this dataset, so training was not included as a variable in the functionality model. However, access to tools and spare parts and access to outside support were both associated with higher odds of functionality.
Our findings linking committee training to higher user satisfaction are consistent with Whittington et al. (2009), who found that committee training was associated with user satisfaction in rural
communities in Ghana and Bolivia. This study also found that committee training was associated with system performance. Whittington et al. (2009) is one of a few studies that draw an association between committee or operator training and functionality or other measures of system performance (Foster 2013, Davis et al. 2008). We did not find an association between committee training and functionality, and thus, did not include it in the final multivariate functionality model. Although this discrepancy may seem surprising, 96% percent of water committees included in our study had received training at some point. Therefore, we looked specifically at committees that had received training in the past two years. It is possible that committees with recent training did not have an advantage over committees that had received training more than two years ago. However, there are a number of other reasons why this study may not have found a relationship between training and functionality, such as quality of training or water committee turnover since the last training.
40
repair-person or team. This variable likely serves as a measure of competence, even when the committee has not actually benefitted from the services of a repair-person. Committees that know who to call for outside support may be better organized and better equipped to deal with management issues,
regardless of whether they have ever called for help. It’s also possible that this variable is an indicator of other advantages. Committees with access to outside support may be located closer to cities or roads and have greater access to additional resources.
To our knowledge, this is the first study to differentiate between communities who have called for outside support, have never called but have access to outside support, and have no outside support. However, several studies have linked access to outside support or PCS with water system functionality. Water committees in Sierra Leone that did not have access to a mechanic experienced higher rates of non-functionality (Foster, 2013). Davis et al. (2008) found that communities that received management oriented PCS visits had better performing systems in Bolivia. Fisher et al. (2015) found in Ghana that functionality correlates inversely with the number of days that a community must wait for an outside mechanic to arrive. Our findings linking availability of tools and spare parts with increased odds of functionality are also consistent with findings from Foster (2013) and Fisher et al. (2015).
Limitations
There are several limitations to this work. Foremost, the study is limited by its cross-sectional design that examines the relationship between management characteristics and two outcome variables that are measured at one point in time: functionality and user satisfaction. Because this is a cross-sectional study, it is not possible to demonstrate a causal relationship between the independent variables and the two outcome variables. As such, this study seeks to shed light on the relationship between management and water system sustainability by identifying associations between activities and characteristics and two outcomes of interest.
41
Despite this, functionality was still considered to be a rigorous dependent variable because it is a straight-forward and easy to measure outcome.
Much data about water committee characteristics are based on direct response questions that are susceptible to recall bias and other forms of response bias. This analysis was based on data from 124 communities. For future analysis, a larger dataset would be beneficial. Although some of our key
management variables could be considered for inclusion in studies outside of Northern Ghana, the results from this work are specific to two regions in Northern Ghana and cannot be generalized to other
42
CHAPTER 5: CONCLUSION
This study examined the relationship between committee activities and characteristics and two improved water system outcomes in Northern Ghana: water point functionality and water user
satisfaction. Most notably, holding community meetings, practicing non-monetary resource mobilization, and preparing maintenance schedules were associated with improved outcomes. Supporting environment factor (access to tools and spare parts, access to outside support, and training) were also associated with improved outcomes. Given the limitations of cross-sectional studies, we cannot contribute causality to these practices, but we can think of these activities and characteristics as indicators of effective
management for water committees in Northern Ghana. This study examined outcomes at both the water point and individual household level by modeling both functionality and user satisfaction. Considering both levels allowed for examination of interconnections between specific committee tasks, community engagement, the supporting environment, and improved outcomes. In addition to identifying three possible indicators for water committee effectiveness in Northern Ghana, this study provides insight on the role of water committee activities related to community engagement and financial management that has not been addressed by past studies.
Past research on community engagement has focuses on participation before or during
construction and financial involvement through fee payments. The results of this study show that efforts made by the water committee to engage the community after construction is complete are associated with improved water system outcomes. Odds of a water point being functional were higher when they were managed by water committees that engaged the community through meetings and non-monetary resource mobilization activities. Additionally, individuals who participated in community meetings were more satisfied with their water service. The success of non-monetary resource mobilization activities in these communities (i.e. communal labor (e.g. communal farming) and donation of goods and/or
43
opportunity to increase community engagement. Future research should focus on better understanding the mechanisms associated with water committee led community engagement activities and identifying meaningful mechanisms for engaging community members, and should be performed over a period of time to reduce some of the uncertainty of the directionality of relationships.
Even though the literature surrounding community management often points to saving money as an important aspect of management, the existence of water committee savings was not a robust
indicator of good management in our study communities. In fact, savings were associated with water point non-functionality. This finding, coupled with the apparent benefits of non-monetary resource mobilization, indicates that it may be necessary to begin a broader conversation that considers resources other than fee collection and savings since these activities do not appear to be the best indicators of management effectiveness. Future research should seek to explore the relationship between revised financial management indicators and improved water system outcomes. The revised indicators should be based upon an expanded definition of resource mobilization.
In the coming years, NGOs and governments will strive to achieve Target 6.B of the SDGs by working to support and strengthen community management institutions. The results indicate that
44
APPENDIX: SURVEY INSTRUMENTS
Question Response
1. Date _________________________
2. Time: Enter hour _________________________ 3. Time: Enter minutes _________________________ 4. GPS Coordinates _________________________
Burkina Faso______ Ethiopia______ Ghana______ India______ Mali______ Mexico______ Niger______
6. Region _________________________ 7. District ID _________________________
CARE______ CRS______ One Drop______ UNC______ UNICEF______ WaterAid______ World Vision______ WSA______
9. Your name _________________________ 10. Name of community _________________________ 11. Community ID _________________________
12. How many people live in this community? _________________________ 13. How many water points does this community have? Please include both waterpoints that
are working and those that are not currently working. _________________________ 14. How many of these water points are currently functioning? _________________________ 15. How many boreholes does this community have? Please include both boreholes that are
working and those that are not currently working. _________________________ 16. How many of these boreholes are currently functioning? _________________________
Yes______ No______ Not applicable______ Don't know______ Decline to state______
18. How long ago was the triggering meeting held? _________________________
19. Days, Weeks, Months, or Years
Day(s)______ Week(s)______ Month(s)______ Year(s)______
20. Have any new household toilets/latrines been constructed in this community since the CLTS triggering meeting was held?
Yes______ No______ Not applicable______ Don't know______ Decline to state______
21. How many new household toilets/latrines have been constructed in this community since
the CLTS triggering meeting was held? _________________________
Yes______ No______ Not applicable______ Don't know______ Decline to state______
23. Does the community have a sign or document showing its ODF status?
Yes______ No______ Not Applicable______ Don't Know______ Decline to State______
24. [Photo] Take a photo of the ODF sign or other ODF documentation _________________________
25. [Direct Observation] Year community certified ODF [If observation not possible ask]
When year this community certified as ODF? _________________________ 26. How many toilet facilities/latrines are there in this community? Please include both those
that are used and those that are not in use. _________________________ Yes______
27. Does anyone in your community sell latrine construction materials?
Only answer if you responded Yes to Q20
22. Has this community been certified as ODF (open defecation-free)?
Only answer if you responded Yes to Q22
Only answer if you responded Yes to Q23
Only answer if you responded Yes to Q22
17. Has a CLTS triggering meeting been held in this community?
Only answer if you responded Yes to Q17
Only answer if you responded Yes to Q17
Only answer if you responded Yes to Q17 Community Survey
5. Country
8. Organization
Community Characteristics
Sanitation and Hygiene Practices