PHARMACOGENOMICS OF VENTRICULAR CONDUCTION IN MULTI-ETHNIC
POPULATIONS
Amanda Anne Seyerle
A dissertation submitted to the faculty at the University of North Carolina at Chapel Hill in partial fulfillment of the requirements for the degree of Doctor of Philosophy in the
Department of Epidemiology in the Gillings School of Global Public Health.
Chapel Hill 2016
©2016
ABSTRACT
Amanda Anne Seyerle: Pharmacogenomics of Ventricular Conduction in Multi-Ethnic Populations
(Under the direction of Christy L. Avery)
Adverse drug reactions (ADRs) pose a serious public health burden, yet the role of genetics in drug response remains incompletely characterized. Thiazide diuretics, commonly used anti-hypertensives, may cause QT interval (QT) prolongation, a major drug
development barrier that increases risk for highly fatal and difficult to predict ventricular arrhythmias. We thus examined whether common SNPs modified the association between thiazide use (17% mean prevalence) and QT or its component parts (QRS interval, JT interval) by performing ancestry-specific, trans-ethnic, and cross-phenotype genome-wide analyses of European (66%), African American (15%), and Hispanic (19%) populations (N-78,199). Analyses leveraged longitudinal data, incorporated corrected standard errors to account for underestimation of interaction estimate variances, and evaluated evidence for pathway enrichment. Although no loci achieved genome-side significance (P<5x10⁻⁸), we found suggestive evidence (P<5x10⁻⁶) for SNPs modifying the thiazide-QT association at 22 loci, including biologically plausible ion transport loci (e.g. NELL1, KCNQ3).
Given our highly plausible, but only suggestive findings and our observational cohort setting, we next examined the influence of prevalent user bias and exposure misclassification on pharmacogenomics studies conducted in observational settings. Specifically, we
(whole cohort, active comparator), and two scenarios (extreme or modest drug effects) to enable comparison of 12 settings. For each setting, we simulated N=120,000 participants, conducted 10,000 iterations, applied an alpha=5x10⁻⁸, and introduced varying degrees of prevalent user bias and drug exposure misclassification. When large drug effects (>10 ms change in QT) or exposure misclassification were present, drug-SNP interaction estimates were biased (bias range: 0.02–3.4 ms) across settings. Under no settings did power to detect the drug-SNP interaction estimate exceed 80% for effects less than 2 ms; detection of drug effects below 2 ms required a longitudinal design with at least 150,000 participants. Results from this dissertation suggest that despite leveraging longitudinal data in 78,199 participants, our study was likely underpowered to detect modest or clinically significant
pharmacogenomics effects on QT. Future pharmacogenomics efforts will require even larger sample sizes and innovative methods to enable prevention of ADRs in the large and
To my family and friends, who put up with my ramblings during this immense undertaking
TABLE OF CONTENTS
LIST OF TABLES ... x
LIST OF FIGURES ... xii
LIST OF ABBREVIATIONS ... xv
LIST OF GENE NAMES ... xxi
CHAPTER 1: OVERVIEW ... 1
CHAPTER 2: SPECIFIC AIMS ... 4
CHAPTER 3: BACKGROUND AND SIGNIFICANCE... 6
Ventricular Conduction ... 6
A. Electrical Conduction of the Heart ... 6
B. Ventricular Conduction on the Electrocardiogram ... 13
QT Interval Prolongation ... 19
C. Risk Factors ... 20
D. Drug-Induced QT Prolongation ... 23
E. Categorical Versus Continuous Measures of QT Prolongation ... 29
F. Potential Clinical Outcomes of Prolonged QT ... 30
QT Interval Genetics ... 37
A. Heritability ... 37
B. Early Studies ... 40
C. Genome-Wide Association Studies ... 43
D. Gene-Environment Studies ... 49
A. Pharmacologic Characteristics ... 51
B. Indications of Use ... 52
C. Prevalence ... 53
D. Thiazide-Induced QT Prolongation ... 54
Pharmacogenomics ... 58
A. Pharmacogenomics of QT-Prolonging Drugs ... 59
B. Pharmacogenomics of Thiazide Diuretics ... 61
Bias in Pharmacoepidemiologic and Pharmacogenomic Studies ... 63
Multi-Ethnic Populations ... 65
Public Health Significance ... 66
CHAPTER 4: RESEARCH PLAN ... 68
Overview ... 68
Specific Aim 1 ... 68
A. Study Populations ... 69
B. Outcome Assessment ... 76
C. Exposure Assessment... 76
D. Data Analysis ... 77
E. Sample Size and Statistical Power ... 86
Specific Aim 2 ... 87
A. Simulation Overview ... 88
B. Simulation Parameters and Values ... 89
C. Simulation Models and Analyses... 90
Integration of Specific Aims 1 and 2 ... 93
CHAPTER 5: RESEARCH PAPER 1-PHARMACOGENOMICS STUDY OF THIAZIDE DIURETICS AND QT INTERVAL IN MULTI-ETHNIC POPULATIONS: THE COHORTS FOR HEART AND AGING RESEARCH IN GENOMIC EPIDEMIOLOGY
(CHARGE) ... 97
Introduction ... 97
Materials and Methods ... 98
A. Study Populations ... 98
B. Study Design ... 99
C. Medication Assessment ... 100
D. ECG Interval Measurement ... 101
E. Genotyping and Imputation ... 101
F. Statistical Analyses ... 102
G. Statistical Power Simulations ... 104
Results... 105
A. Study Characteristics ... 105
B. Genome-Wide Analysis of Interaction Between Thiazides and QT Interval ... 105
C. Genome-Wide Analysis of Interaction Between Thiazides and QRS Interval or JT Interval ... 106
D. Cross-Phenotype Meta-Analysis ... 107
E. Gene and Pathway Enrichment Analysis ... 107
F. Statistical Power... 107
Discussion ... 108
Tables and Figures ... 112
CHAPTER 6: RESEARCH PAPER 2-EFFECT OF PREVALENT USER BIAS AND EXPOSURE MISCLASSIFICATION ON
PHARMACOGENOMICS STUDIES CONDUCTED IN
OBSERVATIONAL COHORT SETTINGS: A SIMULATION STUDY ... 138
Introduction ... 138
Materials and Methods ... 140
A. Simulation Overview ... 140
B. Simulation Parameters and Values ... 141
C. Analysis of Drug-SNP Interactions ... 143
Results... 144
A. Simulations with Drug-SNP Interaction = 0 and Varied SNP Main Effect ... 145
B. Simulations with SNP Main Effect = 0 and Varied Drug-SNP Interaction Effect ... 146
C. Simulations with Varied Drug and ADR Effects ... 147
D. Simulations with Reduced Specificity and Sensitivity ... 148
E. Power Across Varying Sample Sizes ... 149
Discussion ... 149
Tables and Figures ... 153
CHAPTER 7: DISCUSSION AND CONCLUSION ... 166
APPENDIX 1: SUMMARY RESULTS FROM FIVE LARGEST GENOME-WIDE ASSOCIATION STUDIES OF QT (POPULATIONS ~10,000 OR GREATER) ... 173
APPENDIX 2: STUDY- AND RACE/ETHNIC-SPECIFIC QUANTILE-QUANTILE PLOTS OF P-VALUES FOR THIAZIDE-SNP INTERACTION ESTIMATES IN ALL PARTICIPATING STUDIES FOR QT, QRS, AND JT INTERVAL ANALYSES ... 177
LIST OF TABLES
Table 1. Discovery of the Structures of the Cardiac Conduction System ... 6
Table 2. Cardiac Ion Channels ... 9
Table 3. Alpha Subunits of Cardiac Potassium Channels ... 12
Table 4. Heart Rate Correction Formulae for QT Interval ... 15
Table 5. Acquired Clinical Causes of QT Prolongation ... 20
Table 6. List of Cardiac Medications by Category That Prolong the QT Interval ... 24
Table 7. List of Non-Cardiac Medications by Category That Prolong the QT Interval ... 25
Table 8. Review of Four Studies of QT Prolongation and CHD Risk in Black and White Men and Women ... 33
Table 9. Review of 11 Studies of QT Prolongation and All-Cause or CVD Mortality Risk ... 38
Table 10. Genes Associated With Congenital Forms of Long and Short QT Syndrome ... 41
Table 11. Summary Results of QT and QRS Genome-Wide Association Studies ... 47
Table 12. Prevalence of Thiazide Diuretic Use Among Hypertensive Adults Over Time in the United States ... 54
Table 13. Study Population Characteristics ... 70
Table 14. Visit-Specific Exclusion Criteria ... 75
Table 15. Genotyping Platforms ... 78
Table 16. Simulation Parameters and Scenarios ... 91
Table 17. Study Population Characteristics of 25 Contributing Study Populations ... 112
Table 19. ECG Measurement Methods for 14 Participating Studies Included in the Pharmacogenomic Analysis of QT, QRS, and JT in N=78,199 Participants ... 114 Table 20. Genotyping Characteristics for the 14 Studies Included in the
LIST OF FIGURES
Figure 1. Electrical Conduction System of the Heart ... 7
Figure 2. Action Potential of the Ventricular Cell and Associated Ion Conductances ... 8
Figure 3. ECG Rhythm with Labeled Intervals ... 14
Figure 4. Action Potential of the Ventricle Cell and Corresponding Surface ECG Components ... 15
Figure 5. QTc Distribution in the U.S. Population by Age and Sex ... 19
Figure 6. Schematic Representation of the HERG (KCNH2) Channel ... 28
Figure 7. ECG Rhythm Strip in a Patient with Torsades de Pointes ... 31
Figure 8. Sources of Variance in QT Interval ... 39
Figure 9. Indirect Associations in GWAS Using Linkage Disequilibrium ... 44
Figure 10. Molecular Structure of Thiazide and Thiazide-Like Diuretics... 50
Figure 11. Transport Mechanisms of the Distal Convoluted Tubule ... 51
Figure 12. Structure of Ion Channel Proteins Involved in Drug-Induced Long QT Syndrome ... 60
Figure 13. Flowchart of In-Silico Functional Characterization ... 85
Figure 14. Statistical Power Curves, Presented for K=1, 3, and 5 Variants and a Range of Minor Allele Frequencies ... 85
Figure 15. Conceptual Model of Relationship Between Study Variables ... 88
Figure 16. Flowchart of Simulation Analysis Process ... 92
Figure 17. Scenarios Leading to Prevalent User Bias in Pharmacoepidemiology Studies ... 92
Figure 18. Quantile-Quantile Plots of P-values for Thiazide-SNP Interaction Estimates for QT Interval, QRS Interval, and JT Interval Analyses After Inverse-Variance Weighted Meta-Analysis in METAL ... 123
Figure 20. Manhattan Plots of Bayes Factors for Thiazide-SNP
Interaction Estimates After Bayesian Trans-Ethnic Meta-Analysis in MANTRA Across European Descent, African American, and Hispanic/
Latino Populations ... 125
Figure 21. Manhattan Plots of P-values for Thiazide-SNP Interaction Estimates for QRS, and JT Intervals ... 126
Figure 22. Manhattan Plots of P-values for Thiazide-SNP Interaction Estimates After Cross-Phenotype Meta-Analysis (QRS Interval, JT Interval) ... 127
Figure 23. Quantile-Quantile Plots of P-values for Thiazide-SNP Interaction Estimates After Cross-Phenotype Meta-Analysis with aSPU in European Descent, African American, and Hispanic/Latino Populations ... 128
Figure 24. Statistical Power of a Simulated Pharmacogenomics Study of QT ... 129
Figure 25. Simulation Study Timeline and Study Designs ... 154
Figure 26. Decision Tree to Classify Drug Exposure in a Simulation Study ... 155
Figure 27. Conceptual Model of Relationship Between QT-Prolonging Drug Use, QT Interval, and Adverse Drug Reactions ... 155
Figure 28. Bias, False Positive Proportion, and Power in a Pharmacogenomic Study of QT Under an Extreme and Modest Scenario in the Absence of a Drug Main Effect or the Absence of a Drug-SNP Interaction Effect ... 156
Figure 29. Bias and False Positive Proportion in a Pharmacogenomic Study of QT Under an Extreme and Modest Scenario in the Absence of a Drug-SNP Interaction Effect... 157
Figure 30. Bias in a Pharmacogenomic Study of QT Under an Extreme and Modest Scenario in the Absence of a Drug-SNP Interaction Effect Assuming a Minor Allele Frequency of 5% or 45% ... 158
Figure 31. False Positive Proportion or Power in a Pharmacogenomic Study of QT Under an Extreme and Modest Scenario in the Absence of a Drug Main Effect or the Absence of a Drug-SNP Interaction Effect ... 159
Figure 32. Bias and Power in a Pharmacogenomic Study of QT Under an Extreme and Modest Scenario in the Absence of a Drug Main Effect ... 160
Figure 34. False Positive Proportion or Power in a Pharmacogenomic Study of QT Under an Extreme and Modest Scenario in the Absence of a Drug-SNP Interaction Effect Assuming a Minor Allele Frequency of 5% or 45% ... 162 Figure 35. Bias in a Pharmacogenomics Study With Varying Levels of Drug Effect on QT Duration, Prolonged QT Effect on Adverse Drug Reactions and Adverse Drug Reactions on Drug Continuation... 163 Figure 36. Bias and Power in a Pharmacogenomics Study Under an Extreme or Modest Scenario with Reduced Specificity and Sensitivity of Medication Assessment ... 164
LIST OF ABBREVIATIONS
AA African American or African descent population
AC Active comparator
ADP Adenosine diphosphate ADR Adverse drug reaction
AGES Age, Gene/Environment Susceptibility – Reykjavik Study ARIC Atherosclerosis Risk in Communities
AS Asian descent population ATP Adenosine triphosphate AV Atrioventricular
BP Blood pressure
bpm Beats per minute
BRIGHT British Genetics of Hypertension Ca++ Calcium ion
CACN Calcium channel gene family
CARe Candidate-gene Association Resource
CARDIA The Coronary Artery Risk Development in Young Adults Study CHARGE Cohorts for Heart and Aging Research in Genetic Epidemiology CHD Coronary heart disease
CHF Congestive heart failure CHS Cardiovascular Health Study CI Confidence interval
CKD Chronic kidney disease
COGENT Continental Origins and Genetic Epidemiology Network CVD Cardiovascular disease
DALY Disability adjusted life years DCT Distal convoluted tubule df Degrees of freedom
diLQTS Drug-induced long QT syndrome ECG Electrocardiogram
eMERGE Electronic Medical Records and Genomics ENCODE Encyclopedia or DNA Elements
ERF Erasmus Rucphen Family Study ESRD End-stage renal disease
EU European descent population
EUROSPAN European Special Population Research Network FDA Food and Drug Administration
FHS Framingham Heart Study
GARNET GWAS of Treatment Response in Randomized Clinical Trials GEE Generalized estimating equation
GenNOVA EURAC – Institute for Genetic Medicine GRIP Genetic Research in Isolated Populations
GS Gitelman syndrome
GWAS Genome-wide association study
GxE Gene-environment
HGP Human Genome Project
Health ABC Health, Aging, Body and Composition HL Hispanic/Latino population
HMO Health maintenance organization HNR Heinz Nixdorf Recall Study
HR Hazard ratio
ICC Interclass correlation coefficient JHS Jackson Heart Study
JNC 7 “The Seventh Report of the Joint National Committee on Prevention, Detection, Evaluation, and Treatment of High Blood Pressure”
JT JT Interval
K+ Potassium ion
KCN Potassium channel gene family
kg Kilogram
KORA Cooperative Health Research in the Region of Agusburg LD Linkage disequilibrium
LIFE Losartan Intervention for Endpoint Reduction in Hypertension LQTS Long QT syndrome
MAF Minor allele frequency MEM Mixed effects model
MESA Multi-Ethnic Study of Atherosclerosis Mg++ Magnesium ion
MI Myocardial infarction
MOPMAP Modification of Particulate Matter-Mediated Arrhythmogenesis in Populations MRFIT Multiple Risk Factor Intervention Trial
mg Milligram
ms Millisecond
MS1 Manuscript 1 of dissertation project MS2 Manuscript 2 of dissertation project N Number of participants
Na+ Sodium ion
NCC Na+-Cl- cotransporter NCX1 Na+/Ca++ exchanger
NEO The Netherlands Epidemiology of Obesity
NHANES National Health and Nutrition Examination Survey
NU New-user
OR Odds ratio
PACK Prevention of Atherosclerotic Complications with Ketanserin PIUMA Progetto Ipertensione Umbria Monitoraggio Amvulatoriale
PR PR interval
Pr(ADR) Probability of an adverse drug reaction among those on drug/probability of loss-to follow-up
PROSPER Prospective Study of Pravastatin in the Elderly at Risk PVC Premature ventricular contractions
PWG CHARGE Pharmacogenetics working group QRS QRS complex (also known as QRS interval)
QTc Heart-rate corrected QT interval
QTI QT prolongation index
QT-IGC QT Interval – International GWAS Consortium
QTmzx Limiting value of QT as heart rate approaches zero (656 ms)
RE Random effects
REGARDS REasons for Geographic and Racial Differences in Stroke RCT Randomized control trial
RR RR interval
RS Rotterdam Study
SA Sinoatrial
SardiNIA Progenia for the Sardinian public SC Sodium channel gene family SCD Sudden cardiac death
SD Standard deviation
SE Standard error
SHARe SNP Health Association Resource SHS Strong Heart Study
SIDS Sudden infant death syndrome SLC Solute carrier gene family SNP Single nucleotide polymorphism
SOL Hispanic Community Health Study/Study of Latinos SQTS Short QT syndrome
TwinsUK Twin Registry of the United Kingdom
WC Whole cohort
WHI Women’s Health Initiative WHIMS WHI Memory Study WHO World Health Organization YLL Years of life lost
LIST OF GENE NAMES ACE Angiotensin I converting enzyme
ANK2 Ankyrin 2, neuronal
ATP1B1 ATPase, Na+/K+ transporting, beta 1 polypeptide
CACNA1C Calcium channel, voltage-dependent, L type, alpha 1C subunit
CACNA1D Calcium channel, voltage-dependent, L type, alpha 1D subunit
CACNA1E Calcium channel, voltage-dependent, R type, alpha 1E subunit
CACNA1G Calcium channel, voltage-dependent, T type, alpha 1G subunit
CACNA1H Calcium channel, voltage-dependent, T type, alpha 1H subunit
CACNA2D1 Calcium channel, voltage-dependent, alpha 2/delta subunit 1
CACNB2B Calcium channel, voltage-dependent, beta 2 subunit
CAV1 Caveolin 1, caveolae protein, 22kDa
CYP2C9 Cytochrome P450, family 2, subfamily C, polypeptide 9
CYP2D6 Cytochrome P450, family 2, subfamily D, polypeptide 6
CYP3A4 Cytochrome P450, family 3, subfamily A, polypeptide 4
CYP11B2 Cytochrome P450, family 11, subfamily B, polypeptide 2
HCN2 Hyperpolarization activated cyclic nucleotide-gated potassium channel 2
HCN4 Hyperpolarization activated cyclic nucleotide-gated potassium channel 4
HERG Human ether-a-go-go related gene (a.k.a. KCNH2)
KCNA4 Potassium voltage-gated channel, shaker-related subfamily, member 4
KCNA5 Potassium voltage-gated channel, shaker-related subfamily, member 5
KCNA7 Potassium voltage-gated channel, shaker-related subfamily, member 7
KCNAB1 Potassium voltage-gated channel, shaker-related subfamily, beta member 1
KCNC1 Potassium voltage-gated channel, Shaw-related subfamily, member 1
KCNC4 Potassium voltage-gated channel, Shaw-related subfamily, member 4
KCND2 Potassium voltage-gated channel, Shal-related subfamily, member 2
KCND3 Potassium voltage-gated channel, Shal-related subfamily, member 3
KCNE1 Potassium voltage-gated channel, Isk-related family, member 1
KCNE2 Potassium voltage-gated channel, Isk-related family, member 2
KCNH2 Potassium voltage-gated channel, subfamily H (eag-related), member 2 (formerly HERG)
KCNIP2 Kv channel interacting protein 2
KCNJ2 Potassium inwardly-rectifying channel, subfamily J, member 2
KCNJ3 Potassium inwardly-rectifying channel, subfamily J, member 3
KCNJ5 Potassium inwardly-rectifying channel, subfamily J, member 5
KCNJ11 Potassium inwardly-rectifying channel, subfamily J, member 11
KCNJ12 Potassium inwardly-rectifying channel, subfamily J, member 12
KCNK1 Potassium channel, subfamily K, member 1
KCNK3 Potassium channel, subfamily K, member 3
KCNK4 Potassium channel, subfamily K, member 4
KCNQ1 Potassium voltage-gated channel, KQT-like subfamily, member 1
LIG3 Ligase III, DNA, ATP-dependent
LITAF Lipopolysaccharide-induced TNF factor
NDRG4 NDRG family member 4
NEDD4L Neural precursor cell expressed, developmentally down-regulated 4-like, E3 ubiquitin protein ligase
NOS1AP Nitric oxide synthase 1 (neuronal) adapter protein
PLN Phospholamban
PRKCA Protein kinase C, alpha
SCN1B Sodium channel, voltage-gated type I, beta subunit
SCN2B Sodium channel, voltage-gated, type II, beta subunit
SCN3B Sodium channel, voltage-gated, type III, beta subunit
SCN4B Sodium channel, voltage-gated, type IV, beta subunit
SCN5A Sodium channel, voltage-gated, type V, alpha subunit
SCN10A Sodium channel, voltage-gated, type X, alpha subunit
SLC12A3 Solute carrier family 12 (sodium/chloride transporter), member 3
SLC22A23 Solute carrier family 22, member 23
SLC8A1 Solute carrier family 8 (sodium/calcium exchanger), member 1
SLCO3A1 Solute carrier organic anion transporter family, member 3A1
TRPM6 Transient receptor potential cation channel, subfamily M, member 6
TBX5 T-box 5
WNK1 WNK lysine deficient protein kinase 1
WNK4 WNK lysine deficient protein kinase 4
VKORC1 Vitamin K epoxide reductase complex, subunit 1
CHAPTER 1: OVERVIEW
Over the past decade, the use of prescription drugs has skyrocketed, with nearly half of all Americans taking at least one prescription drug.1 Despite the considerable increases in drug exposure, variability in drug response, a significant cause of morbidity and mortality accounting for approximately 100,000 deaths and 2.2 million serious health effects
annually,2-5 remains poorly understood.6 One promising avenue to understanding variability in drug response is offered by pharmacogenomics,7 which as the potential to illuminate novel pathways with the goal of informing drug development and selection,8-10 modifying dosing regimens,11-15 and avoiding adverse drug reactions.16-18
Pharmacoepidemiology is a branch of epidemiology that seeks to understand both the use of and the effects of drugs in populations. Pharmacogenomics is an extension of
pharmacoepidemiology and evaluates the role of genetics in drug response. This work will perform a genome-wide association study (GWAS) that examines whether common genetic variants modify the association between thiazide diuretics and the QT interval (QT), a measure of ventricular depolarization and repolarization taken from the electrocardiogram (ECG). QT is a promising candidate for pharmacogenomic study, as it is a risk factor for ventricular tachyarrhythmia,19 coronary heart disease,20 congestive heart failure,21 stroke,22 cardiovascular mortality, and all-cause mortality.23 Furthermore, QT is highly heritable (35-40%),24-28 with early family studies identifying rare and highly penetrant mutations
common single nucleotide polymorphisms (SNPs) associated with modest increases in QT.
30-35
Thiazide diuretics, an increasingly common antihypertensive therapy used by over a quarter of the hypertensive population in the U.S.,36, 37 are one of many common
pharmaceuticals that may cause QT prolongation.38-40 However, the mechanisms underlying thiazide-induced QT prolongation is not well understood.41-43 Given the rising prevalence of thiazide use, the established genetic basis of QT, the inter-individual variability in thiazide response, and the Food and Drug Administration’s standard for regulating QT-prolonging medications, which requires a change of just 5 ms, a change easily obtained through both pharmaceutical and genetic exposures,44 it is critical that pharmacogenomic interactions be identified. Pharmacogenomics remains one of the few areas where genetic research has been translated into actionable results and the pharmacogenomics of thiazides and QT
prolongation is an excellent candidate for pharmacogenomics study.
Pharmacogenomics studies like the one presented herein often leverage the extensive data available in large observational study settings, a setting in which
pharmacoepidemiologic studies are known to be prone to multiple forms of bias (e.g.
prevalent user bias, indication/contraindication, healthy-user effects, etc.).45-51 However, it is unclear if pharmacogenomic studies are subject to the same biases. For example, previous work has indicated that pharmacogenomics studies may not be subjected to the same degree of bias by indication/contraindication as pharmacoepidemiologic studies.47 However, to date, no one has evaluated how additional threats to internal validity, such as prevalent user bias, impacts pharmacogenomics studies conducted in observational settings. This
CHAPTER 2: SPECIFIC AIMS
This work will be conducted through a collaboration between the Women’s Health Initiative (WHI),52 the Hispanic Community Health Study/Study of Latinos (SOL),53 and the Cohort for Heart and Aging Research in Genomic Epidemiology (CHARGE)54
pharmacogenomics working group (PWG) investigators, yielding a diverse population of participants of European (N=58,813), African (N=15,625), and Hispanic (N=16,657) descent. We therefore will:
Specific Aim 1: Identify genetic variants that modify the association between thiazide diuretics and QT and its component parts (QRS complex [QRS]; JT interval [JT]) in European descent, African descent, and Hispanic populations.
a. Classify thiazide diuretic exposure among all cohorts using medication inventories, which have been validated in cohort studies against physiologic measurements,55 pharmacy databases,56 and serum measurements.57
b. Conduct genome-wide, race-stratified analyses to identify significant interactions between genetic variants, thiazides, and QT and its component parts (QRS; JT), leveraging longitudinal data when possible. Study and race/ethnic-stratified results will be combined across studies using fixed-effect, trans-ethnic, and cross-phenotypic meta-analytic techniques (Ntotal=78,199).
Specific Aim 2: Examine the influence of prevalent user bias and exposure misclassification caused by prevalent user bias on a pharmacogenomics study conducted in an observational setting.
a. Using simulations, evaluate bias, power, and type I error in the drug-SNP interaction caused by prevalent user bias and exposure misclassification b. Compare the results of aim 2a under different study designs (e.g. whole cohort,
CHAPTER 3: BACKGROUND AND SIGNIFICANCE
Ventricular Conduction
The role of electrical impulses in cardiac conduction was first identified in the mid-19th century by Rudolf Kollicker and Johannes Mueller, who showed that the same electrical impulses which caused a frog’s legs to kick could also cause the heart to beat.58 During the next fifty years, researchers identified and characterized all of the primary structures
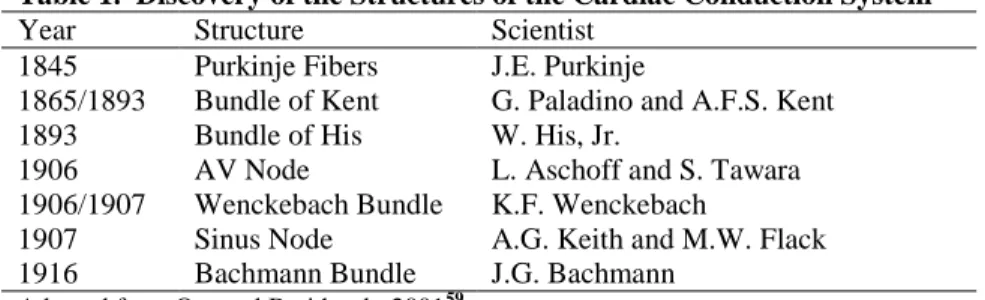
involved in conducting electrical impulses throughout the heart (Table 1, Figure 1).59 These structures control the coordinated contraction and relaxation of the cardiac muscle cells, first with the rapid contraction of the atria and followed by the slower contraction of the
ventricles, and together form the cardiac electrical conduction system.
Table 1. Discovery of the Structures of the Cardiac Conduction System
Year Structure Scientist 1845 Purkinje Fibers J.E. Purkinje
1865/1893 Bundle of Kent G. Paladino and A.F.S. Kent 1893 Bundle of His W. His, Jr.
1906 AV Node L. Aschoff and S. Tawara 1906/1907 Wenckebach Bundle K.F. Wenckebach
1907 Sinus Node A.G. Keith and M.W. Flack 1916 Bachmann Bundle J.G. Bachmann
Adapted from Oto and Breithardt, 200159
A. Electrical Conduction of the Heart
primarily found in the sinoatrial (SA) node and the atrioventricular (AV) node. These cells are responsible for generating the initial depolarizing current of the heartbeat. Myocytes make up the majority of cardiac cells but cannot generate their own action potential.
Action potentials in the heart are primarily initiated in the SA node, which is the heart’s primary pacemaker site and provide an intrinsically automated rate of depolarizations that drives the overall electrical activity of the heart.60 From the SA node, the depolarization current spreads through the myocytes of the atria. However, the AV valves, which separate the atria and the ventricles, are composed on non-conductive connective tissue which prevents the action potentials generated by the SA node from entering the ventricles
directly.58, 60 Instead, the action potential enters through the AV node, a specialized region of pacemaker cells in the wall between the atria and ventricles. The AV node conducts
electrical impulses at 1/10th the rate of the atrial cells and thus delays the conduction between the atria and ventricles, ensuring enough time for blood to exit the atria and fill the ventricles. However, once the action potential leaves the AV node, it spreads rapidly through the His-Purkinje system (Figure 1) in a process known as rapid depolarization, ensuring the spread of
Figure 1. Electrical Conduction System of the Heart
depolarization throughout the ventricles simultaneously. From here, the action potential spreads to the remaining myocytes of the ventricles through cell-to-cell conduction, causing the ventricles to contract.
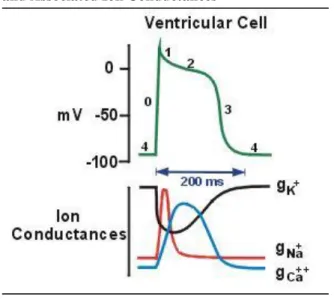
Rapid ventricular depolarization (Phase 0) is followed by a much slower period of repolarization, which consists of four phases (Figure 2). Phase 1 consists of a short, initial burst of repolarization which is then followed by a plateau phase (Phase 2), where there is minimal repolarization activity. Finally, cells undergo rapid repolarization (Phase 3) and return to their resting state (Phase 4).
Progression through each of the five action potential phases is controlled by the movement of sodium, calcium, and potassium ions into and out of the cardiac cells. Both pacemaker cells and non-pacemaker cells have multiple ion channels embedded in their membranes which control the movement of ions into and out of the cells. In their resting
Figure 2. Action Potential of the Ventricular Cell and Associated Ion Conductances
Adapted from Klabunde 201256
state, cardiac cells have a negative electrical potential relative to the outside of the cell.58, 60 The net negative electrical potential is produced through a combination of ion concentrations. K+ ions are present in higher concentrations inside the cell relative to outside while both Ca++ and Na+ ions are present in higher concentrations outside the cell relative to inside.60
Depolarization (Phase 0) occurs with the movement of Na+ into the cell. Phase 1 of
repolarization is caused by the movement of K+ ions out of the cell and is then slowed (Phase 2) by the continued, slow movement of Ca++ into the cell. Phase 3 is brought about by the end of inward Ca++ movement and the continued outward movement of K+. Resting potential (Phase 4) is maintained through the movement of K+ ions back into the cell. The ion
gradients needed to control the electrical impulses of the heart are controlled by a series of ion channels.
A.1. Sodium Channels
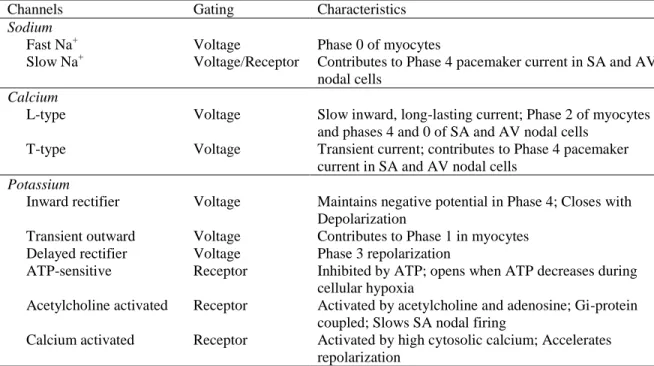
Table 2. Cardiac Ion Channels
Channels Gating Characteristics Sodium
Fast Na+ Voltage Phase 0 of myocytes
Slow Na+ Voltage/Receptor Contributes to Phase 4 pacemaker current in SA and AV nodal cells
Calcium
L-type Voltage Slow inward, long-lasting current; Phase 2 of myocytes and phases 4 and 0 of SA and AV nodal cells
T-type Voltage Transient current; contributes to Phase 4 pacemaker current in SA and AV nodal cells
Potassium
Inward rectifier Voltage Maintains negative potential in Phase 4; Closes with Depolarization
Transient outward Voltage Contributes to Phase 1 in myocytes Delayed rectifier Voltage Phase 3 repolarization
ATP-sensitive Receptor Inhibited by ATP; opens when ATP decreases during cellular hypoxia
Acetylcholine activated Receptor Activated by acetylcholine and adenosine; Gi-protein coupled; Slows SA nodal firing
Calcium activated Receptor Activated by high cytosolic calcium; Accelerates repolarization
Sodium channels are the most common ion channels found in cardiac cells, with over 100,000 sodium channels expressed in each cardiac cell and over 1 million expressed in cells of the Purkinje fibers.61 Two types of sodium channels are critical to regulating the electrical activity of the heart: fast acting and slow acting (Table 2). Fast acting sodium channels are responsible for the rapid depolarization of the myocyte. The activation gates are opened when the depolarization current spreads from cell to cell, which increases the conductance of Na+across the cell membrane (Figure 2). This allows Na+ to move into the cell but the channels close rapidly, limiting the length of time in which sodium can enter the cell.60 Slow acting sodium channels play a minor role in myocytes but are involved in the spontaneous depolarization of cardiac pacemaker cells where the slow inward movement of Na+ is partly responsible for the spontaneous depolarizing current, or pacemaker current, which
differentiates pacemaker cells from myocytes.60
Sodium channels are expressed in virtually all eukaryotic organisms; Ren et al.
identified a primitive counterpart to the eukaryotic sodium channel which is expressed in prokaryotes,61, 62 and the genes encoding sodium channel genes are highly conserved across organisms.61 The primary gene involved in the cardiac isoform of the sodium channels is
SCN5A.61, 63 However, many additional genes are involved in the encoding of human sodium channels in the heart, including many from the sodium channel (SC) family of genes such as
A.2. Calcium Channels
Similarly to sodium channels, there are two types of calcium channels influencing cardiac conduction: L-type and T-type (Table 2).60 However, the average myocyte has approximately 1/5th as many calcium channels as sodium channels.61 Despite the smaller number, calcium channels play a critical role in cardiac electrophysiology. After
depolarization, L-type calcium channels continue to allow Ca++ to flow into the myocyte. Unlike the fast acting sodium channels which cause depolarization, L-type calcium channels remain open for a longer period of time and are the primary cause of the plateau phase (Phase 2 in Figure 2).60 T-type calcium channels are, similarly to slow acting sodium channels, primarily involved in the spontaneous depolarization of pacemaker cells and play little role in the action potential of general myocytes.
Calcium channel genes are highly conserved across vertebrates.64 There are at least ten calcium channel genes in the human genome but only half are expressed in cardiac cells. Calcium channel genes belong to the CACN gene family and include CACNA1C, CACNA1D, CACNA1E, CACNA1G, and CACNA1H.61 The first three CACN genes encode isoforms of the L-type channel while the latter two encode isoforms of the T-type channel. Of the three L-type calcium channel genes, CACNA1C produces the primary isoform found in cardiac cells.61
A.3. Potassium Channels
in Figure 2) while delayed rectifier K+ channels are responsible for the increase in K+ conductance that causes Phase 3 repolarization.60 Inward rectifiers are involved in the last phases of repolarization and in setting the resting potential (Phase 4).61
Given the wide range of potassium channel subtypes, it is therefore unsurprising to find a wide variety of genes encode potassium channel subunits. These genes are highly
conserved across eukaryotes and comprise the KCN gene family.66, 67 The KCN gene family is composed of over 90 genes but only a subset are expressed in the heart.65 In addition to the genes which encode alpha subunits of the numerous cardiac potassium channels (Table 3), multiple accessory subunits are also expressed in cardiac cells: KCNIP2, KCNAB1,
KCNAB2, KCNE2, and KCNE1.61 Mutations in genes in the KCN family have been linked to inherited forms of Long QT Syndrome (LQTS), a Mendelian disorder with an increased duration of ventricular repolarization, and with the overall duration of ventricular repolarization (See Section QT Interval Genetics).
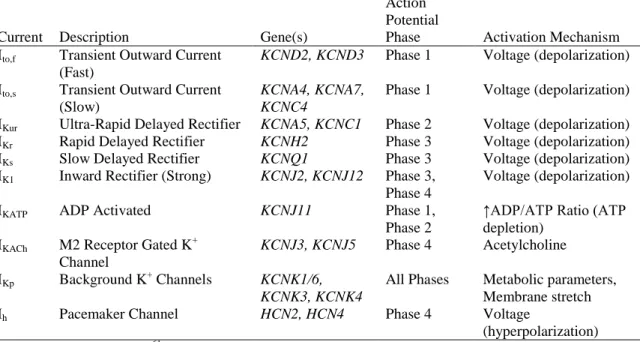
Table 3. Alpha Subunits of Cardiac Potassium Channels
Current Description Gene(s)
Action Potential
Phase Activation Mechanism Ito,f Transient Outward Current
(Fast)
KCND2, KCND3 Phase 1 Voltage (depolarization)
Ito,s Transient Outward Current (Slow)
KCNA4, KCNA7, KCNC4
Phase 1 Voltage (depolarization)
IKur Ultra-Rapid Delayed Rectifier KCNA5, KCNC1 Phase 2 Voltage (depolarization) IKr Rapid Delayed Rectifier KCNH2 Phase 3 Voltage (depolarization) IKs Slow Delayed Rectifier KCNQ1 Phase 3 Voltage (depolarization) IK1 Inward Rectifier (Strong) KCNJ2, KCNJ12 Phase 3,
Phase 4
Voltage (depolarization)
IKATP ADP Activated KCNJ11 Phase 1,
Phase 2
↑ADP/ATP Ratio (ATP depletion)
IKACh M2 Receptor Gated K +
Channel
KCNJ3, KCNJ5 Phase 4 Acetylcholine
IKp Background K+ Channels KCNK1/6,
KCNK3, KCNK4
All Phases Metabolic parameters, Membrane stretch Ih Pacemaker Channel HCN2, HCN4 Phase 4 Voltage
B. Ventricular Conduction on the Electrocardiogram
In 1887, a French scientist by the name of Gabriel Lippmann first demonstrated that the electrical impulses of the heart could be recorded from the body’s surface.59
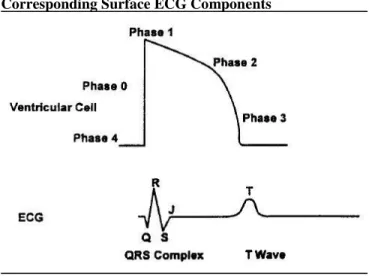
Fifteen years later, Dutch physiologist Willem Einthoven published the first modern tracings from a surface electrocardiogram (ECG).59 He identified five distinct points on the ECG rhythm, which he labeled P, Q, R, S, and T, nomenclature which is still used over a century later to describe points on the ECG (Figure 3). The P wave is produced as a depolarization wave is sent from the SA node and spreads through the atria. The break between the P wave and the Q point corresponds to the slowing of the depolarization wave as it enters the AV node. As depolarization is rapidly spread through the ventricles, the QRS complex (QRS) is produced (Figure 4).68 This is then followed by another break, which represents the plateau phase of repolarization. The final wave on the ECG, the T wave, represents the rapid phase of
repolarization (Figure 4).58, 68 Together, these points produce a number of commonly studied intervals (Figure 3). The PR interval (PR) represents the period of atrial depolarization and AV nodal conduction, including the propagation of the impulse through the bundle of His, the bundle branches, and the Purkinje fibers.69 The QT interval (QT) is a measure of the ventricular action potential and can be broken down into the QRS complex (QRS, ventricular depolarization) and the JT interval (JT, ventricular repolarization).60, 69
B.1. QT Interval
dispersion. To standardize measurement, QT is measured from the lead that has the largest T wave with the most distinct termination.69 The latter feature is particularly important, as the T wave can sometimes be difficult to define and can be influenced with by the presence of a U wave.68, 70 The U wave is a small wave sometimes seen on the ECG following the T wave; its origins are unknown but it is believed to represent repolarization of the Purkinje fibers or the prolonged repolarization of cells in the mid-myocardium.71
Despite the potential introduction of measurement error through lead placement or external environmental factors, repeatability studies have found that QT measurements are reliable.72-74 Savelieva et al. found that, over the course of 10 consecutive ECGs, QT interval measurement demonstrated a modest 1-2% coefficient of variation, or the ratio of the
standard deviation to the mean, among the general population, among a population of
myocardial infarction (MI) patients, and among patients with hypertrophic cardiomyopathy.73 Similarly, Vaidean et al. found that the interclass correlation coefficient (ICC), which is the
Figure 3. ECG Rhythm with Labeled Intervals
ratio of between-person variance to the total variance in the study, for QT was 0.86 (95% Confidence Interval [CI]: 0.81 – 0.92),74 suggesting low within-person variance in QT. Furthermore, Vaidean and colleagues demonstrated that, as the total sample size increases, the precision of the mean QT measurement for a group of study participants increases significantly, allowing studies with large sample sizes to reliably study QT and QT correlates.74
Heart Rate Correction Formulas for QT Interval
Table 4. Heart Rate Correction Formulae for QT Interval
Formula Mathematical Form
Bazett75 𝑄𝑇𝑐 = 𝑄𝑇 √𝑅𝑅 Fridericia76 𝑄𝑇𝑐 =
𝑄𝑇 √𝑅𝑅
3
Hodges77 𝑄𝑇𝑐 = 𝑄𝑇 + 1.75(𝐻𝑒𝑎𝑟𝑡 𝑅𝑎𝑡𝑒 − 60) Framingham78 𝑄𝑇𝑐 = 𝑄𝑇 + 0.154(1 − 𝑅𝑅)
Normogram79 𝑄𝑇𝑐 = 𝑄𝑇 + 𝐶𝑜𝑟𝑟𝑒𝑐𝑡𝑖𝑜𝑛 𝐹𝑎𝑐𝑡𝑜𝑟 Adapted from Aytemir 199980
QT: Uncorrected QT interval; QTc: Corrected QT interval; RR: RR interval
Normal QT intervals range from 200 to 400 ms.60 However, despite the overall reliability of QT measurements, inter-individual variation remains high, largely reflecting the
Figure 4. Action Potential of the Ventricle Cell and Corresponding Surface ECG Components
Adapted from Bednar 200168
influence of heart rate. QT is expected to be prolonged at slower heart rates and shortened at faster heart rates.38, 75, 81, 82 This range can be extreme. Data from the Framingham Heart Study (FHS) have shown that in men, QT can range from 450 ms at 40 beats per minute (bpm) to 300 ms at 120 bpm, and in women, QT can range from 465 ms at 40 bpm to 310 ms at 120 bpm.69, 78 Because of the large influence of heart rate, studies of QT commonly account for heart rate in their analysis, either through simple adjustment or through the use of one of the numerous correction formulae available in the literature. After adjustment,
corrected QT (QTc) is expected to be no greater than 440 ms and QTc greater than 500 ms is
considered critically prolonged.38, 60 One of the most commonly used correction formula is Bazett’s formula.38, 75
However, Bazett’s correction can be inaccurate at elevated heart rates.38
Because of the potential for inaccuracy when using Bazett’s formula, numerous alternatives have been suggested. Fridericia, a contemporary of Bazett’s, suggested using the cubed root of the RR interval (RR), an inverse measure of heart rate, rather than the squared root.76 In 1936, Shipley and Hallaran modified Bazett’s formula to 𝑄𝑇𝑐 = 𝑘√𝑅𝑅 where k is
𝑄𝑇𝐼 =𝑄𝑇 × (𝐻𝑒𝑎𝑟𝑡 𝑅𝑎𝑡𝑒 + 100) 𝑄𝑇𝑚𝑎𝑥
where QTmax = 656 ms; because this is a proportion, the mean value is 100 and the upper 2%
of prolonged QT have a value greater than 110, making it difficult to compare to other studies which used one of the standard correction formulae.84, 85 However even with the wide variety of correction formulae available, there is still no consensus on the preferred approach, but the suggestion has been made that it is may be necessary for each individual study to investigate which correction model best fits their data.80, 86, 87
B.2. QRS Complex
The QRS complex, sometimes referred to the QRS interval, is a measure of ventricular depolarization (Figure 3, Figure 4). It also measures an early component of ventricular repolarization (Phase 1).88 Its duration is controlled by the His-Purkinje system, composed of the His bundle, the left and right bundle branches, and the Purkinje fibers (Figure 1). The His-Purkinje system ensures the spread of the depolarization impulse from the AV node through both ventricles simultaneously. It is also during the QRS that atrial repolarization occurs but, due to its short duration and small amplitude, this process is masked by ventricular repolarization on the surface ECG.60 QRS is measured on the lead with the widest QRS complex with the sharpest onset and termination, usually one of the six precordial chest leads.69 Because QRS includes an early phase of repolarization, the
transition from the QRS complex to the ST segment can be gradual making it hard to define the J point (Figure 4). Further complicating the definition of the QRS complex is the Q wave, which is often absent on ECGs.58
aVR can lead to a false diagnosis, as the Q wave is typically wider on these leads.69
Widening of the whole QRS complex can also be indicative of malfunctions of the cardiac conduction system, e.g. bundle branch blocks. The QRS is typically wider in young populations,89 in males,90, 91 and in Whites.92 Widening of the interval is also seen in hyperkalemic populations,93-95 in obese populations,96 in populations using certain anti-arrhythmic medications93, 97, 98 and in populations on hemodialysis.99 A normal QRS
duration is between 60 and 100 ms, with about half of the general population falling near 80 ms,60, 69 although a QRS duration of as high as 110 ms is not considered abnormal.69
However, a QRS greater than 120 ms is a very specific marker of ventricular dysfunction.100,
101
B.3. JT Interval
The JT interval is a measure of ventricular repolarization and is composed of the ST segment and the T wave. The ST segment represents the plateau phase of repolarization while the T wave represents phase 3 repolarization.58 JT is generally calculated as 𝐽𝑇 = 𝑄𝑇 − 𝑄𝑅𝑆 rather than measured directly from the surface ECG. JT is highly correlated with
QT but, unlike QT and QRS, JT has not been as commonly studied.28 However, it has been suggested that, JT is better than QT for monitoring increased risks due to prolongation of ventricular repolarization, as JT represents the repolarization phase of QT and it is this phase which is predicted to be most clinically relevant.102 Tsai et al. have demonstrated that JT is a better marker of changes in repolarization duration when monitoring patients on
heart disease (CHD) (See Section Coronary Heart Disease); however, Crow et al. found that JT was actually a better predictor of CHD mortality than QT in cases where a wide QRS was present.105 These findings indicate that studies of JT are informative in addition to studies of QT and QRS.
QT Interval Prolongation
QT ranges from 200-400 ms in the general population; after adjustment for heart rate, the distribution of QT shifts upward so that intervals up to 440 ms are considered normal. QT is normally distributed and is shifted upwards in females and in older populations (Figure 5).75, 106, 107 However, malfunction of the ion channels associated with the cardiac conduction system and disruptions in the action potential of the heart, both achieved through multiple mechanisms, can lead to a shortening or lengthening of the QT interval beyond the normal range. While short QT syndrome can be pathogenic, it is exceedingly rare and is primarily congenital.108, 109 QT prolongation, however, is more prevalent in the population and can be caused by many common innate and acquired risk factors.
Adapted from Benoit 2005106
Data from the Third National Health and Nutrition Evaluation Survey, 1988 – 1994 QTc corrected for heart rate using the Fridericia formula
B A
C. Risk Factors
QT prolongation can occur through multiple mechanisms and numerous risk factors for prolonged QT have been identified. Broadly, risk factors for prolonged QT can be classified into three categories: clinical conditions, congenital conditions, and electrolyte imbalances. C.1. Acquired Clinical Conditions
Table 5. Acquired Clinical Causes of QT Prolongation
Myocardial Infarction Valvular Disease* Cardiomyopathy* Bradycardia
Subclinical Cardiovascular Disease Liver Function Impairment Diabetes Mellitus
Hypothyroidism Obesity
Anorexia
Use of QT-Prolonging Medications *Can be either acquired or congenital
Numerous clinical conditions have been identified as risk factors for QT
prolongation (Table 5). Multiple diseases of the heart can interfere with normal cardiac conduction, including myocardial infarction,69, 110, 111 structural heart disease (e.g. valvular disease, cardiomyopathy),65, 108 and bradycardia (slow heart rate),112, 113 all of which can lead to QT prolongation. Furthermore, some research has suggested that QT prolongation could serve as a marker of subclinical CVD114, 115
Non-cardiac diseases also confer a risk of QT prolongation. QT prolongation is present in populations with cirrhosis of the liver,116-118 with diabetes,119 and with
found between 20-30% of obese individuals have a prolonged QT,124-126 which suggests that, given the high prevalence of obesity in the U.S. (~35% of adults), obesity may be one of the most common causes of prolonged QT.69, 127 On the opposite end of the weight spectrum, QT prolongation is also more common in cases of anorexia nervosa than in the general population.128-130 Finally, many prescription medications can cause QT prolongation (See Section Drug-Induced QT Prolongation).39
C.2. Congenital Conditions
Several congenital conditions have been associated with a prolonged QT, including the congenital versions of several structural heart diseases including valvular disease and cardiomyopathy, which manifest similarly to their acquired counterparts.110, 111 QT prolongation also has a strong genetic component.24, 25, 33, 131 Congenital LQTS was first described in 1957 by Anton Jervell and Fred Lange-Nielsen.132 There are two predominant forms, Jervell and Lang-Nielsen syndrome and Romano-Ward syndrome, named after the researchers who first described the two subtypes.59 These conditions are caused by mutations in the genes encoding the Na+, K+, and Ca++ ion channel expressed in the heart.69 For greater detail on the genetics of the QT interval, see Section QT Interval Genetics.
C.3. Electrolyte Imbalances
and magnesium, respectively, in the blood.111 Linkages between electrolytes and QT were first documented in case reports in the late twentieth century.136-138 Subsequently, Zeltser and colleagues found that hypokalemia was present in 28% of a population of 249 patients who developed a highly fatal ventricular arrhythmia associated with prolonged QT, torsades de pointes (TdP).139 The prevalence of hypokalemia in Zeltser’s study was significantly higher than that seen in the general U.S. populations according to the NHANES study (3%).140 Larger, population-based studies have shown that the risk of developing prolonged QT increases between 2 and 4-fold in the presence of hypokalemia, although it is unclear if this association is the same in both men and women.106, 122 Additional evidence of the role of electrolyte imbalances in the role of QT prolongation was provided by Hoshino and
colleagues, who showed that treatment with magnesium sulfate was successful in the treatment of TdP associated with prolonged QT in the presence of hypomagnesemia.141 A study by Benoit et al. in the NHANES III population with over 4,000 men and 4,000 women, suggested that hypocalcemia conferred an increased risk of QT prolongation (OR=6.12 [95% CI: 1.03-36.53]).106 However, given the imprecision of the results, further work is needed to confirm this association. One possible avenue to investigate is the effect of electrolyte imbalances on mean QT, rather on QT prolongation. However, few studies to date have examined the association any QT risk factors other than genetics with mean QT. The role of electrolyte imbalances in QT prolongation is unsurprising; these electrolyte imbalances can impair the function of the ion channels which are responsible for the electrical conduction of the heart, especially the Ikr current, which plays a critical role in ventricular repolarization
D. Drug-Induced QT Prolongation
The most common cause of acquired LQTS is the use of prescription drugs.133 In 1964, Seizer and Wray first identified drug-induced Long QT Syndrome in patients using the antiarrhythmic quinidine.143, 144 Drug-induced QT prolongation was the most common cause for medications to withdrawn from the market after approval by the U.S. Food and Drug Administration (FDA) over the past decade.39, 145 FDA guidelines begin regulating medications after an increase in QT duration of just 5 ms, a modest change in the overall length of the QT interval relative to the mean.44 As the use of prescription drugs continues to rise1 and the number of QT prolonging medications identified continues to grow,146, 147 the importance of understanding the mechanisms of diLQTS will remain critical.
D.1. QT-Prolonging Medications
The University of Arizona’s Center for Education and Research on Therapeutics (UAZ-CERT) maintains a database of all medications reported to prolong the QT interval.146 This database currently includes over 170 medications, most of which are still available in the U.S. market. Of these 170 medications, 107 are known to prolong QT, 36 prolong QT under specific conditions, and a further 28 should be avoided by those with congenital LQTS.146 Of medications which prolong QT beyond FDA guidelines, there is a broad range of prolongation. A recent study by Iribarren et al. found that aripirazole, an antipsychotic, prolonged QT by 7.6 ms while amiodarone, an antiarrhythmic , prolonged QT by 25.2 ms.148
Cardiac Medications
Table 6. List of Cardiac Medications by Category That Prolong the QT Interval
Anti-anginal Antiarrhythmic Antihypertensive Diuretics Vasodilators
Bepridil Amiodarone Isradipine Furosemide Anagrelide Ivabradine Disopyramide Moexipril Hydrochlorothiazide Vardenafil Ranolazine Dofetilide Nicardipine Indapamide
Dronedarone Flecainide Ibutilide Procainamide Quinidine Sotalol
List obtained from UAZ-CERT crediblemeds.org on November 17, 2014146
Class 1A antiarrhythmics (disopyramide, procainamide, quinidine) are also known to prolong the QRS interval and JT intervals when examined separately, while class III antiarrhythmics (amiodarone, dofetilide, ibutilide, sotalol) prolong only the JT interval of QT; conversely, class 1C antiarrhythmics (flecainide, trycyclic anti-depressants) are known to prolong QRS but not JT.69 In addition to antiarrhythmics, anti-anginals, antihypertensives, diuretics, and vasodilators are also known to prolong QT. Of particular interest,
hydrochlorothiazide is included in the UAZ-CERT database as a conditional QT prolonging agent but is still a commonly used anti-hypertensive.
Additionally, Iribarren and colleagues found that indapamide, a thiazide-like diuretic, prolonged QT by an average of 9.4 ms and by more than 20 ms in 43% of participants.148 For greater detail on hydrochlorothiazide and other thiazide and thiazide-like diuretics, the subject of this proposal, see Section Thiazide Diuretics.
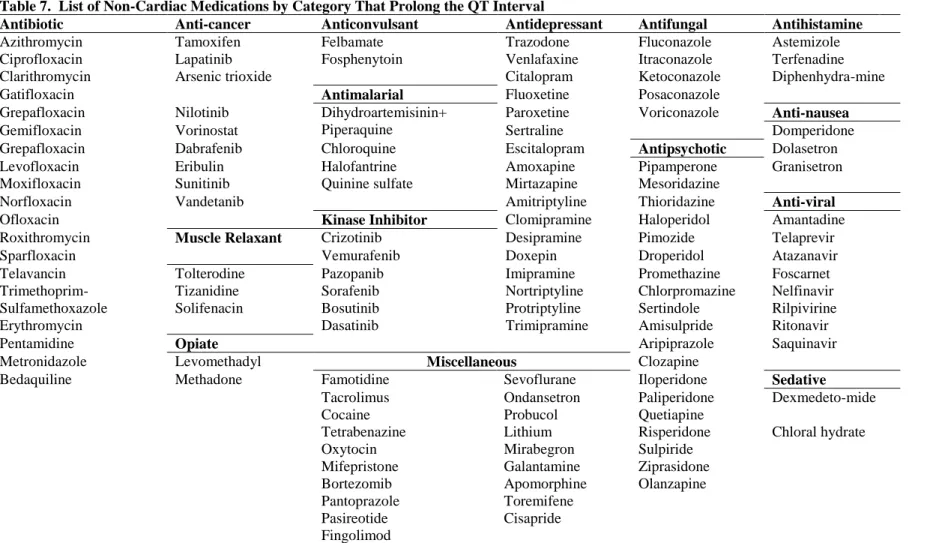
Non-Cardiac Medications
25
Table 7. List of Non-Cardiac Medications by Category That Prolong the QT Interval
Antibiotic Anti-cancer Anticonvulsant Antidepressant Antifungal Antihistamine
Azithromycin Tamoxifen Felbamate Trazodone Fluconazole Astemizole Ciprofloxacin Lapatinib Fosphenytoin Venlafaxine Itraconazole Terfenadine Clarithromycin Arsenic trioxide Citalopram Ketoconazole Diphenhydra-mine
Gatifloxacin Antimalarial Fluoxetine Posaconazole
Grepafloxacin Nilotinib Dihydroartemisinin+ Piperaquine
Paroxetine Voriconazole Anti-nausea
Gemifloxacin Vorinostat Sertraline Domperidone
Grepafloxacin Dabrafenib Chloroquine Escitalopram Antipsychotic Dolasetron Levofloxacin Eribulin Halofantrine Amoxapine Pipamperone Granisetron Moxifloxacin Sunitinib Quinine sulfate Mirtazapine Mesoridazine
Norfloxacin Vandetanib Amitriptyline Thioridazine Anti-viral
Ofloxacin Kinase Inhibitor Clomipramine Haloperidol Amantadine
Roxithromycin Muscle Relaxant Crizotinib Desipramine Pimozide Telaprevir
Sparfloxacin Vemurafenib Doxepin Droperidol Atazanavir
Telavancin Tolterodine Pazopanib Imipramine Promethazine Foscarnet
Trimethoprim-Sulfamethoxazole
Tizanidine Sorafenib Nortriptyline Chlorpromazine Nelfinavir Solifenacin Bosutinib Protriptyline Sertindole Rilpivirine
Erythromycin Dasatinib Trimipramine Amisulpride Ritonavir
Pentamidine Opiate Aripiprazole Saquinavir
Metronidazole Levomethadyl Miscellaneous Clozapine
Bedaquiline Methadone Famotidine Sevoflurane Iloperidone Sedative
Tacrolimus Ondansetron Paliperidone Dexmedeto-mide
Cocaine Probucol Quetiapine
Tetrabenazine Lithium Risperidone Chloral hydrate Oxytocin Mirabegron Sulpiride
Mifepristone Galantamine Ziprasidone Bortezomib Apomorphine Olanzapine Pantoprazole Toremifene
Pasireotide Cisapride Fingolimod
antibiotics and antivirals, cancer treatments, antidepressants and antipsychotics, sedatives, and pain medications, in addition to numerous others. However, identifying non-cardiac medications is particularly difficult because the risk of QT prolongation is rarely identified in clinical trials but is rather identified after the medications have been approved, marketed to the public, and commonly used, sometimes after many years.149 For example, in a large, population based study based in the Netherlands, van Noord et al. studied antipsychotics and anti-depressants, two classes of medication which are commonly found to prolong QT. In the study, the antipsychotic thioridazine was found to prolong QT 28.3 ms (95% C.I.: 5.9-50.8) compared with nonusers.150 A further six medications which significantly prolonged QT were found to increase QT by more than the minimum FDA guidelines (5 ms): lithium (10.1 ms), olanzapine (22.9 ms), amitriptyline (5.1 ms), maprotiline (9.6 ms), imipralnine (12.8 ms), and nortriptyline (23.3 ms).150 Furthermore, when Iribarren et al. examined 90 medications that had been reported to prolong QT in a population-based cohort (N=59,531), they found 78 (87%) significantly prolonged QT and of these 78 medications, 63 were non-cardiac medications.148
D.2. Prevalence of QT-Prolonging Medication Use
Despite the rising awareness in both clinical and research settings, the use of QT prolonging drugs continues to be a concern. In a study of 2 million members of health
maintenance organizations (HMOs) over a two and a half year period, over 180,000 members filled a prescription for a high-risk QT prolonging medication.151 Among patients who were admitted to a hospital in Switzerland over a 3 month period who had prolonged QT at admission, defined as QTc ≥ 450 ms in men and 460 ms in women, half were subsequently
cardiac care unit, a third of patients who had prolonged QT at admission were later administered a QT prolonging medication and 42% of those who had a QTc ≥ 500 ms
(extreme prolongation) were administered a QT prolonging agent.152 These findings indicate that diLQTS remains a prominent concern and more work is needed to prevent diLQTS, either through the development of new medications that do not prolong QT or through the identification of those most at risk for QT prolongation in order to better prescribe QT prolonging medications and avoid potential adverse reactions.
D.3. Clinical Considerations
The continued use of QT prolonging medications despite the risk of severe negative outcomes has been widely acknowledged by the medical community.151, 152 Physicians must weigh the risks and benefits of the use of such medications. In cases where effective
hours of the onset of drug therapy, while 42% developed TdP between 3 and 30 days after the onset of therapy and 40% developed TdP more than a month after the onset of therapy.139 It is critical that both researchers and clinicians continue to work to identify those at risk of QT prolongation and the mechanisms of this risk to better prescribe, monitor, and prevent diLQTS.
D.4. Mechanisms
Drug-induced LQTS is caused when prescription medications interfere with the normal action of the ion channels of the cardiac conduction system. The ion channel most commonly disrupted is the rapid delayed rectifier K+ channel, or the IKr. This channel,
encoded by the KCNH2 gene, also known as the human ether-a-go-go related gene (HERG). The HERG channel is composed of six transmembrane subunits and it is on the sixth subunit that the two most important drug binding sites are located: Tyr652 and Phe656 (Figure 6).143
Adapted from Ponte 2010144
The fourth membrane’s planning unit (S4) contains positively charged residues and functions as the voltage sensor.
The residues between S5 and S6 form the ion selective pore. Tyr652 (Tyr) and Phe656 (Phe), marked in the diagram, are the two most important drug binding sites
When drugs bind to the tyrosine located at the 652nd amino acid or phenylalanine at the 656th amino acid, they can reorient these amino acids, subsequently trapping the drug in the central cavity of the channel and preventing the conduction of K+ ions.143, 153 The blockage of the IKr
current primarily affects the Purkinje fibers and the mid-myocardium (M cells).143 The M cells are particularly responsive to drug exposure.154 In addition to blockage of the HERG channel, M cells can prolong QT through pharmacologic interference of the slow delayed rectifier potassium channel, the sodium channels, and the sodium-calcium exchangers, which while less common than the disruption of the IKr, make the M cells a primary source in
prolongation of Phase 2 and 3 of the action potential of the heart.154 E. Categorical Versus Continuous Measures of QT Prolongation
QT prolongation does not have a single, standard threshold. When evaluating QT prolongation suing a threshold, a common cut-point is 450 ms in men and 460 ms in women,20, 155-158 a threshold which, according to the NHANES population, only 2% of men and 3% of women exceed.159 In clinical settings, the risk of adverse outcomes is believed to increase substantially at 500 ms.39, 111 Despite these commonly-used cutpoints, there is no clear threshold at which risks due to QT prolongation increase, and many studies of QT use alternate cut-points or study QT as a continuous outcome. Another alternative is to study QT as a continuous variable and report results for a standard deviation of the population
distribution.160, 161 However, reporting results for a standard deviation prevents
continuous outcome in order to identify risk factors which have smaller although still important effects on QT.
F. Potential Clinical Outcomes of Prolonged QT
QT prolongation has been extensively studied. QT prolongation was first described in association with sudden death in 1957 by Anton Jervell and Fred Lange-Nielsen, for whom the subtype of familial long QT syndrome (LQTS) which they described is named.132 Torsades de pointes (TdP), the ventricular tachyarrhythmia commonly associated with prolonged QT, was also first described in the mid-20th century (1966) by the French scientist Dessertenne.162, 163 Since then, prolonged QT has been identified as a risk factor for not just TdP but also numerous other clinical conditions, including coronary heart disease (CHD),20 congestive heart failure (CHF),164 stroke,165 and both cardiovascular and all-cause
mortality.23 F.1. Arrhythmias
fibrillation and cardiac arrest, often leading to SCD.19, 163 SCD peaks both in elderly age and in infancy, the latter peak associated with sudden infant death syndrome (SIDS).166, 167
Very little is known about the underlying epidemiology of TdP. Drug-induced TdP is the most closely monitored form of TdP and is reported as an adverse drug reaction (ADR) to the World Health Organization’s (WHO) Drug Monitoring Centre. For drug-induced TdP, there were 750 total cases reported from 1990 to 1999,149 a number likely to be an extreme underrepresentation, given the high level of underreporting found for ADRs (as high as 95%).170 Further complicating the measurement of TdP prevalence are cases of syncope and SCD. In both cases, patients usually present without ECG, making it unclear if TdP was the underlying cause.171
It is also worth noting that both a widened QRS and a severely prolonged QTc were
independent predictors of another arrhythmia, atrial fibrillation.172 In a study of 42,751 participants, 1,050 of whom developed atrial fibrillation during the study period, QRS > 110ms was associated with a hazard ratio (HR) of 1.9 (95% CI: 1.7-2.2) and QTc > 450 ms
was associated with HR = 1.7 (95% CI: 1.5-2.0) of developing atrial fibrillation.172 Atrial fibrillation is the most common arrhythmia in the U.S., affecting an estimated 2.2 million
Adapted from Yap and Camm 2003153
people.173 It is highly associated with both stroke and mortality, accounting for
approximately 75,000 strokes per year174 and a nearly 2-fold increase in the risk of death.175 The association between QT prolongation and both TdP and atrial fibrillation, one a highly fatal arrhythmia, the other a highly prevalent arrhythmia, underscores the importance of studying QT prolongation and its risk factors.
F.2. Coronary Heart Disease
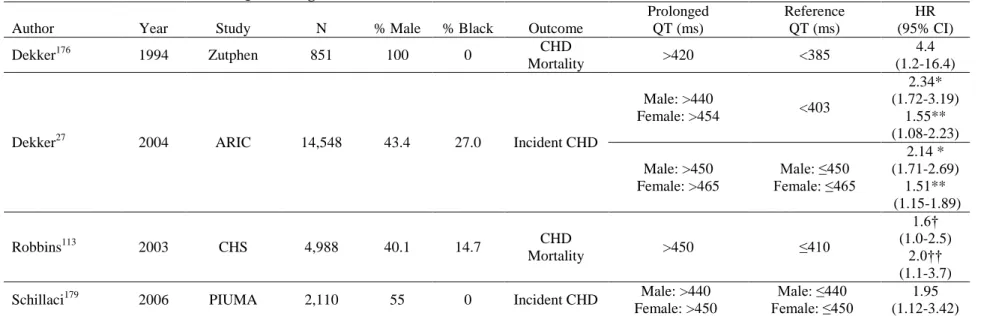
Coronary heart disease (CHD) is the clinical manifestation of the blockage of the arteries supplying blood to the myocardium, most often through atherosclerosis of the coronary arteries. As of 2010, CHD affected an estimated 15.4 million Americans over the age of 20 and makes up more than half of all CVD events in men and women under age 75.36 QTc prolongation is an established risk factor for CHD and CHD mortality.20, 158, 176-180
Multiple studies have found that QTc prolongation, corrected using Bazett’s formula, is
associated with CHD in both black and white men and women (Table 8). Broadly, a prolonged QT has been found to have between a 1.5 and a 2-fold increase in the risk of developing incident CHD or CHD mortality. Using data from the Atherosclerosis Risk in Communities (ARIC) study, Dekker and colleagues found that prolonged QTc imparted a
greater risk of CHD in blacks than in whites when comparing the top 10% of the QTc
distribution to the rest of the population (HR = 2.07 [95% CI: 1.24-3.46] and 1.39 [95%CI: 1.00-1.92], respectively).20 Maebuchi et al. also conducted a study of prolonged QT and CHD in Japanese adults and reported that prolonged QTc, corrected using Bazett’s formula,
33
Table 8. Review of Four Studies of QT Prolongation and CHD Risk in Black and White Men and Women
Author Year Study N % Male % Black Outcome
Prolonged QT (ms) Reference QT (ms) HR (95% CI)
Dekker176 1994 Zutphen 851 100 0 CHD
Mortality >420 <385
4.4 (1.2-16.4)
Dekker27 2004 ARIC 14,548 43.4 27.0 Incident CHD
Male: >440
Female: >454 <403
2.34* (1.72-3.19) 1.55** (1.08-2.23) Male: >450 Female: >465 Male: ≤450 Female: ≤465 2.14 * (1.71-2.69) 1.51** (1.15-1.89)
Robbins113 2003 CHS 4,988 40.1 14.7 CHD
Mortality >450 ≤410
1.6† (1.0-2.5)
2.0†† (1.1-3.7)
Schillaci179 2006 PIUMA 2,110 55 0 Incident CHD Male: >440 Female: >450
Male: ≤440 Female: ≤450
1.95 (1.12-3.42) *Adjusted for age, gender, and race
**Adjusted for age, gender, race, and CVD risk factors (heart rate, hypertension, systolic blood pressure, ECG abnormalities, body mass index, waist-hip ratio, cigarette smoking status, cigarette years, total cholesterol, HDL cholesterol, triglycerides, cardiac medications, diabetes, intima-media thickness †Hazard ratio among participants without CHD at baseline
††Hazard ratio among participants with CHD at baseline