PUBLIC OPINION AND DEATH PENALTY POLICY UNDER DIRECT DEMOCRACY
INSTITUTIONS: A DYNAMIC ANALYSIS OF THE AMERICAN STATES
Christian Caron
A thesis submitted to the faculty of the University of North Carolina at Chapel Hill in partial
fulfillment of the requirements for the degree of Master of Arts in the Department of Political
Science, Concentration in American Politics.
Chapel Hill
2018
Approved by:
Frank R. Baumgartner
Virginia Gray
ABSTRACT
CHRISTIAN CARON: Public Opinion and Death Penalty Policy Under Direct Democracy Institutions: A Dynamic Analysis of the American States
(Under the direction of Frank R. Baumgartner.)
This paper assesses the conditional effect of direct democracy on death penalty policy in the
American states. I argue that these institutions have played an integral role in maintaining
capital punishment in the United States by enhancing responsiveness to public preferences,
which are generally supportive of the death penalty. The findings provide some support for
my expectations, showing that direct democracy amplifies the effect of public opinion on
policy, even if it does not necessarily increase the probability that policy will be congruent
with majority preferences. This paper also overcomes a methodological limitation of prior
studies on this subject, which employ a cross-sectional research design. Because public
opinion—especially on the death penalty—and policy evolve over time, such a design can
produce misleading results due to its static nature. Using the longitudinal research design
promoted by Lewis and Jacobsmeier (2017), in combination with yearly state-level death
penalty opinion estimates computed by Gelman and Shirley (2015), I am able to account
TABLE OF CONTENTS
LIST OF TABLES . . . v
LIST OF FIGURES . . . vi
INTRODUCTION . . . 1
Public Opinion, Direct Democracy, and Policy Representation . . . 3
Theory and Hypotheses . . . 5
The Utility of Dynamic Analyses . . . 9
Data and Methods . . . 10
Results . . . 17
Conclusion . . . 25
APPENDIX . . . 29
LIST OF TABLES
Table
1 Summary Statistics for Dichotomous Variables . . . 11
2 Summary Statistics for Continuous Variables . . . 13
3 Event History Models of Death Penalty Reinstatement, 1972-2006 . . . 19
4 Event History Models of Death Penalty Reinstatement with Interaction Terms, 1972-2006 . . . 20
5 Logistic Regression Models of Policy Responsiveness, 1982-2006 . . . 22
6 Logistic Regression Models of Policy Responsiveness with Interaction Terms, 1982-2006 . . . 23
7 Logistic Regression Models of Policy Congruence, 1982-2006 . . . 25
8 State Reinstatement of the Death Penalty AfterFurman v. Georgia. . . 29
9 Event History Models of Death Penalty Reinstatement, 1972-2006 (All States) . . . 30
10 Event History Models of Death Penalty Reinstatement with Interaction Terms, 1972-2006 (All States) . . . 30
11 Logistic Regression Models of Policy Responsiveness without Southern States, 1982-2006 . . . 31
12 Logistic Regression Models of Policy Responsiveness with Interaction Terms and without Southern States, 1982-2006 . . . 31
13 Logistic Regression Models of Policy Responsiveness with Yearly Fixed Effects, 1982-2006 . . . 32
LIST OF FIGURES
Figure
1 Death Penalty Support by State, 1972-2006. . . 8
2 Marginal Effects of Public Opinion on Risk of Death Penalty Reinstate-ment by Direct Democracy, 1972-2006 (Model 3). . . 20
3 Marginal Effects of Public Opinion on Risk of Death Penalty Reinstate-ment by Direct Democracy Impact, 1972-2006 (Model 4). . . 21
4 Marginal Effects of Public Opinion on Probability of Having the Death Penalty by Direct Democracy, 1982-2006 (Model 7). . . 23
5 Marginal Effects of Public Opinion on Probability of Having the Death Penalty by Direct Democracy Impact, 1982-2006 (Model 8). . . 24
6 Survival Function by Direct Democracy (Model 1) . . . 33
7 Survival Function by Direct Democracy Impact (Model 2) . . . 33
8 Probability of Having the Death Penalty by Direct Democracy (Model 5) . 34
INTRODUCTION
In May 2015, Nebraska did what no conservative state had done in over 40 years. In
defiance of the state’s Republican governor, Pete Ricketts, its unicameral, nonpartisan
leg-islature passed a bill abolishing capital punishment. For a time at least, it seemed that
Nebraska had become the sixth state since 2007 to legislatively abolish the death penalty.
Central to the argument of the bill’s proponents was the inordinate cost of maintaining the
capital punishment system, combined with the fact that no execution had been carried out
in the state since 1997. Conservative legislators, citing their committment to reducing
gov-ernment waste and inefficiency, apparently found these points persuasive.
It would not be long, however, before an organized effort to undo the repeal bill was
un-derway. Later that summer, an interest group called Nebraskans for the Death Penalty, with
the financial backing of the Ricketts family, launched a popular referendum campaign. The
petition secured enough signatures to not only qualify for the ballot in the 2016 elections
but also to suspend the enactment of the bill. To the dismay of death penalty opponents,
Ne-braska voters overwhelmingly opted to reinstate capital punishment on Election Day 2016,
marking the fifth time a state had done so since 1976, the year considered to represent the
beginning of the modern death penalty system.1 This prolonged, and ultimately
unsuc-cessful, abolition attempt demonstrates the role of direct democracy in maintaining capital
punishment in the U.S.
Despite Nebraska’s failure to end capital punishment, long-term trends suggest the death
penalty is in decline in the United States as a whole, especially when measured in terms
of usage. Over the past two decades, both death sentences and executions have declined
precipitously as attention to wrongful convictions has risen (Baumgartner, De Boef and
Boydstun 2008). In many states, executions have become so rare that the death penalty is
effectively a more expensive form of life imprisonment without the possibility of parole
(LWOP) (Baumgartner, Davidson, Johnson, Krishnamurthy and Wilson 2018). Indeed,
those condemned to death usually see their sentences reduced to LWOP. But even among
the inmates who never leave death row, the lengthy appeals process, which sometimes spans
over 20 years, and the frequency of stays of execution mean there is a strong possibility that
they will never be executed. Further, as of April 2018, four states—Pennsylvania, Oregon,
Washington, and Colorado—have gubernatorial-imposed moratoria on executions. In short,
with the exception of a small number of states—most notably Texas—the death penalty is
virtually extinct in practice.
Yet, the death penalty remains a legal punishment in 31 states. The question
motivat-ing this paper, therefore, is why a criminal justice policy that is significantly more costly
than the alternative while usually resulting in the same penalty is still on the books in the
majority of states. It would be a mistake to discount the role of public opinion (Erikson,
Wright and McIver 1993), which remains solidly behind the death penalty, at least in the
abstract, despite recent increases in anti-death penalty sentiment (Baumgartner, De Boef
and Boydstun 2008; Baumgartner et al. 2018; Enns 2016). As illustrated by the case of
Nebraska, though, a state’s institutional arrangements can affect policy by conditioning the
effect of public opinion. I argue that direct democracy institutions—principally the
bal-lot initiative and popular referendum—provide an additional layer of protection to death
penalty statutes by directly and indirectly enhancing government’s responsiveness to public
preferences. This paper also addresses the related question of whether direct democracy
increases the likelihood that policy will be congruent with majority preferences. While the
results provide some evidence that direct democracy fosters policy responsiveness, they fail
to support my expectations regarding policy congruence.
After reviewing the relevant literature, I discuss the theoretical reasons underlying the
connection between direct democracy and policy representation. From there, I explain the
advantages a longitudinal design such as the one used in this study provides in assessing
policy representation over the more conventional cross-sectional approach. I then test my
models analyze the role direct democracy played in encouraging states to reinstate capital
punishment after Furman v. Georgia(1972), the landmark ruling in which the Supreme
Court invalidated all existing death penalty statutes due to their “abritrary and capricious”
nature. Such an analysis is absent from most scholarly accounts of this major intervention
(e.g., Mooney and Lee 2000; Jacobs and Carmichael 2002; but see Boehmke 2005). These
models provide an initial test of the hypothesized relationship between direct democracy
and policy responsiveness. Next, I make use of cross-sectional time series data covering
over two decades of the post-Furmandeath penalty era, which offer an alternative method
for assessing policy responsiveness. This dataset also allows me to examine whether direct
democracy improves policy congruence. The paper concludes with a discussion of the
implications of the findings for the future of death penalty policy.
Public Opinion, Direct Democracy, and Policy Representation
Scholars of representation understand policy responsiveness and policy congruence to
be related yet distinct concepts (e.g., Campbell 1981; Eulau and Karps 1977; Kuklinski
1979). Responsiveness is defined as the extent to which “policy reacts to public opinion”
(Lewis and Jacobsmeier 2017, 443). In order for a state to be considered responsive, there
must only exist a positive correlation between opinion and policy. Congruence, on the other
hand, measures whether “policy actually matches majority opinion” (Lax and Phillips 2012,
148). It is more difficult for states to achieve congruence than responsiveness. As such, a
state can be classified as responsive even if it fails to exhibit congruence. After all, the
fact that policy is inconsistent with majority opinion some or even much of the time does
not mean that public opinion does not matter at all (Lax and Phillips 2009a). This fact is
made evident by Lax and Phillips (2012), who generate policy-specific, state-level opinion
estimates across a wide range of policies and find that although states are highly responsive
to public opinion, policy is incongruent with majority preferences about half the time (see
also Erikson, Wright and McIver 1993).
Contrary to the findings of early studies (e.g., Treadway 1985), scholars now generally
Gray, Lowery, Fellowes and McAtee 2004; Caughey and Warshaw 2018). But public
opin-ion is not the only determinant of public policy. Indeed, policy variatopin-ion across the states is
also a function of their institutional differences, including the presence or absence of direct
democracy (Lupia, Krupnikov, Levine, Piston and Hagen-Jamar 2010). First championed
by Progressive and Populist reformers (Sullivan 1893), direct democracy initially had the
effect of moving state policy leftward, at least in the fiscal realm (Matsusaka 2000). More
recently, though, it has aided conservatives in realizing much of their policy agenda. Direct
democracy states, typically defined as those with the initiative or popular referendum, have
been predisposed to enact tax limitation measures (Matsusaka 1995); anti-minority policies
(Lewis 2013; Lewis and Jacobsmeier 2017), including same-sex marriage bans,
English-only laws, and affirmative actions bans; and restrictive abortion laws (Gerber 1996;
Arce-neaux 2002). Most notably for my study, these institutions also increase the probability that
a state will have the death penalty (Gerber 1999). The somewhat contradictory findings
from this literature suggest that direct democracy does not inherently bias policy in a
lib-eral or conservative direction; rather, by giving citizens agenda-setting power, it increases
the influence of median voter preferences, which vary across issues and evolve over time.
In other words, the effect of direct democracy on policy is conditional on public opinion
(Lupia and Matsusaka 2004).
Some work, however, casts doubt on the existence of a relationship between direct
democracy and policy representation. Studies examining a wide array of policies
typi-cally find little or no connection between the two. Lascher, Hagen, and Rochlin (1996)
examine whether state policy outcomes, operationalized in terms of expenditures, are more
consistent with public opinion in initiative states than in non-initiative states. They find
that this is the case for only two of the eight policies under examination. Similarly, Lax
and Phillips (2012), using the state-policy as the unit of analysis, find no relationship
be-tween direct democracy and responsiveness or congruence on 39 policies encompassing
eight issue areas. Moreover, direct democracy does not appear to enhance government’s
responsiveness to a citizenry’s general ideological orientation, implying that any impact it
mass liberalism on both the economic and social dimensions and find that direct democracy
does not condition the effect of opinion on the overall liberalism of state policy in either
domain (see also Burden 2005).
Studies reporting a responsiveness-enhancing effect of direct democracy, by contrast,
tend to deal exclusively with highly salient and nontechnical issues such as those
men-tioned previously. On such “easy” issues, instead of relying on interest groups and other
intermediaries to communicate their views to lawmakers, voters themselves are capable of
sending clear signals about their preferences (Carmines and Stimson 1980; Mooney and
Lee 2000). The theory that direct democracy enhances policy representation, which I will
explicate in the next section, depends upon voters being able to make their views known to
elected officials or, if necessary, at the ballot box— assumptions that are clearly truer for
morality issues than for arcane issues that receive little media attention.
Theory and Hypotheses
Due to the death penalty’s status as a salient morality issue, state governments should
be especially attuned to public attitudes toward it (Mooney and Lee 2000). As a
conse-quence, even non-direct democracy states should be highly responsive to death penalty
opinion. There is reason to believe, however, that this responsiveness will be amplified in
direct democracy states. The institutions principally responsible for this effect are the
initia-tive and popular referendum, which enable voters to circumvent the representainitia-tive system
in passing and repealing laws, respectively. Unlike the legislative referendum, both types
of measures originate from the citizenry rather than the legislature. As envisioned by the
Progressives, by affording citizens direct control over policymaking, direct democracy
en-hances policy representation; if lawmakers refuse to pass a popular policy or, worse, enact
a law despite public opposition, voters have recourse to change policy without the
partici-pation of the legislature.
Of course, in order for direct democracy to serve its intended purpose, voters must
question whether they possess this ability. Early public opinion research seemed to
in-dicate that citizens generally pay little attention to politics, particularly at the state level
(Campbell, Converse, Miller and Stokes 1960; Converse 1964; Treadway 1985). But it
has since become evident that interest groups and political elites serve to compensate for
voters’ low levels of information in the direct democracy realm, educating them about the
issues on the ballot through paid media and other campaign activity (Tolbert, McNeal and
Smith 2003; Smith and Tolbert 2009; Boehmke 2002, 2005). Further, voters should require
less education about highly salient, “gut-level” issues than other, more complex issues (e.g.,
Nicholson 2003) This means that, in addition to being more likely to have a prior opinion
about the death penalty, they should be more aware of the current state of policy as well
as when an initiative or referendum campaign concerning it is ongoing. Voters also have
more motivation to turn out when issues they deem to be fundamental are at stake (Tolbert,
Grummel and Smith 2001). For these reasons, the death penalty lends itself to initiative and
referendum campaigns and, indeed, is regularly a subject of them.
More important for my purposes, direct democracy can influence policy through
indi-rectmeans. In other words, voters do not need to actually utilize these institutions in order
for them to alter public policy. Direct democracy constrains the behavior of legislators by
encouraging them to pass legislation that approximates median voter preferences (Gerber
1996, 1999). Consider a scenario in which median voter preferences are distant from the
status quo policy. Under these circumstances, if the legislature’s preferences are closer to
the status quo than those of the median voter, lawmakers may not feel compelled to pass a
new policy. If, however, there exists a credible threat that voters will pass an initiative in
line with their preferences, the legislature may pass a more moderate version of the policy
in the hope of preempting extreme change. Because policy change can also come about by
repealing existing legislation, similar dynamics should be at play under the popular
referen-dum. Notably, an explicit ballot proposal need not exist in order for lawmakers to perceive
a threat to be credible; the public would likely notice and care if the legislature were to
sub-vert majority will on an issue as prominent and fundamental as the death penalty, making
campaign.
Direct democracy can operate as a catalyst for policy change even when
lawmak-ers and votlawmak-ers have similar preferences. In their attempt to secure reelection, lawmaklawmak-ers
routinely tout their role in passing popular policies (Mayhew 1974). Collectively, they
ad-vertise legislative accomplishments that they feel would help their party win or maintain
control of government (Downs 1957; Kang and Powell 2010). The ability of both
indi-vidual politicians and parties to engage in “credit-claiming,” however, is compromised if
such policies are passed through direct democracy instead of the regular legislative
pro-cess (Lewis, Wood and Jacobsmeier 2014). It is in their interest, then, to act before voters
take matters into their own hands. As a result, direct democracy should hasten the
legisla-ture’s response to changes in opinion, provided that the issue is sufficiently salient to voters
(Lewis and Jacobsmeier 2017; Arceneaux 2002).
Finally, by offering an alternative means of affecting policy, direct democracy
fos-ters the formation of interest groups, particularly those with a citizen orientation (Boehmke
2002, 2005). Citizen groups are more likely than economic groups to benefit from
di-rect democracy campaigns, which are better suited for policies with broad public support
than policies that appeal to only a narrow constituency (Gerber 1999). By diversifying and
democratizing the interest group system, which tends to be dominated by businesss
inter-ests (Schattschneider 1960), direct democracy should assist citizens in communicating their
preferences and applying pressure—through lobbying and campaign spending—to elected
officials (Hall and Wayman 1990; Langbein 1986).
As outlined above, there are multiple avenues through which direct democracy can
enhance policy representation. These theoretical linkages lead me to the following
hy-potheses, the first of which deals with responsiveness and therefore describes an interactive
relationship:
H1: The effect of public opinion on death penalty policy is greater in direct democracy
states than in non-direct democracy states.
H2: The probability that death penalty policy will be congruent with majority opinion
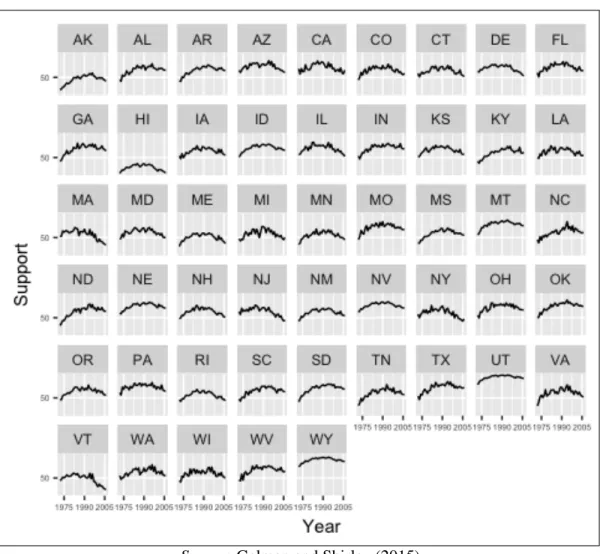
Fig. 1:Death Penalty Support by State, 1972-2006.
Source: Gelman and Shirley (2015)
In addition, when public opinion leans strongly in one direction, it is reasonable to
expect direct democracy to bias policy in that direction. I anticipate that these institutions
have had this effect in the case of the death penalty, considering that public opinion was
unequivocally pro-death penalty in most states during the period under examination. This
is made evident in Figure 1, which plots the level of public support for the death penalty
for all states from 1972 to 2006. In about 89 percent of state-years, it commanded majority
support. The next hypotheses follow from my expectations regarding the effects of direct
democracy on policy representation:
H3: Following Furman, direct democracy states were faster to reinstate the death
H4: The probability of a state having the death penalty is greater in direct democracy
states than in non-direct democracy states.
The Utility of Dynamic Analyses
Virtually every study asssessing the effects of direct democracy on policy
representa-tion employs a cross-secrepresenta-tional research design. The dominance of this approach is largely
due to the difficulty state politics scholars historically faced in obtaining dynamic
esti-mates of policy-specific opinion. Erikson, Wright, and McIver’s (1993) seminal work
rep-resents a significant step forward in developing subnational opinion estimates, introducing
the method of disaggregation, which allows researchers to generate state-level opinion
esti-mates by pooling large numbers of national surveys. But a major drawback to this approach
is that the researcher must typically utilize surveys spanning multiple years in order to
obtain sufficient within-state samples, thereby making it unsuitable for generating
time-varying estimates. This problem has since been overcome by multilevel regression and
poststratification (MRP), a technique developed by Park, Gelman, and Bafumi (2006) and
popularized by Lax and Phillips (2009a; 2009b; 2012). This method involves first
model-ing individual-level opinion as a function of demographics and state-level factors and then
weighting the predictions by population data (Lax and Phillips 2009b). In contrast to
dis-aggregation, MRP has been demonstrated to produce reliable estimates of opinion using
national surveys with as few as 1,400 respondents. Hence, assuming the researcher has
access to the necessary individual-level survey and population data, it is possible to
pro-duce dynamic estimates under this approach. Such estimates were unavailable to those who
previously examined the relationship between direct democracy and capital punishment,
suggesting the topic is worth revisiting (Gerber 1999; Boehmke 2005).
As Lewis and Jacobsmeier (2017) point out, when it comes to the study of policy
representation, longitudinal designs are preferable to cross-sectional ones. By allowing
for temporal variation in policy, longitudinal studies account for the possibility that policy
may be reflective of public opinion in some years but not others, thereby providing a more
analyses, by contrast, puts them at risk of over- or underestimating a state’s level of
con-gruence. Another advantage of longitudinal designs, particularly those employing event
history analysis, is their ability to measure the speed at which states react to opinion. After
all, there could be long gaps between otherwise similar states adopting a policy, as was
the case following Furman; not until 1994, for example, did Kansas reinstate the death
penalty—a full two decades after most other states had done so, even though the
major-ity of Kansans supported capital punishment during the entire intervening period (Gelman
and Shirley 2015). A cross-sectional study would mistakenly assess two states as equally
responsiveness just because they both had the policy of interest at the time of the study.
Due to their ability to utilize time-varying measures of opinion, longitudinal analyses
can properly account for the highly dynamic nature of state-level public opinion on the death
penalty (Gelman and Shirley 2015; Pacheco 2014). Thus, even in the absence of policy
change, longitudinal designs can provide greater insight into policy representation than
cross-sectional ones. Indeed, it can be informative if a state failed to adopt a policy despite
growing public support for it over time or, conversely, defied popular will in refusing to end
an increasingly unpopular policy. Longitudinal analyses also provide a more comprehensive
picture of policy congruence, which can result from not just policy coming into alignment
with opinion but the reverse as well (Lewis and Jacobsmeier 2017). A cross-sectional study,
on the other hand, cannot appropriately handle states that transition from congruence to
incongruence, or vice versa, as a result of changes in opinion.
Data and Methods
I first evaluate the impact of direct democracy on policy responsiveness with event
his-tory analysis (EHA). More specifically, I estimate Cox Proportional Hazards models, with
the exact partial likelihood method for handling ties (Box-Steffensmeier and Jones 2004).
In EHA, the goal is to explain the hazard rate, the probability that a subject will experience
an event at a given point in time. Theobserveddependent variable, however, is a dummy
variable indicating the occurrence of an event— in this case, state legislative reenactment
Table 1:Summary Statistics for Dichotomous Variables
Frequency of observations % of observations Event History Models
Reinstatement 38 14
No reinstatement 238 86
Direct democracy 58 21
No direct democracy 218 79
Prior abolition 144 52
No prior abolition 132 48
Divided government 145 53
Unified government 131 47
South 30 11
Non-South 146 89
Logistic Regression Models
Death penalty 899 73
No death penalty 326 27
Direct democracy 564 46
No direct democracy 661 54
South 275 22
Non-South 950 78
Congruent policy 966 79
Incongruent policy 259 21
Elected court 1050 86
Appointed court 175 14
Unlike conventional logistic regression, EHA properly accounts for right-censoring, which
occurs when a subject does not experience an event before the end of the study period. Of
the 41 states that comprised the initial risk set, three did not experience the event. Table 8,
which is in the appendix, lists the years that states reinstated their statutes. Notably, only
two reinstatements (California in 1973 and Oregon in 1978) occurred as the direct result of
a citizen initiative, suggesting that if direct democracy accelerated reinstatement, it largely
did so through indirect means. Table 1 presents descriptive statistics for all the dichotomous
variables that appear in the models.
I include in the initial risk set every state that had the death penalty for conventional
murder cases in 1960. I chose to use this date as the cut-off because it excludes states that
were historically abolitionist and thus not “at risk” of passing a revised death penalty statute
in response toFurman.2 The risk set does, however, include the states that significantly
restricted or outright abolished the death penalty during the brief abolitionist wave of the
1960s, since some of them later restored it. I include a dummy variable denoting the five
states—Iowa, New Mexico, New York, Vermont, and West Virginia—that either abolished
the death penalty or significantly restricted its scope in the years leading up toFurman.
I further test Hypothesis 1 with cross-sectional time series data spanning 1982 to 2006.
This dataset contains 49 states, and the dependent variable is a dichotomous indicator of
whether the state had the death penalty during the year.3 Thus, even though both these and
the event history models assess responsiveness, the former estimate the odds of having the
death penalty, whereas the latter estimate the time to reinstatement. The summary statistics
for the dependent variable in Table 1 show that, from 1982 to 2006, capital punishment was
on the books in most state-years. While little policy change occurred during this period,
there was, as previously mentioned, substantial opinion change. Thus, there are still benefits
to be had from utilizing longitudinal data. I estimate logistic regressions with state random
effects to adjust for the correlation of errors within states.
In both the Cox and logistic regression models, I employ two measures of direct
democracy. The first is a binary indicator of whether the state has the initiative or
pop-ular referendum. Eighteen states meet these criteria in the event history dataset, while 23
do so in the cross-sectional time series dataset.4 Besides having intuitive appeal, this
mea-sure is also the one that appears most frequently in the literature (e.g., Gerber 1996, 1999;
Lax and Phillips 2012). A limitation of measuring direct democracy with a dummy
vari-able, though, is that this measure does not account for the varying restrictiveness of these
institutions from state to state. Hence, in some of the models, I substitute Lewis’ (2013)
measure of “direct democracy impact.” I devise this measure using principal components
analysis, and it is based off the number of inititiaves and popular referenda that reached
the ballot during the study period, as well as Donovan and Bowler’s (2004) Qualification
appendix.
3I exclude Nebraska because its legislature is nonpartisan.
Table 2:Summary Statistics for Continuous Variables
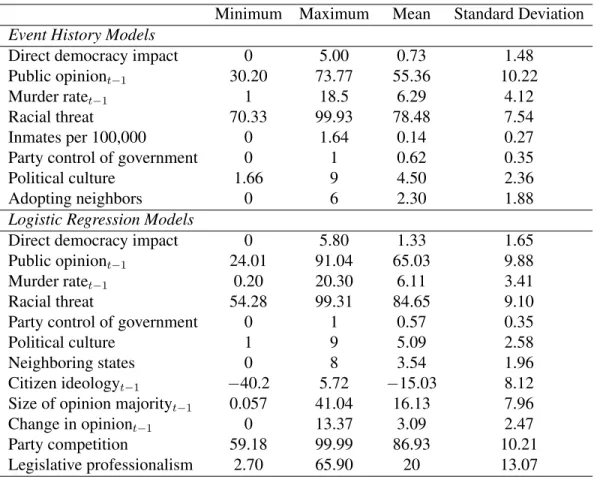
Minimum Maximum Mean Standard Deviation Event History Models
Direct democracy impact 0 5.00 0.73 1.48
Public opiniont 1 30.20 73.77 55.36 10.22
Murder ratet 1 1 18.5 6.29 4.12
Racial threat 70.33 99.93 78.48 7.54
Inmates per 100,000 0 1.64 0.14 0.27
Party control of government 0 1 0.62 0.35
Political culture 1.66 9 4.50 2.36
Adopting neighbors 0 6 2.30 1.88
Logistic Regression Models
Direct democracy impact 0 5.80 1.33 1.65
Public opiniont 1 24.01 91.04 65.03 9.88
Murder ratet 1 0.20 20.30 6.11 3.41
Racial threat 54.28 99.31 84.65 9.10
Party control of government 0 1 0.57 0.35
Political culture 1 9 5.09 2.58
Neighboring states 0 8 3.54 1.96
Citizen ideologyt 1 40.2 5.72 15.03 8.12
Size of opinion majorityt 1 0.057 41.04 16.13 7.96
Change in opiniont 1 0 13.37 3.09 2.47
Party competition 59.18 99.99 86.93 10.21
Legislative professionalism 2.70 65.90 20 13.07
Difficulty and Legislative Insulation Indices. The Qualification Difficulty Index takes into
account the obstacles voters face in getting an initiative or referendum on the ballot, with
particular emphasis on the state’s petition signature requirements, while the Legislative
In-sulation Index measures the extent to which the legislature is able to amend voter-approved
measures. All non-direct democracy states receive the minimum direct democracy impact
score of zero, whereas the states that rely on these institutions most heavily—Oregon and
California—receive a score of around five. Table 2 displays the summary statistics for direct
democracy impact as well as the other continuous variables that appear in the models.
As Hypothesis 1 implies, I am particularly interested in the interaction of public
opin-ion and direct democracy. I obtained yearly state-level estimates of death penalty support
from Gelman and Shirley (2015), who computed them for the years 1953 to 2005 using
Bayesian MRP. They utilized similarly worded survey questions from Gallup and the
convicted of murder.” The summary statistics for death penalty opinion in Table 2 show
that, on average, well over a majority of Americans favored the death penalty from the
1970s to the mid-2000s (also see Figure 1). Consistent with previous studies (e.g., Page
and Shapiro 1983), I lag the opinion measure by one year. This time gap gives state
govern-ments a reasonable amount of time to respond to changes in opinion, while also ensuring
that opinion precedes policy, thus reducing the possibility of endogeneity. Furthermore,
in order to ensure that the legislature is responding to citizens’ issue-specific views, rather
than their general ideological orientation, I include a lagged measure of citizen ideology
when possible.5 Using Enns and Koch’s (2013) yearly MRP estimates of citizen ideology,
I subtracted the percentage of liberals from the percentage of conservatives in each state
(Lewis and Jacobsmeier 2017).
The models control for several other factors that could plausibly affect the likelihood
that a state will reinstate or retain the death penalty. Policy is thought to be at least partly a
function of a state’s political conditions. Accordingly, I include Klarner’s (2003) measure
of party control of government. The variable runs from 0 to 1, with higher scores
indicat-ing states where the Democratic Party controls more branches of government. I include
this control because the Republican Party is generally considered to be more supportive of
capital punishment. Additionally, when modeling post-Furmanreinstatements, I include a
dummy variable denoting the presence of divided government. Under divided party
con-trol, there is a greater need for compromise, and so lawmakers typically encounter more
obstacles in enacting legislation (Berry and Berry 1990; Hansen 1983).
Also exclusive to the event history models is a variable measuring the death penalty’s
salience at a given point in time. The reason I include such a variable is that policy change
is most likely to occur when an issue is at or near the top of the agenda (Haider-Markel
and Meier 1996; Baumgartner and Jones 1993). Similar to previous studies (e.g., Emmert
and Traut 2003), I measure salience with a lagged count of the number of stories under
the “capital punishment” heading in theNew York Times Index. Baumgartner, De Boef and
Boydstun (2008), from whom I obtained these data, demonstrate that theTimes’coverage
of the death penalty is representative of the media environment as a whole, making it an
appropriate proxy for the issue’s salience.
Another set of controls considers the role of political geography. Regional
diffu-sion commonly serves as an explanation for state policy adoption (e.g., Walker 1969; Gray
1973). Such models rely on social learning theory in positing that states emulate policies
adopted by their neighbors. The variable controlling for the effects of regional diffusion
is a count of the number of neighboring states with an active death penalty statute. Like
countless other studies in the state politics literature, I also include a dummy variable for
the 11 Southern states that comprised the Confederacy. The South dummy serves an
impor-tant role when studying the racialized issue of the death penalty due to the region’s unique
history of racial conflict and oppression. Moreover, the modern death penalty is largely a
Southern phenomenon (Baumgartner et al. 2018).6
Previous research has found that the related but arguably independent concepts of
racial threat and political culture influence death penalty policy (Fisher and Pratt 2006;
Jacobs and Carmichael 2002). Under racial threat theory, the death penalty may serve
as a means by which whites attempt to impose social control on growing minority
popu-lations. The relationship, however, should be nonlinear, in that once the minority group
reaches a certain threshold, it should have gained enough political power to move policy
in the other direction. I compute my measure of racial threat using the following formula:
100 |70 percentage of white population|(Baumgartner, Box-Steffensmeier and
Camp-bell 2018). Other types of states that have been found to be predisposed to have the death
penalty are those with traditionalistic, as opposed to moralistic or individualistic, political
cultures (Fisher and Pratt 2006). In traditionalistic states, which tend to be less racially
homogeneous, government is viewed as a vehicle for elites to control the masses (Hero
and Tolbert 1996). Punitive criminal justice policies such as the death penalty are thus
considered essential to maintaining law and order. In all my analyses, I use Sharkansky’s
(1969) measure of political culture, which ranges from one for moralistic states to nine for
traditionalistic states.
The final set of controls in the responsiveness models account for two seemingly
re-lated factors: the prevalence of homicide in a state and the extent to which it relies on the
death penalty as a punishment. Because of the popular belief that the death penalty is a
deterrent to murder, high murder rates should encourage states to adopt and preserve the
death penalty. I obtained yearly data on each state’s homicide rate from the FBI’s Uniform
Crime Reports. I lag this variable by one year in order to give elected officials adequate
time to respond to changes in the murder rate. In the event history models, I also control for
the size of each state’s death row population per 100,000 people prior toFurman, because
it is reasonable to expect that states that used the death penalty more frequently responded
to the ruling with greater urgency. These data come from the Bureau of Justice Statistics’
1971-72 Capital Punishment Report.7
The remaining models seek to explain the effect of direct democracy on policy
con-gruence. The data are again in cross-sectional time series form and cover the 1982 to 2006
time frame, but this time the dependent variable indicates whether state death penalty
pol-icy in a given year matches majority opinion. As shown by the summary statistics for the
congruence variable in Table 1, policy was congruent with majority opinion 79 percent of
the time, a figure far exceeding that found in Lax and Phillips (2012), who examine policy
congruence across 39 policies. As mentioned previously, due to its salience and easily
un-derstandable nature, the death penalty is the sort of issue on which one would expect states
to exhibit a high level of congruence. Because the dependent variable is dichotomous, I
again estimate logistic regressions with state random effects. However, since the proportion
of states with congruent policies varies from year to year—primarily due to shifts in opinion
over time—I specify these models with fixed effects for year. The independent variable of
interest is either the direct democracy dummy or direct democracy impact.
The models also control for institutional and political factors that may impact policy
congruence. Previous studies show that judges who must run in either retention or regular
elections are under added pressure to follow public opinion (Canes-Wrone, Clark and Kelly
2014). Therefore, I use a dummy variable to signify states whose supreme court judges
are subject to election. I also control for legislative professionalism, because legislators
in professionalized institutions have more of the resources needed to gauge public opinion
and quickly respond to changes in it. I measure legislative professionalism with the Squire
Index (Squire 1992; Squire 2007; Squire 2017). Another important factor to consider is
the level of political competition in a state, which I measure with a folded Ranney Index
(Ranney 1976). Intense two-party competition should incentivize the parties to cater to
public preferences.
In addition, the nature of public opinion in a state may make it more or less likely that
policy will match majority opinion. The wider the margin by which voters favor a certain
policy, the clearer their views should be to government, and the more pressure they should
collectively be able to apply to it (Lewis and Jacobsmeier 2017). In states with more divided
electorates, by contrast, lawmakers have less ability to gauge public opinion as well as less
incentive to follow it. I calculate the size of the opinion majority by taking the absolute
value of 50 minus the level of support for the death penalty in the previous year. Similarly,
states experiencing constant shifts in public opinion should have more difficulty attaining
policy congruence than states where public opinion is relatively stable. I thus include a
lagged variable indicating the extent to which opinion changed from one year to the next.
Results
Table 3 reports the results for the event history models without the interaction terms,
thereby allowing for a test of whether direct democracy accelerated reinstatement of the
death penalty afterFurman. The coefficients are hazard ratios; thus, values over one
below one indicate variables associated with a decrease in this risk. The results provide
support for my expectation that direct democracy expedited reinstatement. The statistically
significant hazard ratio of 7.31 in Model 1 shows that, in a given year, the “hazard” of
re-instating the death penalty is over seven times higher in direct democracy states, all else
equal. Put another way, the survival function, which estimates the probability that a state
did not experience the event up until a specific point in time, shows that the probability that
a direct democracy state did not reinstate the death penalty by 1976, the year the Supreme
Court authorized the restoration of the death penalty inGregg v. Georgia, is .32, compared
to .86 for non-direct democracy states (see Figure 6 in the appendix). The results fail to
support other common explanations for policy adoption. Although the coefficient for death
penalty opinion takes on the expected positive sign, it falls just short of the conventional
level of statistical significance (p=.071). The coefficients for political culture, regional
dif-fusion, and racial threat are also insignificant and, in the case of the latter two, in the wrong
direction.
Model 2 substitutes direct democracy impact for the direct democracy dummy.
Nonethe-less, the results tell a similar story. The hazard ratio of 1.99 indicates that for every
one-point increase in direct democracy impact, the risk that a state will adopt a revised death
penalty statute grows by 99 percent, all else equal. For states with a direct democracy
im-pact score between two and five, a range that includes all but two direct democracy states,
the probability of not reinstating the death penalty before 1976 ranges from 61 percent to
two percent. For non-direct democracy states, on the other hand, this probability is 88
percent (see Figure 7 in the appendix). The death penalty opinion variable in this model is
statistically significant as well, with a one standard deviation increase in public support for
the death penalty (the equivalent of about ten percentage points) increasing states’ risk of
reinstatement by about 120 percent. Also unlike the previous model, states controlled by
the Republican Party are at a significantly higher risk of reinstatement than those where the
Democratic Party holds more power.
The models in Table 4 add an interaction term for direct democracy and public
Table 3:Event History Models of Death Penalty Reinstatement, 1972-2006
(1) (2)
Direct democracy 7.31* (5.23) — —
Direct democracy impact — — 1.99* (0.46) Public opiniont 1 1.09 (0.05) 1.12* (0.06)
Neighboring states 0.79 (0.23) 0.68 (0.21)
Murder ratet 1 1.23 (0.19) 1.27 (0.21)
Inmates per 100,000 3.05 (3.08) 2.81 (2.95) Party control of government 0.20 (0.18) 0.16* (0.15) Political culture 1.14 (0.21) 1.25 (0.24) Prior abolition 0.17* (0.15) 0.15* (0.14)
Racial threat 0.95 (0.07) 0.94 (0.07)
Divided government 0.44 (0.23) 0.41 (0.22)
South 4.04 (4.12) 4.23 (4.41)
Saliencet 1 1.00 (0.01) 1.00 (0.01)
Log likelihood 43.23 41.97
Notes: Coefficients are hazard ratios. Standard errors in parentheses. N=276.
*p<.05, two-tailed
two variables, as evidenced by the statistically insignificant and only slightly
greater-than-one hazard ratio. While Figure 2 shows that the marginal effect of public opinion is slightly
greater in direct democracy states than in states without direct democracy, neither effect
is statistically indistinguishable from zero. The results for Model 4, which uses the more
nuanced measure of direct democracy impact, are similar. The coefficient for the
interac-tion term is again statistically insignificant, and Figure 3 shows only a very small upward
trend in the marginal effect of opinion as direct democracy impact increases. At all levels of
direct democracy impact, the effects are indistinguishable from zero. In sum, the tendency
of direct democracy states to more swiftly amend their death penalty statutes in response to
Furmanwas not contingent on public opinion.
Whereas the previous analyses estimated the amount of time it took states to respond
toFurman, the following models address the more fundamental question of which states
are more likely to have the death penalty in the first place. Because these are fundamentally
different concepts, the results may not necessarily be the same. In contrast to the event
history models, the data contain both retentionist and abolitionist states and are arranged
Table 4:Event History Models of Death Penalty Reinstatement with Interaction Terms, 1972-2006
(3) (4)
Direct democracy 7.16* (5.15) — —
Direct democracy X public opiniont 1 1.02 (0.08) — —
Direct democracy impact — — 2.05* (0.49)
Direct democracy impact X public opiniont 1 — — 1.03 (0.03)
Public opiniont 1 1.08 (0.07) 1.12* (0.06)
Neighboring states 0.80 (0.24) 0.71 (0.23)
Murder ratet 1 1.22 (0.20) 1.24 (0.21)
Inmates per 100,000 2.99 (3.00) 2.44 (2.57)
Party control of government 0.21 (0.19) 0.17* (0.15)
Political culture 1.14 (0.21) 1.24 (0.24)
Prior abolition 0.16* (0.15) 0.14* (0.13)
Racial threat 0.96 (0.07) 0.95 (0.07)
Divided government 0.44 (0.23) 0.39 (0.21)
South 3.75 (3.93) 3.49 (3.70)
Saliencet 1 1.00 (0.01) 1.00 (0.01)
Log likelihood 43.19 41.47
Notes: Coefficients are hazard ratios. Standard errors in parentheses. N=276.
*p<.05, two-tailed
Fig. 2:Marginal Effects of Public Opinion on Risk of Death Penalty Reinstatement by Direct
Democracy, 1972-2006 (Model 3).
Fig. 3:Marginal Effects of Public Opinion on Risk of Death Penalty Reinstatement by Direct Democracy Impact, 1972-2006 (Model 4).
Note: Shaded region represents 95 percent confidence intervals.
the death penalty serving as the dependent variable. The observation period begins in 1982,
by which time most death penalty statutes were no longer in flux. The logistic regression
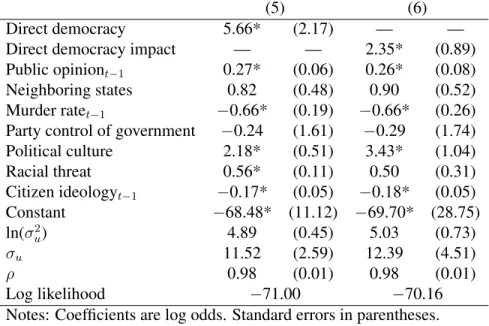
results in Tables 5 and 6 strongly support my expectations regarding direct democracy.
States with either the initiative or popular referendum are more likely to have the death
penalty, as evidenced by the large, positive, and statistically significant coefficient in Model
5. The size of the effect can be more easily understood in terms of predicted probabilities.
Controlling for other factors, the probability that a direct democracy state will have the
death penalty is .82, compared to .71 for states without direct democracy (see FIgure 8
in the appendix). The results for Model 6, which makes use of direct democracy impact
rather than the direct democracy dummy, validate this finding, showing that the probability
of a state having the death penalty increases as the impact of these institutions grows. In
fact, in states with a direct democracy impact score of five, this probability is 88 percent
(see Figure 9 in the appendix). In contrast to the event history models, but consistent with
previous literature, the logistic regression models provide support for the racial threat and
political culture theories. Additionally, even after accounting for citizen ideology, public
Table 5:Logistic Regression Models of Policy Responsiveness, 1982-2006
(5) (6)
Direct democracy 5.66* (2.17) — —
Direct democracy impact — — 2.35* (0.89)
Public opiniont 1 0.27* (0.06) 0.26* (0.08)
Neighboring states 0.82 (0.48) 0.90 (0.52)
Murder ratet 1 0.66* (0.19) 0.66* (0.26)
Party control of government 0.24 (1.61) 0.29 (1.74)
Political culture 2.18* (0.51) 3.43* (1.04)
Racial threat 0.56* (0.11) 0.50 (0.31)
Citizen ideologyt 1 0.17* (0.05) 0.18* (0.05)
Constant 68.48* (11.12) 69.70* (28.75)
ln( 2
u) 4.89 (0.45) 5.03 (0.73)
u 11.52 (2.59) 12.39 (4.51)
⇢ 0.98 (0.01) 0.98 (0.01)
Log likelihood 71.00 70.16
Notes: Coefficients are log odds. Standard errors in parentheses. N=1,225.
*p<.05, two-tailed
responsive to citizens’ issue-specific views, not just their general ideological orientation.
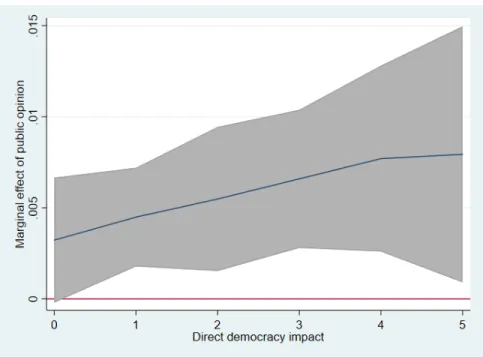
The models in Table 6, which include the interaction of direct democracy and
pub-lic opinion, provide evidence that, when it comes to whether states have the death penalty,
direct democracy enhances responsiveness to public opinion. As expected, in both
mod-els, the interaction of direct democracy and public opinion is statistically significant. The
marginal effects plots in Figures 4 and 5 display this interactive relationship. Figure 4
shows that the marginal effect of public opinion is over three times higher in direct
democ-racy states than in non-direct democdemoc-racy states. Moreover, only for direct democdemoc-racy states
is this effect statistically indistinguishable from zero, casting doubt on whether non-direct
democracy states are responsive to opinion at all. Figure 5 provides further support for my
theory, demonstrating that as direct democracy impact increases, so too does the effect of
public opinion. It is clear, though, that there are diminished returns to increases in direct
democracy impact. Once a state reaches a direct democracy impact level of four, the effect
nearly levels off.
The remaining analyses explore the effect of direct democracy on policy congruence.
Ac-Table 6:Logistic Regression Models of Policy Responsiveness with Interaction Terms, 1982-2006
(7) (8)
Direct democracy 4.66* (2.24) — —
Direct democracy X public opinion 0.48* (0.14) — —
Direct democracy impact — — 2.55* (0.84)
Direct democracy impact X public opinion — — 0.10* (0.03)
Public opiniont 1 0.11 (0.08) 0.29* (0.07)
Neighboring states 1.81* (0.48) 1.11* (0.49)
Murder ratet 1 0.44 (0.23) 0.52* (0.21)
Party control of government 0.65 (1.68) 0.43 (1.71)
Political culture 2.06* (0.50) 3.11* (0.62)
Racial threat 0.60* (0.12) 0.56* (0.14)
Citizen ideologyt 1 0.14* (0.05) 0.15* (0.05)
Constant 58.38* (9.97) 54.26* (10.61)
ln( 2
u) 4.75 (0.48) 4.98 (0.46)
u 10.75 (2.56) 12.05 (2.75)
⇢ 0.97 (0.01) 0.98 (0.01)
Log likelihood 65.45 67.00
Notes: Coefficients are log odds. Standard errors in parentheses. N=1,225.
*p<.05, two-tailed
Fig. 4:Marginal Effects of Public Opinion on Probability of Having the Death Penalty by Direct
Democracy, 1982-2006 (Model 7).
Fig. 5:Marginal Effects of Public Opinion on Probability of Having the Death Penalty by Direct Democracy Impact, 1982-2006 (Model 8).
Note: Shaded region represents 95 percent confidence intervals.
cordingly, retentionist states where a majority of citizens support the death penalty would
be coded as having congruent policy, as would abolitionist states where the death penalty
commands less than majority support. As mentioned previously, while both direct and
non-direct democracy states should exhibit high levels of policy congruence on the death
penalty, policy should be more likely to match majority will in direct democracy states.
A bivariate comparison of proportions test provides preliminary support for this
expecta-tion. From 1982 to 2006, policy was congruent with majority opinion 83.3 percent of the
time in direct democracy states, compared to 75.03 percent of the time in states without
direct democracy. This over eight-percentage point difference is statistically significant (p
<.001).
Table 7 reports the results for the logistic regression models, which provide a more
sophisticated test of the congruence hypothesis. The results are similar regardless of the
measure of direct democracy used. The coefficient for the direct democracy dummy used
in Model 9 is fairly large and positively signed, as expected. However, the large standard
error prevents it from being statistically significant (p = .448). Likewise, in Model 10,
Table 7:Logistic Regression Models of Policy Congruence, 1982-2006
(9) (10)
Direct democracy 1.32 (1.74) — —
Direct democracy impact — — 0.42 (0.51)
Size of opinion majorityt 1 0.20* (0.06) 0.20* (0.06)
Change in opiniont 1 0.01 (0.08) 0.01 (0.08)
Legislative professionalism 0.09* (0.03) 0.09* (0.03) Party competition 0.06 (0.03) 0.06 (0.03)
Elected court 0.38 (2.23) 0.33 (2.23)
Constant 11.35* (3.60) 11.31* (3.61)
ln( 2
u) 4.30 (0.36) 4.30 (0.36)
u 8.57 (1.52) 8.57 (1.52)
⇢ 0.96 (0.01) 0.96 (0.01)
Log likelihood 158.26 158.29
Notes: Coefficients are log odds. Standard errors in parentheses. N=1,225.
*p<.05, two-tailed
insignificant (p = .412). Not surprisingly, there is a higher probability of congruence in
states with larger opinion majorities. Policy is about 10 percent less likely to be congruent in
states where public opinion is evenly divided than in states with the mean opinion majority
margin (about 16 percentage points).
Conclusion
This paper applied the longitudinal research design promoted by Lewis and
Jacob-smeier (2017) to the study of how direct democracy conditions the effect of public opinion
on death penalty policy. Such a design, which is only possible due to recent breakthroughs
in measuring state-level opinion, allows for a more comprehensive analysis of policy
rep-resentation. Overall, the findings present a mixed picture. I first used event history analysis
to examine the role direct democracy played in encouraging states to reinstate the death
penalty followingFurman. As expected, direct democracy states were significantly quicker
to amend their statutes in response to the ruling. Their tendency to do so, though, was
not dependent on public opinion, suggesting that direct democracy, in and of itself, had
this effect. At first glance, this finding is perplexing because, in theory, direct democracy
However, the thermostatic model of public opinion, in concert with my theory, may offer
an explanation. Consistent with the thermostatic model, which holds that policy change
causes public opinion to move in the opposite direction (Soroka and Wlezien 2010;
Erik-son, Mackuen and Stimson 2002), support for the death penalty rose dramatically after
Furman(Baumgartner et al. 2018). But even if death penalty support in a state was still
rel-atively low, lawmakers may have believed that support would continue to rise as the public’s
impatience with elected officials’ failure to rectify what was widely perceived as judicial
overreach grew. Were the death penalty to eventually enjoy majority support, there would
be a real threat of an initiative campaign to reinstate it. Voters elsewhere had already sent
a powerful signal that, if necessary, they were willing to act unilaterally to thwart supposed
judicial activism: Outraged by the California Supreme Court’s decision to invalidate the
state’s death penalty law in the months precedingFurman, California voters amended the
state constitution on the following Election Day to explicitly allow for the death penalty,
before any state legislature had amended its statute in accordance with Furman. States,
of course, do not exist in a vacuum; rather, they learn from each other (Berry and Berry
1990). Hence, legislators in other states probably understood that what transpired in
Cali-fornia could also happen in their states. It was in the interest of lawmakers to forestall such
initiative campaigns, which—if successful—would have denied them the ability to claim
credit for having restored the death penalty themselves. In short, therefore, legislators in
direct democracy states were under added pressure to respond prematurely to the growing
tide of support for the death penalty.
The subsequent analyses used logistic regression on cross-sectional time series data
to provide an alternative test of the responsiveness hypothesis, with the results lending
support to my expectation that public opinion has a greater impact on death penalty policy
in direct democracy states. By extension, the models also revealed that such states are more
likely to have the death penalty. Importantly, the logistic regression models differed from
the event history ones in that they predicted whether a state will have the death penalty,
rather than the time to reinstatement. This distinction may help to explain the conflicting
Furman, states were operating in an environment in which death penalty support was clearly
on the upswing. My theory allows for the possibility that when lawmakers have greater
certainty about where public opinion is headed, direct democracy alone can promote policy
change in the corresponding direction. In such a scenario, because lawmakers do not want
to forfeit a future opportunity to credit-claim, the current state of public opinion may not be
so important.
The cross-sectional time series data also revealed, however, that the enhanced
respon-siveness brought about by direct democracy institutions does not translate into enhanced
congruence. The reason direct democracy can simultaneously promote responsiveness but
not congruence is that the bar for achieving the latter form of policy representation is much
higher (Lax and Phillips 2012). Indeed, public opinion need only have some effect on policy
in order for a state to exhibit responsiveness, while congruence requires that policy actually
be aligned with majority preferences (Lax and Phillips 2009a).
My findings have implications for the future of the death penalty in the United States.
Although I find that direct democracy increases the probability that a state will have the
death penalty, theory and real-world events suggest that direct democracy is not inherently
pro-death penalty. As explained previously, these institutions instead increase the
influ-ence of median voter preferinflu-ences (Lupia and Matsusaka 2004), and it just so happens that
the public was strongly pro-death penalty during the late twentieth century (Baumgartner
et al. 2018; Enns 2016). Since then, however, public opinion has turned against the death
penalty (Baumgartner, De Boef and Boydstun 2008). Should it continue to do so, direct
democracy states may actually lead the way in abolishing it. This would not be the first
time that direct democracy has had such an effect. For example, In 1964, when public
sup-port for the death penalty was only slightly lower than it is now, Oregon voters abolished
the death penalty through the initiative process. Although they later voted to reinstate the
death penalty in 1978, the fact remains that direct democracy can also aid death penalty
opponents in achieving their policy goals. It would thus not be surprising if, in the coming
years, citizens abolished or significantly restricted the scope of the death penalty via the
APPENDIX
Table 8:State Reinstatement of the Death Penalty AfterFurman v. Georgia
State Year Reinstated
Alabama 1976 California 1973* Colorado 1974 Connecticut 1973 Delaware 1974 Florida 1972 Georgia 1973 Idaho 1973 Illinois 1974 Indiana 1973 Iowa — Kansas 1994 Kentucky 1974 Louisiana 1973 Maryland 1975 Massachusetts 1979 Mississippi 1974 Missouri 1975 Montana 1973 Nevada 1973
New Hampshire 1974
New Jersey 1982
New Mexico 1979
New York 1995
North Carolina 1974
Ohio 1973
Oklahoma 1973
Oregon 1978*
Pennsylvania 1974
South Carolina 1974
South Dakota 1979
Tennessee 1974 Texas 1973 Utah 1973 Vermont — Virginia 1975 Washington 1975
West Virginia —
Wyoming 1973
* Indicates reinstatement through citizen initiative
Table 9:Event History Models of Death Penalty Reinstatement, 1972-2006 (All States)
(11) (12)
Direct democracy 3.70* (2.18) — —
Direct democracy impact — — 1.55* (0.27) Public opiniont 1 1.11* (0.05) 1.13* (0.05)
Neighboring states 0.99 (0.27) 0.91 (0.26)
Murder ratet 1 1.22 (0.18) 1.25 (0.19)
Inmates per 100,000 2.84 (2.82) 2.55 (2.58) Party control of government 0.32 (0.27) 0.30 (0.26) Political culture 1.19 (0.22) 1.28 (0.24) Prior abolition 0.08* (0.07) 0.07* (0.07)
Racial threat 0.93 (0.07) 0.92 (0.07)
Divided government 0.47 (0.24) 0.47 (0.24)
South 3.86 (3.87) 3.74 (3.78)
Saliencet 1 1.00 (0.01) 1.00 (0.01)
Log likelihood 46.94 46.18
Notes: Coefficients are hazard ratios. Standard errors in parentheses. N=556.
*p<.05, two-tailed
Table 10:Event History Models of Death Penalty Reinstatement with Interaction Terms, 1972-2006
(All States)
(13) (14)
Direct democracy 3.99* (2.44) — —
Direct democracy X public opiniont 1 0.97* (0.06) — —
Direct democracy impact — — 1.58* (0.29)
Direct democracy impact X public opiniont 1 — — 0.99 (0.02)
Public opiniont 1 1.13* (0.06) 1.13* (0.06)
Neighboring states 0.96 (0.27) 0.88 (0.26)
Murder ratet 1 1.23 (0.18) 1.25 (0.19)
Inmates per 100,000 3.00 (3.03) 2.75 (2.85)
Party control of government 0.30 (0.26) 0.28 (0.24)
Political culture 1.20 (0.22) 1.29 (0.25)
Prior abolition 0.08* (0.08) 0.08* (0.07)
Racial threat 0.92 (0.07) 0.92 (0.07)
Divided government 0.46 (0.24) 0.46 (0.24)
South 4.44 (4.65) 4.18 (4.37)
Saliencet 1 1.00 (0.01) 0.99 (0.01)
Log likelihood 46.83 46.09
Notes: Coefficients are hazard ratios. Standard errors in parentheses. N=556.
Table 11:Logistic Regression Models of Policy Responsiveness without Southern States, 1982-2006
(15) (16)
Direct democracy 4.27* (1.47) — —
Direct democracy impact — — 0.79* (0.33)
Public opiniont 1 0.28* (0.06) 0.21* (0.07)
Neighboring states 0.00 (0.40) 0.43 (0.33)
Murder ratet 1 0.71* (0.21) 0.60* (0.20)
Party control of government 0.02 (1.61) 0.22 (1.45)
Political culture 0.54 (0.42) 0.53 (0.48)
Racial threat 0.59* (0.08) 0.39* (0.10)
Citizen ideologyt 1 0.20* (0.05) 0.16* (0.05)
Constant 64.86* (8.96) 43.70* (10.62)
ln( 2
u) 4.79 (0.52) 4.90 (0.58)
u 10.99 (2.83) 11.59 (3.33)
⇢ 0.97 (0.01) 0.98 (0.01)
Log likelihood 68.04 69.43
Notes: Coefficients are log odds. Standard errors in parentheses. N=950.
*p<.05, two-tailed
Table 12:Logistic Regression Models of Policy Responsiveness with Interaction Terms and without
Southern States, 1982-2006
(17) (18)
Direct democracy 3.17 (2.46) — —
Direct democracy X public opinion 0.43* (0.14) — —
Direct democracy impact — — 0.72* (0.28)
Direct democracy impact X public opinion — — 0.08* (0.03)
Public opiniont 1 0.11 (0.08) 0.25* (0.05)
Neighboring states 1.50* (0.58) 0.42 (0.28)
Murder ratet 1 0.50* (0.21) 0.56* (0.17)
Party control of government 0.53 (1.69) 0.20 (1.37)
Political culture 1.56* (0.68) 0.40 (0.34)
Racial threat 0.52* (0.12) 0.43* (0.07)
Citizen ideologyt 1 0.15* (0.05) 0.14* (0.04)
Constant 47.48* (10.73) 32.92* (5.31)
ln( 2
u) 4.95 (0.54) 4.50 (0.51)
u 11.89 (3.19) 9.48 (2.44)
⇢ 0.98 (0.01) 0.96 (0.02)
Log likelihood 64.53 65.82
Notes: Coefficients are log odds. Standard errors in parentheses. N=950.
Table 13:Logistic Regression Models of Policy Responsiveness with Yearly Fixed Effects, 1982-2006
(19) (20)
Direct democracy 5.37* (2.43) — —
Direct democracy impact — — 3.53* (0.96)
Public opiniont 1 0.62* (0.13) 0.67* (0.17)
Neighboring states 0.58 (0.60) 1.13 (0.75)
Murder ratet 1 0.54 (0.30) 0.59 (0.31)
Party control of government 2.43 (2.41) 2.42 (2.42)
Political culture 2.90* (0.64) 5.36* (0.74)
Racial threat 0.30* (0.14) 0.48* (0.16)
Citizen ideologyt 1 0.10 (0.11) 0.11 (0.12)
Constant 69.23* (14.63) 95.33* (15.72)
ln( 2
u) 5.48 (0.53) 5.77 (0.37)
u 15.51 (4.08) 17.88 (3.29)
⇢ 0.99 (0.01) 0.99 (0.00)
Log likelihood 62.22 59.86
Notes: Coefficients are log odds. Standard errors in parentheses. N=1,225.
*p<.05, two-tailed
Table 14:Logistic Regression Models of Policy Responsiveness with Interaction Terms and Yearly
Fixed Effects 1982-2006
(21) (22)
Direct democracy 4.29 (4.49) — —
Direct democracy X public opinion 0.66* (0.21) — —
Direct democracy impact — — 2.44* (0.75)
Direct democracy impact X public opinion — — 0.15* (0.04)
Public opiniont 1 0.40* (0.14) 0.79* (0.15)
Neighboring states 1.02 (0.91) 0.35 (0.62)
Murder ratet 1 0.39 (0.33) 0.52 (0.32)
Party control of government 3.49 (2.30) 4.63 (2.64)
Political culture 2.61* (0.83) 4.25* (0.67)
Racial threat 0.72* (0.18) 0.63* (0.13)
Citizen ideologyt 1 0.07 (0.12) 0.04 (0.11)
Constant 66.50* (15.09) 61.03* (10.40)
ln( 2
u) 5.22 (0.51) 5.46 (0.43)
u 13.61 (3.48) 15.33 (3.32)
⇢ 0.98 (0.01) 0.99 (0.01)
Log likelihood 55.44 56.67
Notes: Coefficients are log odds. Standard errors in parentheses. N=1,225.
Fig. 6:Survival Function by Direct Democracy (Model 1)
Fig. 8:Probability of Having the Death Penalty by Direct Democracy (Model 5)
Note: Error bars are 95 percent confidence intervals.
Fig. 9:Probability of Having the Death Penalty by Direct Democracy Impact (Model 6)
REFERENCES
Arceneaux, Kevin. 2002. “Direct Democracy and the Link between Public Opinion and State Abortion Policy.”State Politics and Policy Quarterly2(4):372–387.
Baumgartner, Frank R. and Bryan D. Jones. 1993. Agendas and Instability in American Politics. Chicago: University of Chicago Press.
Baumgartner, Frank R., Janet M. Box-Steffensmeier and Benjamin W. Campbell. 2018. “Event dependence in U.S. executions.”PLoS ONE13(1):1–13.
Baumgartner, Frank R., Marty Davidson, Kaneesha R. Johnson, Arvind Krishnamurthy and Colin P. Wilson. 2018. Deadly Justice: A Statistical Portrait of the Death Penalty. New York: Oxford University Press.
Baumgartner, Frank R., Suzanna De Boef and Amber E. Boydstun. 2008. The Decline of the Death Penalty and the Discovery of Innocence. New York: Cambridge University Press.
Berry, Frances Stokes and William D. Berry. 1990. “State Lottery Adoptions as Policy Innovations: An Event History Analysis.”American Political Science Review84(2):395– 415.
Boehmke, Frederick J. 2002. “The Effect of Direct Democracy on the Size and Diversity of State Interest Group Populations.”Journal of Politics64(3):827–844.
Boehmke, Frederick J. 2005. The Indirect Effect of Direct Legislation: How Institutions Shape Interest Group Systems. Columbus, OH Ohio State University Press.
Bowler, Shaun and Todd Donovan. 2004. “Measuring the Effect of Direct Democracy on State Policy: Not All Initiatives Are Created Equal.”State Politics and Policy Quarterly 4(3):345–363.
Box-Steffensmeier, Janet M. and Bradford S. Jones. 2004. Event History Modeling: A Guide for Social Scientists. New York: Cambridge University Press.
Burden, Barry C. 2005. “Institutions and Policy Representation in the States.”State Politics and Policy Quarterly5(4):373–393.