Private equity buyouts and workplace safety
∗
Jonathan Cohn
The University of Texas-Austin
Nicole Nestoriak
Bureau of Labor Statistics
Malcolm Wardlaw
The University of Texas-Dallas
September 2017
Abstract
This paper presents evidence of a large, persistent decline in establishment-level workplace injury rates after private equity (PE) buyouts of publicly-traded firms but not already-private firms. Cross-sectional evidence further links the public-firm post-buyout decline to alleviation of market pressure to focus on short-term performance. Employment drops more in low-injury risk establishments, and the fall in injury rates does not correlate with reductions in employment post-buyout, suggesting that system-atic outsourcing of dangerous jobs or underreporting due to layoff concerns is unlikely to explain the results. Overall, our results suggest a novel dimension on which buyouts improve firms’ fundamental operational competencies.
∗Jonathan Cohn: [email protected], (512) 232-6827. Nicole Nestoriak:
Private equity buyouts and workplace safety
Abstract
Growing evidence suggests that private equity (PE) buyouts result in significant
oper-ating improvements in acquired firms (Davis et al. (2014), Bernstein and Sheen (2016)).
However, the nature of the operational changes underlying these improvements remains
largely a matter of conjecture. Identifying the sources of operating improvements in buyouts
is essential for understanding whether and how PE firms contribute to the economy. These
gains could reflect fundamental increases in productivity or merely a redistribution of rents
from employees, suppliers, and other corporate stakeholders to investors through the
extrac-tion of concessions. Such expropriaextrac-tion is consistent with concerns voiced by PE industry
critics as well as theoretical arguments that acquirers capture rents by reneging on implicit
commitments inherited from previous owners (Shleifer and Summers, 1988).
In general, a lack of detailed data on characteristics of firms’ operations makes it difficult
to investigate the nature of operational changes after buyouts. This paper overcomes the
data challenge by analyzing establishment-level workplace safety records from the Bureau
of Labor Statistics’ (BLS’) annual Survey of Injuries and Illnesses (SOII). Workplace safety
outcomes reflect choices about the way a firm organizes and executes its operations and
therefore provide a lens into the nature of operational changes accompanying buyouts.
Evi-dence of a strong negative relationship between workplace injury rates and firm value (Cohn
and Wardlaw, 2016) suggests that these outcomes are value-relevant. At a broader level,
workplace safety is a major policy issue, with estimates of the cost of treating workplace
injuries and illnesses in the U.S. exceeding $250 billion per year (Leigh, 2011).1
Our main finding is a large, sustained decline in workplace injury rates after PE buyouts
of publicly-traded firms in the 1990s and 2000s, both in absolute terms and relative to
samples of control establishments constructed using several different approaches.
Difference-1The BLS reports 2.9 million U.S. private-sector workplace injuries and illnesses and
4,836 fatalities in 2015 (https://www.bls.gov/news.release/osh.nr0.htm). Globally, the
Interna-tional Labour Organization (ILO) reports 430 million occupational injuries and illnesses and
in-differences estimates imply a 0.66 to 0.93 average percentage point decline in annual
injuries per employee from the four years before to four years after a buyout, or 10.3% to
14.5% of the pre-buyout sample mean. This decline begins the second year post-buyout
— a plausible lag if operating changes take time to implement and manifest in observable
outcomes — and persists through at least the fourth year post-buyout. These results point
to a novel dimension on which PE buyouts of publicly-traded firms lead to improvements in
operating performance — one that appears if anything to benefit employees. In contrast, we
find no change in injury rates after buyouts of already-private firms.
To help guide interpretation of these results, we interviewed executives from several
acquired firms in our sample about the nature of operational changes they experienced
af-ter buyouts. A common refrain in these inaf-terviews was increased organizational patience
for unglamorous, long-term investments in improving basic operational competencies after
buyouts. These investments — in activities such as streamlining production, training
em-ployees, maintaining machinery, and real-time monitoring — may be easier to undertake
away from pressure to meet the market’s short-term profit, growth, and stock-price
expec-tations. As evidence of a lengthening of decision horizons, Lichtenberg and Siegel (1990)
find increased research spending after buyouts and Lerner et al. (2011) find increases in
some forms of patenting activity. Cornelli and Karakaş (2015) find that CEO turnover and
turnover-performance sensitivity decline after PE buyouts, suggesting greater patience with
management.2 Whether or not improving workplace safety is an explicit goal, long-term
op-erational improvements are likely to reduce the frequency of safety-compromising workplace
accidents.3
The decline in injury rates after buyouts of public but not private firms supports this
2The Private Equity Growth Council, a PE industry group, argues that PE ownership allows a firm to
“set long-term operational goals, without the concern of meeting market expectations quarter by quarter.”
3Caskey and Ozel (2017) find elevated workplace injury rates in firms that meet or just beat analyst
interpretation, as already-private firms are not exposed to pressure to meet market
expecta-tions pre-buyout. In addition, we find a greater decline in injury rates in public firms with
more pre-buyout analyst coverage, transitory institutional ownership, and discretionary
ac-cruals. To the extent that analyst coverage and transitory institutional ownership are sources
of short-term pressure, while discretionary accruals are an accounting response to such
pres-sure, these results suggest that injury rates fall more after buyouts when there is more scope
for relieving pressure to focus on short-term results. More generally, they point to greater
patience for long-term operational investments as an important consequence of PE buyouts.
In addition to changing ownership structure, PE buyouts are also typically accompanied
by increases in debt loads. Cohn and Wardlaw (2016) and Nie and Zhao (2015) find that
high corporate debt loads are associated with poor safety outcomes, which they attribute
to reduced capacity to invest in workplace safety. On the surface, the fall in injury rates
after buyouts may appear at odds with these findings. However, debt in PE-backed firms
specifically may have a limited impact on operational investment because PE owners inject
capital in portfolio companies (Hotchkiss et al. (2014), Cohn et al. (2014)), buyout debt
is concentrated and therefore easier to renegotiate, and increased free cash flow increases
debt capacity. Nevertheless, we do find evidence (albeit weak) that the decline in rates of
more-serious injuries after a buyout is smaller when the acquired firm takes on more debt.
As with most studies of PE buyouts, we lack exogenous variation in buyout activity with
which to completely isolate the causal effect of buyouts. Buyouts are not random. PE buyers
may select targets that would experience decreases in workplace injury rates even absent a
buyout. We address selection concerns as best we can by comparing changes in injury
rates after buyouts to several matched control samples that are similar to acquired firms on
observable dimensions. We also note that it is unclear why selection would cause injury rate
declines in public firms but not already-private firms or larger declines in public firms with
cannot rule out the possibility that selection is responsible for the decline in workplace injury
rates after PE buyouts of public firms, the evidence taken together is easier to reconcile with
a causal interpretation.
Another possibility is that buyouts cause a decline in reported injury rates, but that this
decline reflects a change in reporting of workplace injuries rather than actual injury risk.
Perhaps PE owners actively pressure employees to underreport workplace injuries. However,
it is unclear why this pressure would cause a drop in reported injuries after buyouts of
public but not private firms. An alternative reporting-based explanation that could account
for this difference is that employees refrain from reporting workplace injuries when they are
worried about being laid off (Boone et al., 2011), and public-firm buyouts are more likely to
be accompanied by employment reductions (Davis et al., 2014).4 However, while we do not
observe layoff risk ex ante, injury rates actually decline slightlyless in establishments when
employment falls ex post after a buyout.
Yet another possibility is that injury rates fall after public-firm buyouts because of a
change in the job mix and not because specific jobs actually become safer. For example,
PE owners may disproportionately export dangerous jobs to countries with low safety
stan-dards.5 While we lack job-level data with which to assess this possibility directly, we
doc-ument smaller post-buyout employment reductions in establishments with high pre-buyout
injury rates or in high-injury rate industries (compared to other establishments in the same
firm). This pattern would be surprising if firms seek to shift away from dangerous activities
post-buyout. Combined with the reduction in injury rates after buyouts, this result suggests
an intriguing possibility — that PE-backed firms specialize in operationally-challenging
busi-4Davis et al. (2014) find significant within-establishment employment declines after buyouts of public
firms, though they find that additional jobs from new establishment creation largely offset these declines at the firm level.
5Using employee-level Swedish data, Olsson and Tåg (2017) present evidence that employees are more
nesses because they have a comparative advantage in managing them.
Our paper builds on recent work examining the establishment-level operational
conse-quences of PE buyouts. Analyzing comprehensive establishment-level U.S. census data,
Davis et al. (2014) document significant improvements in total factor productivity after
PE buyouts, most of it driven by reallocation of resources from low-productivity to
high-productivity establishments. In contrast, we document within-establishment improvements
in a specific facet of operations, providing a lens into the nature of operational changes
af-ter buyouts. In the same general vein, Bernstein and Sheen (2016) find that restaurants’
health ratings improve after their parent firms are acquired in PE buyouts. Relative to their
paper, ours focuses on an aspect of operations more closely connected to the actual
produc-tion process. It also studies firms in a broad set of industries, including manufacturing and
distribution, rather than in a single service industry. We also add to this literature more
generally by shedding light on the nature of the operational frictions that PE ownership
helps to address.6
Our paper also contributes to the literature examining the impact of PE ownership on
a firm’s employees.7 Much of this literature focuses on short-term changes in employment
and compensation after PE buyouts.8 One exception is a recent paper by Agrawal and
Tambe (2016), who present evidence that systematic IT upgrades post-buyout increase the
long-run value of employees’ human capital. Their sample consists predominantly of
white-collar workers, who are the most likely beneficiaries of IT-related knowledge transfers. In
6A large literature studies changes in accounting measures of operating performance after PE buyouts,
including work by Kaplan (1989b), Muscarella and Vetsuypens (1990), Smith (1990), Wright et al. (1992), Smart and Waldfogel (1994), Amess and Wright (2007), Guo et al. (2011), Boucly et al. (2011), Cohn et al. (2014), and Cohn et al. (2015). Kaplan (1989a), Denis (1994), and Kaplan (1994) describe specific operational improvements in case studies of four separate buyouts. Bernstein et al. (2016) find that industries in which PE firms invest tend to grow as a whole, suggesting spillover effects within industry.
7Fracassi et al. (2017) examine the impact of PE buyouts on consumers, another important set of corporate
stakeholders.
8See, for example, Kaplan (1989b), Muscarella and Vetsuypens (1990), Lichtenberg and Siegel (1990),
contrast, improvements in workplace safety disproportionately affect the well-being of
front-line employees. In surveying the literature, Viscusi and Aldy (2003) conclude that employees
ascribe a personal cost of $20,000 to $70,000 in 2015 dollars to an average workplace injury,
suggesting that the effect of improvements in workplace safety on these employees’ well-being
may be large.9
1
Workplace Safety and PE Buyouts
In this section, we discuss how firm’s operational decisions impact workplace safety,
ex-plore how PE ownership potentially impacts these decisions, and describe additional insights
from interviews we conducted with executives of both PE buyout specialists and firms
ac-quired in PE buyouts. The discussion of workplace safety is adapted from and extends
Section 1 of Cohn and Wardlaw (2016). That discussion is based largely on conversations
with industrial safety practitioners and a case study on safety at Alcoa by Clark and Margolis
(2000).
1.1
Workplace safety and operating policies and practices
Despite substantial improvements in workplace safety over the last century, especially in
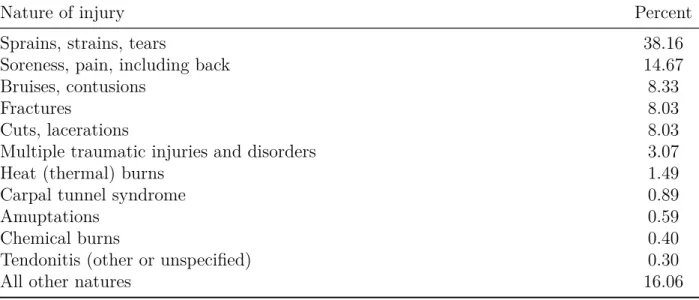
developed economies, many jobs remain inherently dangerous. Table I shows the percentage
of injuries in the U.S. in 2012 by different causes (Panel A) and types (Panel B) as reported
in the BLS’ annual news release on employer-related workplace injuries and illnesses. The
leading causes of workplace injuries are contact with objects, falls, and physical overexertion,
while the most common injury types are sprains, strains or tears, soreness and pain, bruises
9The question of who ultimately bears the cost of workplace injuries is complex and beyond the scope of
and contusions, cuts and lacerations, and fractures.
— Insert Table I here —
Firms expend resources on a variety of activities that reduce the risk of on-the-job injury.
Some of these activities involve capital expenditures on the acquisition and upkeep of
phys-ical assets involved in production. These activities include maintaining existing equipment,
replacing old and worn parts and machines, buying equipment with better safety features,
and automating dangerous tasks. The physical assets involved can include both
sophisti-cated machinery as well as simpler equipment. As an example of the latter, replacing steel
cable used for hoisting objects with (more expensive) synthetic fiber cable can reduce injury
risk by decreasing recoil and the incidence of sharp edges upon breakage.
Firms also expend managerial time, effort, and attention on less tangible activities that
reduce injury risk. These activities include devising and implementing policies and
proce-dures that promote safety, training and monitoring employees, and fostering a safety culture.
For example, lockout-tagout procedures prevent faulty machinery from being used until
prop-erly repaired.10 Alcoa introduced a forklift speed limit of four miles per hour on a production
floor to reduce the risk of collisions (Clark and Margolis, 2000). While such a policy may
seem mundane, the leading source of workplace injuries in 2012 was floors, walkways, and
ground surfaces.11 Such policies require effort to implement, monitor, and enforce. Many
plants create safety committees to devise safety improvements, though there is variation in
the amount of authority vested in these committees. Perhaps the biggest innovation in safety
management in the last few decades is the real-time, automated collection of data on a firm’s
production processes, which allows for real-time monitoring and expedites the mitigation of
potential hazards.
10Lockout procedures involve isolating and disabling power sources in dangerous machinery in a systematic,
step-by-step way. Tagout procedures ensure that only specific employees can unlock and untag a machine, ensuring that malfunctioning equipment is not accidentally brought back online before it is repaired.
While safety-related activities are implemented at the establishment level, they are driven
by firm-level decisions through budgetary and policy initiatives. An establishment may cut
spending on safety in order to meet short-run budgeted cost targets. Safety practitioners
with whom we spoke repeatedly mentioned that budget constraints were an important
im-pediment to implementing workplace safety measures. Anecdotally, the Chemical Safety
Board (CSB) blamed a catastrophic explosion at BP’s Texas City Refinery in 2005 that
killed 15 employees at least in part on an explicit decision not to replace a worn valve due
to corporate-level cost-cutting pressures.12 Firm-level policy initiatives include hiring safety
consultants to help improve safety practices, setting safety targets and holding managers
accountable for achieving them, and implementing a safety culture. As an extreme example,
Alcoa completely reorganized its entire operations around workplace safety in the 1990s.13
Improvements in workplace safety yield a number of important benefits for the firm.
These benefits include reduced workmen’s compensation premia and litigation costs. They
may also include reduced wages, as evidence suggests that employees demand compensation
for exposure to injury risk. Perhaps the most important benefits relate to increased
produc-tivity. An injured employee may be unable to return to work immediately or may operate
at reduced efficiency. 45% of workplace injuries in the U.S. result in at least one day away
from work, restricted work activity, or job transfer (BLS, 2015). Operations may be idled
while the cause of the injury is investigated and mitigated. Unsafe work conditions may also
lead to low employee morale, which can adversely affect productivity.
The benefits of improved workplace safety can be substantial. While these benefits are
difficult to quantify, Cohn and Wardlaw (2016) find a strong negative association between
firm value, as measured by Tobin’s Q, and firm-level injury rates. They estimate a reduction
in firm value of approximately $99,000 per additional workplace injury.
12Source: http://www.csb.gov/assets/1/19/CSBFinalReportBP.pdf.
13See DuPont case study on Norfolk Southern:
One important characteristic of the returns from efforts to improve workplace safety is
that they may take time to materialize. These efforts may necessitate comprehensive redesign
of workflow, equipment upgrades, and other steps that take time to implement. Employees
need time to adapt to new work routines and often initially resist safety-enhancing procedural
changes because of the extra effort required to abide by them (Clark and Margolis, 2000).
Even after such changes are successfully implemented, a period of learning and refinement
may be required before injury risk declines substantively. Finally, reduced injury risk yields
a stream of benefits over time. Thus, one should think of workplace safety as a long-term
asset.
1.2
Impact of PE buyouts on workplace safety
PE buyouts are typically accompanied by substantial changes in a firm’s operations. How
buyouts affect workplace safety depends on the nature of these operational changes. There
is considerable debate among researchers, policymakers, practitioners, and critics of the PE
industry about the nature of the changes buyouts engender in acquired firms’ operations.
However, there is little evidence on the subject to date.
A traditional view is that PE owners focus on cost-cutting in order to increase cash
flow. Facing pressure to cut costs, managers of portfolio companies may reduce spending
on activities such as maintenance, training, and supervision that enhance workplace safety.
Reductions in spending on these activities would compromise workplace safety, resulting in
increased injury risk.
Cuts to spending on safety-promoting activities after buyouts could reflect several
under-lying phenomena. Firms may overinvest in safety pre-buyout, in the sense that the marginal
shareholder return from investment in safety is negative. Such overinvestment could reflect
managerial altruism or preference for the quiet life, but may also represent the fulfillment of
safety. Jensen (1989) argues that the primary purpose of the traditional leveraged buyout
(LBO) structure is to prevent managers from making investments that destroy shareholder
value by committing the firm to disburse free cash flow to creditors. Critics of PE buyouts
argue that this cost-cutting imposes costs on non-financial stakeholders, whose interests
may not be accounted for in cost-cutting decisions. Such actions are consistent with the
argument that acquirers may expropriate rents from non-financial stakeholders by ignoring
implicit commitments previously made by a firm’s managers (Shleifer and Summers, 1988).
Taken to an extreme, PE owners may underinvest in workplace safety. If such behavior is
difficult to observe and the consequences take years to materialize, PE owners may be able
to sell a firm before the adverse financial impact of such underinvestment is realized. Of
course, a rational expectations-forming buyer who understands the incentives of PE owners
would discount the value of the firm accordingly. Nevertheless, if the behavior is unobserved,
PE owners could, in principle, still underinvest in safety in equilibrium.
A more modern view of PE buyouts — one that the PE industry itself promotes — is that
PE ownership results in fundamental improvements in a firm’s operations. Workplace safety
represents one dimension on which such improvements might occur. Mounting evidence
suggests that PE ownership is accompanied by increased productivity. However, the question
of why PE ownership might result in operating improvements remains largely unanswered.
Interviews with executives of firms acquired in PE buyouts, which we describe in detail
shortly, suggest that the patience of PE owners relative to public markets offers one plausible
explanation.
Public corporate executives face pressure from market participants to meet earnings
expectations and generate stock price increases. This pressure can bias executives towards
projects with short payoff horizons (Stein, 1988) and can cause an excessive pursuit of
high-visibility growth (Bebchuk and Stole, 1993). Baber et al. (1991), Roychowdhury (2006),
distort decisions towards those that improve operating metrics in the short run. Corporate
executives also state in surveys that they are willing to turn down positive NPV investments
if necessary to meet earnings expectations (Graham et al., 2005). Given the unglamorous,
long-term nature of investments in improving operating competencies, managers of firms
facing market pressure to meet earnings and growth expectations in the short run may
neglect such investments. A buyout, then, potentially allows for greater investment in these
competencies by alleviating the source of pressure on managers to behave myopically. It is
important to note that such an explanation applies to buyouts of public firms but not those
of already-private firms, which are not subject to market pressures pre-buyout.
Another view is that PE buyouts help to relax financing constraints and therefore address
an underinvestment problem. PE buyouts often result in the infusion of capital. Boucly et al.
(2011) present evidence that non-listed European firms increase growth rates substantially
after PE buyouts. Cohn et al. (2015) find similar increases in the U.S. Davis et al. (2014)
find evidence of expansion at the plant level after buyouts of non-listed firms. A relaxation
of financing constraints may allow a firm to increase investment in operating
competen-cies, including those that impact workplace safety. In theory, buyouts could relax financing
constraints in public firms. However, the evidence to date primarily links buyouts to the
relaxation of financing constraints in firms that are private pre-buyout, and these firms are
generally considered to have less access to capital then publicly-traded firms. Thus, changes
in injury rates after buyouts of private firms are likely to be more informative about any
impact of buyouts on workplace safety through the relaxation of financing constraints.
1.3
Summary of interviews with PE and target-firm executives
To gain further insights into how PE buyouts might affect the operations of acquired
firms, we interviewed several executives of PE buyout firms as well as firms acquired in PE
analysis. The firms span a broad array of sectors, including manufacturing, construction,
logistics, retail, and health services. Taken broadly, these discussions appear to validate a
lengthening of planning horizons as a plausible mechanism by which PE buyouts might lead
to improvements in operating competencies in general and workplace safety in particular.
One common refrain from the interviews was that operating changes after buyouts often
took the form of refocusing on core operations rather than dramatic changes in mission.
This refocusing effort is generally described as a combination of eliminating non-core
oper-ations, some of which were built up in a form of mission creep, and shifting more attention
to the reliability and efficiency of core operations. One executive characterized the changes
as “getting back to the basics” and focusing on the “boring stuff.” A number of the
execu-tives explicitly identified improvements in workplace safety as a specific plank in a broader
platform of core operational improvements. These executives typically pointed to the belief
that a safer work environment would allow the firm to contain labor costs in the long run as
the primary motive for efforts to improve safety. For example, a former PE executive in the
energy industry who is now with Total Safety, a safety consultancy, characterized the view
on improved workplace safety as follows: “Fewer compliance problems, less scrutiny from
regulators, sure, but the really good companies recognized that safe working environments
increase morale, decrease turnover, and impact wage negotiations.”
One commonly mentioned component of efforts to improve basic operational efficiency
after buyouts was an expansion of the set of metrics used to evaluate business unit-level
performance. This expansion of metrics was generally intended to provide PE owners and
managers with a more nuanced view of performance and a better understanding of where
to target efforts at improving efficiency. In some cases, workplace safety-related metrics
were explicitly added to the set of measures used to evaluate performance. Other commonly
implemented metrics relating to throughput, machinery uptime, and employee absenteeism
the formal introduction of “six sigma” management, a data-driven approach to eliminating
defects in the production process.
The introduction of more granular performance metrics after buyouts appears to be part
of a broader shift in focus from short-term profitability to long-term operational efficiency.
Several of the executives stated that PE buyers were willing to accept lower profitability in
the short-run if necessary to implement efficiency-enhancing changes, and that such changes
were often difficult to implement while a firm was still publicly-traded and subject to market
scrutiny. A former executive with Welsh, Carson, Anderson and Stowe, a large buyout
spe-cialist, suggested that “earnings were sometimes explicitly projected to go down for the first
two years after a buyout, reflecting investments that would drive up earnings and growth in
years four or five” and that “you don’t have that luxury in a public environment. You just
need a number of years to invest in these kinds of improvements,” referring to the in-depth
operational improvements targeted by the firm. Others described specific changes
imple-mented with a longer-run focus that were likely to incidentally reduce workplace injury risk,
even if this reduction may not have been the primary objective. For example, an
execu-tive with the PE firm Three Cities Research described introducing an employee-retention
scheme after the buyout of Garden Ridge Pottery, a home decor retailer, that reduced
an-nual employee turnover from 400% to 20%. More experienced employees may suffer fewer
on-the-job injuries because of better awareness of workplace hazards and greater familiarity
with equipment and machinery.
2
Data and Sample Construction
In this section, we describe the data that we use in the paper as well as the process
we use to match buyouts with establishment-level workplace injury data from the BLS’
establishments that we use to conduct difference-in-differences analysis.
2.1
Linking PE Buyouts to Workplace Safety Records
We obtain samples of public-firm PE buyouts from Cohn et al. (2014) and private-firm
buyouts from Cohn et al. (2015). These papers build samples of whole-firm buyouts
us-ing data from SDC Platinum and Dealogic, supplemented with news articles to remove
improperly classified transactions. Both samples consist of buyouts of non-bankrupt U.S.
“C” corporations with at least $10 million in assets.14 The public buyout sample contains
buyouts between 1995 and 2007, while the private buyout sample contains buyouts between
1995 and 2011.
The BLS conducts the SOII each year by collecting injury and illness data based on
Occupational Safety and Health Administration (OSHA) recordkeeping requirements. This
process involves gathering data for hundreds of thousands of establishments each year in a
stratified sampling process. Employers covered under the Occupational Safety and Health
Act and employers selected to be part of the BLS survey are required to maintain a log
recording any injuries “that result in death, loss of consciousness, days away from work,
re-stricted work activity or job transfer, or medical treatmentbeyondfirst aid.” These employers
must make their injury logs available to OSHA inspectors and supply the data contained in
the log to the BLS. The SOII is used primarily to produce aggregate statistics on the state
of occupational risk in various industries in the United States. Annual establishment-level
SOII data is available starting in 1996.
Each establishment in the SOII data has a unique identifier. Each establishment-year
record contains the establishment’s name, location, SIC code, number of injuries during the
year (Injuries), number of injuries resulting in days away from work, restricted activity, or
14The restriction to “C” corporations excludes “pass-through entities” such as limited partnerships (LPs),
job transfer (DART Injuries), average number of employees during the year (Employees),
and total number of hours worked (HoursW orked). We use this data to construct
an-nual measures of the injury rate at each establishment. Our primary injury rate measure
is Injuries/Employee, which is Injuries divided by Employees. We also construct the
measure DART Injuries/Employee, which is DART Injuries divided by Employees, and
which captures the rate of relatively serious injuries. Finally, we compute Log(Employees),
which is the natural log of an establishment’s reported average employment over the year,
and HoursW orked/Employee, which is HoursW orked divided by Employees. The only
firm-level identifier in the SOII data is the parent firm’s employer identification number
(EIN).
Because establishment-level BLS data is available starting in 1996, we consider only
buyouts taking place in 1997 and later. Because the public buyout sample ends in 2007,
we consider only buyouts taking place in 2007 and before in both the public- and
private-firm buyout samples for consistency. Thus, our buyout sample period is 1997–2007. This
period includes the buyout wave of the mid-2000s. Before merging the buyout data with
the BLS data, we remove buyouts of firms in the finance industry (12 public-firm buyouts
and four private-firm buyouts) or that engage in franchising (20 public-firm buyouts and
four private-firm buyouts). We make the latter determination by visiting company websites
and searching for other information on the Internet regarding franchising opportunities.
Removing franchisers is important because a franchiser may have limited control over the
operational practices of its franchisees.15 This process results in a starting sample of 285
public-firm buyouts and 547 private-firm buyouts.
We attempt to match each of these acquired firms to its establishments in the BLS
15Bernstein and Sheen (2016) compare restaurants owned by PE-backed firms and franchisees within the
injury data. For public-firm buyouts, we are able to use EINs from Compustat to match
some establishments in the BLS data to buyout firms. However, Compustat provides only
a single EIN, and different establishments belonging to the same firm may report different
EINs. An added challenge is that EINs are available in the BLS data only for the period
2002–2012. To address this limitation, we assign a parent firm to an establishment-year in
the 1996–2001 period if the establishment is matched to that parent firm based on EIN for
any year after 2001.
After identifying establishments of firms acquired in buyouts via EIN, we obtain
addi-tional matches by manually comparing each buyout firm’s name to establishment names in
the BLS data. In addition to looking for obvious matches, we use information from
corpo-rate websites, Bloomberg Business, and news articles to identify other names under which
a firm operates. If we cannot determine with near certainty that an establishment belongs
to a given buyout firm, we do not create the match. As Compustat generally only covers
publicly-traded firms, we do not have an EIN with which to match private firms acquired
in buyouts to BLS establishments. We therefore can only match these based on name.16
For simplicity, we refer to establishments in the BLS data belonging to PE-acquired firms
as “buyout establishments.” We are able to match 244 public firms and 316 private firms
acquired in PE buyouts to at least one establishment in the BLS data. We match 13,140
establishments in total to the 244 public firms and 2,051 establishments to the 316 private
firms.
Both the higher match rate of public-target firms and of establishments to these firms are
likely due to two causes. First, as noted, we can use a firm-level identifier in the matching
process only for public-target firms. For reference, we use EIN to match approximately
65% of the establishments that we are able to match to target firms. Second,
public-16The resulting link files for both public and private buyout establishments are stored at the BLS and can
target firms are generally larger than private-target firms and therefore generally have more
associated establishments that we can potentially match. We cannot investigate this second
potential cause further, as we lack independent data on the size of private-target firms.
2.2
Matched treatment and control sample formation
Our primary empirical strategy, described in Section 3, is a difference-in-differences
ap-proach. Specifically, we compare changes in injury rates at establishments of acquired firms
from the four years before to four years after buyouts to changes over the same period for
matched control establishments.
For each establishment belonging to each buyout target firm in our sample, we retain only
observations from yeart−4 through year t+ 4, where t is the year of the buyout. We then eliminate any establishment that is not present in the BLS data at least once in the period
from yeart−4 through t−1 and at least once in the period from year t+ 1 through t+ 4, as we observe no information about changes in injury rates from before to after the buyout
for these establishments. This requirement reduces the usable size of buyout establishments
considerably, to 1,437 establishments belonging to 152 unique public-target firms and 199
establishments belonging to 121 unique private-target firms.
This attrition is due mainly to the fact that the BLS samples a relatively small fraction
of establishments each year and does so without the intent of constructing a longitudinal
data set. The small size of the usable sample does raise some concerns about selection bias
and the degree to which our results can be generalized. The data collection methodology
used by the BLS tilts the survey towards establishments that are economically meaningful to
a given industry and size cohort. Additionally, the BLS more heavily samples industry-size
cohorts for which there is greater variation in injury rates. As a result, our sample may favor
larger firms and, to some degree, industries for which workplace safety protocols are more
For each buyout establishment, we form a pool of candidate control establishments.
These are establishments in the same 4-digit SIC code as the buyout establishment and that
are present in at least any year from t−4 through t+ 4 that the buyout establishment is present.17 We then choose as matched controls the five establishments from the candidate
pool with the smallest absolute differences in Log(Employees) in the last pre-buyout year
in the data, with the further restriction that the control’s Employees at that time must be
between 50% and 200% of the buyout establishment’s Employees. If the candidate pool
for a given buyout establishment has fewer than five potential matches, we choose all of the
establishments in the candidate pool as matched controls for that buyout establishment. The
set of all matched buyout and control establishments represents the sample we use to conduct
difference-in-differences analysis. We are able to match virtually all buyout establishments
to at least one control establishment.
In our main analysis, we restrict attention to buyout establishments (and their matched
controls) with at least 100 employees in the most recent pre-buyout year in the injury data.
Meaningful injury rates are difficult to calculate for small establishments because the inability
of an employee to suffer a fractional injury results in a preponderance of both zero and very
high injury rates for these establishments. This screen reduces the usable sample to 397
establishments belonging to 114 unique public-target firms and 108 establishments belonging
to 78 private-target firms (along with their matched control establishments). In a robustness
check, we relax the minimum threshold to 50 employees, which results in a usable sample
17To see how the requirement that control establishments appear in the injury data in at least the same
of 519 establishments belonging to 134 unique public-target firms and 152 establishments
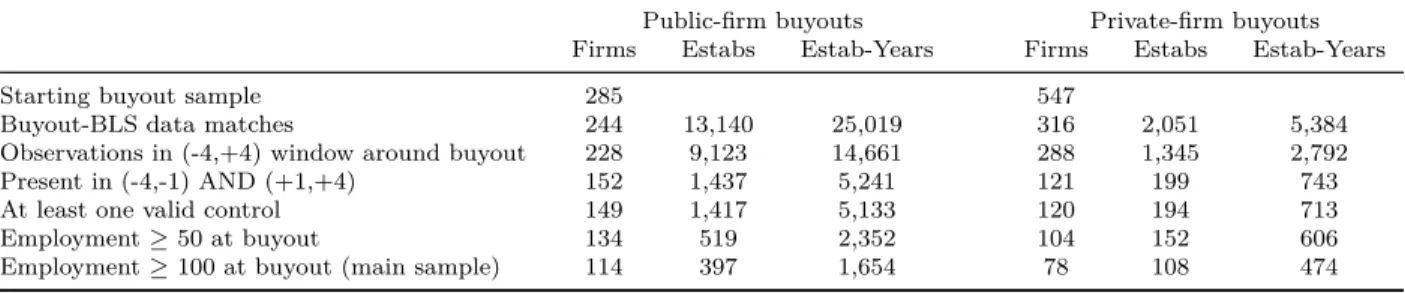
belonging to 104 unique private-target firms. Table 2 reports information about sample
formation.
— Table 2 here —
Panel A shows the number of firms, establishments, and establishment-years at each step
in the formation process. As noted, the primary cause of attrition is the requirement that
an establishment be present at least once in both the four-year window before and four-year
window after the buyout. We examine this issue further in Table 3, comparing our buyout
sample against the larger Compustat universe.
We necessarily make a number of choices when deciding how to construct the sample used
in the analysis we present in the paper. However, we also use several alternative approaches
to constructing the matched sample to ensure that the results we present are robust to various
approaches. These alternatives include matching establishments of publicly-traded firms only
to establishments of other publicly-traded firms, matching each buyout establishment to only
one control establishment instead of five, using propensity score matching to match based
on multiple establishment characteristics instead of just industry and size, and lowering the
minimum establishment size for inclusion in the sample from 100 to 50 employees. Appendix
A presents the difference-in-differences estimates that are the centerpiece of our analysis for
each of these different alternative samples. The estimates are all similar to those we obtain
using the main sample, which are presented in Section 4.
Panel B reports the number of establishments in the final sample matched based on
EIN and name. We match 64% of public target buyout establishments in the main sample
on the basis of EIN. Because we do not have an EIN for private buyout targets, 100% of
private target buyout establishments in the main sample are matched on the basis of name.
by year relative to the year of the buyout. Attrition in the post-buyout period appears fairly
minimal, somewhat allaying concerns about survivorship bias. Finally, Panel D reports the
number of control establishments for each buyout establishment in the sample. It shows
that most buyout establishments are matched to five control establishments (the maximum
number possible).
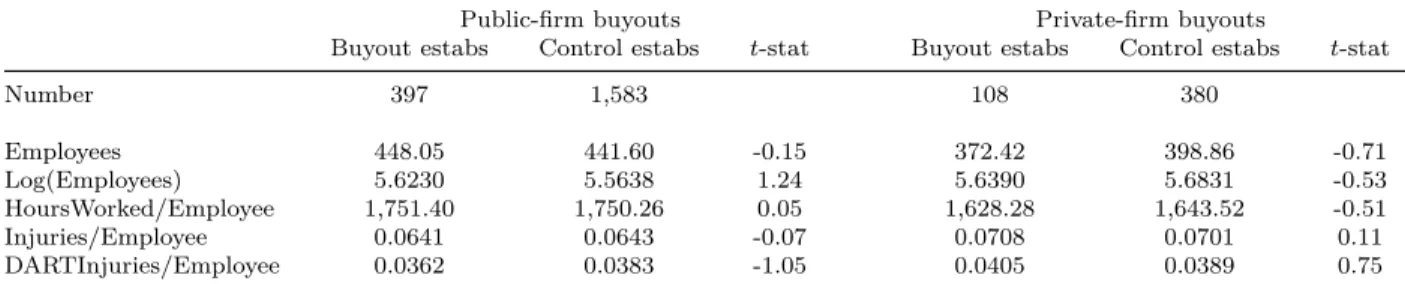
Table 3 provides summary statistics for the characteristics of the firms and establishments
in our final sample. Panel A reports means of several characteristics for the establishments
of firms acquired in PE buyouts and their matched control establishments. The buyout and
control samples are remarkably homogenous on all observable characteristics, despite the
fact that we match only on industry and establishment size. It does not appear that PE
acquirers select buyout targets based on characteristics such as a firm’s injury rate. While we
cannot rule out the possibility that buyout and control establishments vary on unobserved
dimensions, the homogeneity between treatment and control establishments provides some
assurance that the as-if random assignment assumption for valid difference-in-differences
estimation is likely satisfied.
— Table 3 here —
Panel B reports broad industry breakdowns of the establishments in the main sample
using the Fama and French (1997) five-industry categorization.18 Panel C reports financial
characteristics of public-firm buyout targets in the main sample, calculated using Compustat
data as of the last fiscal year-end prior to the buyout. For comparison, the means and medians
of these characteristics for the Compustat universe during the sample period are shown to
the right. Buyout firms in our sample tend to be significantly larger than Compustat firm
in terms of medians but slightly smaller in terms of means. They also tend to have lower
Tobin’s Q. On other dimensions, public-firm buyout targets are similar to Compustat firms
in general.
3
Empirical Methodology
We employ a standard difference-in-differences methodology to estimate changes in
establishment-level injury rates after PE buyouts relative to changes at control
establish-ments. Denoting establishment by i, year by t, and 4-digit SIC code industry by j, our
primary regression specification is the following:
InjuryRateit=αi+φjt+βP ostBuyoutt+γBuyoutF irmi∗P ostBuyoutit+it. (1)
We use Injuries/EmployeeandDART Injuries/Employeeas measures ofInjuryRate
in estimating equation (1). Angrist and Pischke (2008) caution against including potentially
endogenous regressors as controls when estimating difference-in-differences, as the inclusion
of such variables can lead to biased estimates. Thus, we do not include control variables
in (1). However, in the empirical analysis, we also estimate specifications of (1) where
we include Log(Employees) and HoursW orked/Employee as establishment-level controls.
These variables may help to explain injury rates and could therefore increase the precision
of the difference-in-differences estimates.
The indicator BuyoutF irm equals one for buyout establishments and zero for control
establishments. The indicatorP ostBuyoutequals zero for buyout and control establishment
observations in the four-year pre-buyout period and one for observations in the four-year
post-buyout period. We exclude establishment-year observations from the buyout year itself
because it is a blended year: The parent firm is independent part of the year and under PE
ownership part of the year. We include both establishment fixed effects (αi) and
industry-year fixed effects (φjt) to account for any unobserved time-invariant establishment factors
and time-varying industry factors that might impact injury rates. Because the buyout year
treatment effect itself. Note that the main effect of BuyoutF irm is not included because
it does not vary within establishment and is therefore absorbed by the establishment fixed
effects. The coefficient γ captures the estimated change in injury rate from before to after
a buyout for establishments of buyout firms relative to control establishments and is the
object of interest in the regressions.
While estimates of regression equation (1) capture the average change in injury rates
from the four years before to four years after a buyout, they do not indicate the timing of
these changes. We explore how injury rates evolve over time after buyouts in more detail by
estimating the following regression:
InjuryRateit =αi+φjt +
X
K∈(0,4)
βKP ostBuyoutY rKit
+ X
K∈(0,4)
γKBuyoutF irmi∗P ostBuyoutY rKit+it. (2)
This regression equation allows the difference in injury rates across buyout and control
establishments relative to the pre-buyout period to vary across each of the post-buyout
years. Here, K = 0,1,2,3,4 represents the number of years an observation occurs after the
buyout year, with K = 0 representing the buyout year itself. Unlike in estimating (1), we
include observations from the buyout year itself here as the regression specification allows
us to examine that year separately from other years in the post-buyout period. The γK
coefficients capture the change in injury rate from the pre-buyout period to post-buyout
year K and are the objects of interest.
One question of interest is how changes in workplace injury rates differ after buyouts
of publicly-traded and already-private firms. We assess these differences by estimating the
InjuryRateit =αi+φjt+βP ostBuyoutt+γBuyoutF irmi∗P ostBuyoutit
+θP ostBuyoutt∗W asP ublici
+λBuyoutF irmi∗P ostBuyoutit∗W asP ublici+it, (3)
where W asP ublic is an indicator taking a value of one for establishments in the matched
public-firm buyout sample and zero for observations in the matched private-firm buyout
sample. The coefficient λfrom this triple difference regression captures the change in injury
rates after public-firm buyouts (relative to controls) compared to the relative change after
private-firm buyouts.
Finally, to explore the causes of any changes in injury rates after buyouts, we examine
how these changes vary with several observable characteristics of the acquired firm, measured
prior to the time of the buyout. Our regressions take the following form:
InjuryRateit =αi +φjt+βP ostBuyoutt+γBuyoutF irmi∗P ostBuyoutit
+ηP ostBuyoutt∗Characteristici
+δBuyoutF irmi∗P ostBuyoutit∗Characteristici+it, (4)
where Characteristic is a firm- or transaction-level characteristic. The main effects of
BuyoutF irm and BuyoutF irm∗Characteristic are both fully absorbed by the establish-ment fixed effects αi and are therefore omitted from the regression equation. The coefficient
δ on the triple interaction term BuyoutF irm∗P ostBuyout∗Characteristic captures the cross-sectional variation of the change in injury rates with the given characteristic and is
equation (4) for the public buyout sample, as we do not generally observe firm-level
charac-teristics for private firms. We also estimate variants of (4) including Log(Employees) and
Hours/Employeeas control variables (see Appendix Table A5).
Our interviews with executives of firms acquired in PE buyouts suggest that alleviation of
market pressure to focus on short-term performance may lead to improvements in workplace
safety after buyouts. We consider four proxies for the extent to which a firm faces pressure
to focus on short-run performance. The first two are the fraction of a firm’s shares held by
institutional investors as a whole (AllInstHoldings), computed from Thomson 13(f) holdings
data, and by “transient” institutional investors more specifically (T ransientInstHoldings)
as identified by Bushee (1998). Transient investors are those that either have high portfolio
turnover or engage in momentum trading strategies. Bushee argues that managers face
less pressure to behave myopically when they have more institutional ownership in general
because these owners are ostensibly more “patient” than retail investors, but that transient
investors may apply more pressure to focus on short-term performance. Consistent with
these arguments, he presents evidence that firms with more overall institutional (transient)
ownership cut research and development spending less (more) in order to reverse an earnings
decline.
The third proxy for short-term pressure is the number of stock analysts covering a firm.
Greater analyst coverage is likely to focus more attention on the firm’s short-term financial
performance. We calculate the number of analysts issuing at least one earnings forecast
for a firm in a given year from the I/B/E/S earnings forecast database. We then create
an indicator variable HighAnalystCoverage, which equals one if at least six analysts (the
median number in the I/B/E/S universe) cover the firm and zero otherwise.
The fourth proxy is based on the firm’s earnings management practices. A firm facing
strong pressure to focus on short-term performance may engage in aggressive accounting
ac-counting aggressiveness — abnormal discretionary accruals as computed using the modified
“Jones” model (Dechow et al., 1995). We create an indicator variableP osAbnormalAccruals,
which equals one if abnormal accruals are positive and zero otherwise. While the first three
proxies are intended to capture characteristics influencing managers to focus on the short
run, the fourth proxy is intended to capture a response to such influence.
Another important characteristics of most PE buyouts is the use of debt added to the
target firm’s balance sheet to finance the transaction. Cohn and Wardlaw (2016) present
evidence that workplace injury rates increase with financial leverage in publicly-traded firms,
likely because high leverage limits the resources firms have available to devote to improving
workplace safety. We explore the impact of buyout leverage by settingCharacteristic in (4)
to LeveageChange— the change in the firm’s book debt-to-assets from the last fiscal year
end before to the first fiscal year end after the buyout, computed using data from Compustat.
Note that this variable is only available for buyout firms in Compustat the year after the
buyout, either because they have public bonds outstanding or because they subsequently
went public again and were required to publish financial statements covering the two years
before they did so.
A PE buyout may also be accompanied by management turnover. The replacement
of weak managers with better managers could improve operations and decrease workplace
injury risk. We examine this possible explanation for the fall in injury rates after public-firm
buyouts by setting Characteristic to CEOT urnover, an indicator variable equal to one if
the CEO was replaced at the time of the buyout and zero otherwise.
Finally, we consider two aspects of the acquiring group. The first is whether management
participates in the acquisition, which we measure with the indicator variable M gmtP artic.
The second is whether the buyout group includes a PE firm that specializes in buyouts
of publicly-traded firms. We measure this with the indicator variable F requentP EBuyer,
buyouts in our full buyout sample and zero otherwise.19
4
The Evolution of Injury Rates Around PE Buyouts
We begin our analysis by presenting a series of plots of injury rates at buyout and control
establishments in each year around the buyout year. We then turn to formal estimation based
on the methodology described in Section 3.
4.1
Graphical analysis of injury rates around buyouts
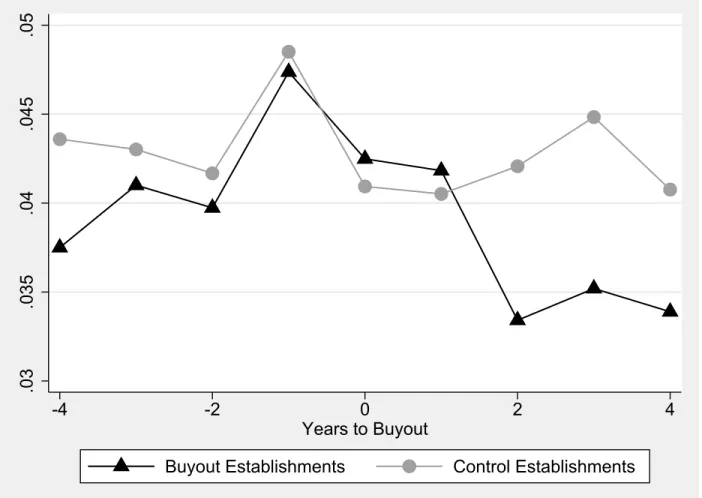
Figure 1 shows plots of mean injury rates for the public buyout sample. Figures 1a and 1b
plot meanInjuries/EmployeeandDART Injuries/Employee, respectively. Figures 2c and
1d plot industry-adjusted rates, where we first subtract the mean rate for all establishments
in the same year and 4-digit SIC code industry. The points in these latter two plots are
equivalent to the mean residuals from a regression of injury rates on industry-year fixed
effects.
— Figure 1 here —
The plots all show similar patterns. A comparison of pre-buyout injury rate trends
in buyout and control establishments reveals no obvious differences, suggesting that the
parallel trends assumption required for valid difference-in-differences estimation is likely to
be satisfied. The plots also show that injury rates for public-firm buyout establishments
fall below those of control establishments in the second year post-buyout and remain below
through the fourth year after the buyout. These patterns hold for both the overall injury
rate and the rate of more serious DART injuries. The patterns are consistent with injury
19PE buyers involved in at least six public-firm buyouts in our sample are KKR, Texas Pacific Group,
rates declining after public-firm buyouts with a short lag, as one would expect if operational
changes take time to implement and manifest in observable outcomes after buyouts.
Figure 2 shows the analogous plots for the private-firm buyout sample. These plots also
show no obvious differences in trends or levels of injury rates in the pre-buyout period across
buyout and control establishments. However, unlike the plots for the public buyout sample,
these plots also show no evidence of a change in injury rates (either upwards or downwards)
post-buyout. Thus, simple injury rate plots appear to support a decline in injury rates after
public- but not private-firm buyouts.
— Figure 2 here —
While these figures are suggestive, they do not account for other factors that may be
important drivers of injury risk. We next turn to formal estimation of the change in injury
rates around buyouts.
4.2
Difference-in-differences estimates
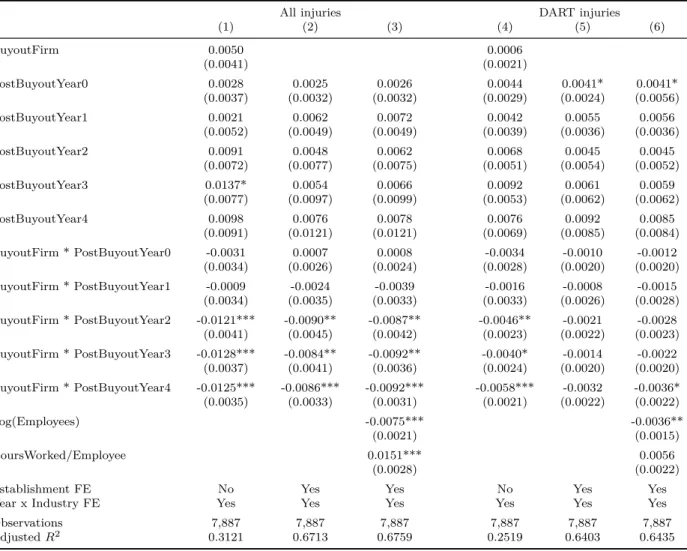
Table 4 presents estimates based on regression equation (1). Panel A presents estimates
for public-firm buyouts, while Panel B presents estimates for private-firm buyouts. Standard
errors clustered at the firm level are reported below each point estimate, both in this table
and in all of the remaining tables in the paper. The dependent variable in columns (1)
through (3) in each panel is Injuries/Employee. Column (1) reports estimates excluding
establishment fixed effects (industry-year fixed effects are included). This exclusion allows
us to estimate the main effect of BuyoutF irm. Columns (2) and (3) report estimates of
equation (1) with establishment fixed effects, excluding and including establishment-level
controls, respectively. Columns (4) through (6) present the same three regressions, where
the dependent variable is DART Injuries/Employee.
In Panel A, the small and statistically insignificant coefficients onBuyoutF irmin columns
(1) and (4) suggest no differences in pre-buyout injury rates in public-firm buyout and control
establishments. The statistically insignificant coefficients onP ostBuyoutin all columns
sug-gest that control establishments do not experience unexplained changes in injury rates from
before to after the buyout year. The negative coefficients on the interaction ofBuyoutF irm
and P ostBuyout in columns (1) through (3) support a decline in injury rates at buyout
establishments relative to control establishments after buyouts. The interaction coefficient
is statistically significant at the 5% or 1% level in all three regressions. The point estimates
indicate an average fall in injuries per employee of 10.3% to 14.5% relative to the pre-buyout
mean of 0.0641 for buyout establishments (see Table 3).
The coefficient on the interaction of BuyoutF irm and P ostBuyout is also statistically
significant in column (4), whereDART Injuries/Employeeis the dependent variable and no
establishment fixed effects are included. However, it is statistically insignificant in columns
(5) and (6). Because DART injuries represent only about half of total injuries, the power
to reject the null hypothesis of no change in injury rates is likely lower with this dependent
variable. We revisit the lack of statistical significance when we compare changes in injury
rates after buyouts of public and private firms in Table 6.
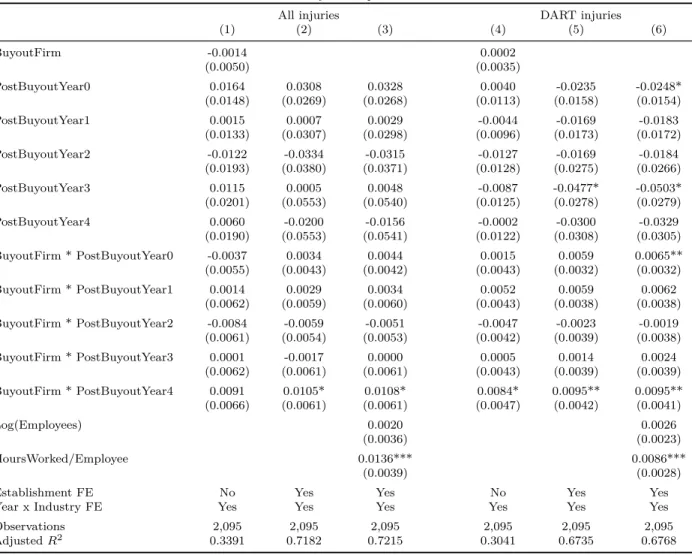
As in Panel A, the coefficients on the separate variables BuyoutF irmand P ostBuyout
lack statistical significance in the results in Panel B. However, unlike in Panel A, the
co-efficients on BuyoutF irm∗P ostBuyout are also small and statistically insignificant (and positive) in Panel B. Thus we fail to reject the null hypothesis that workplace injury rates
do not change after PE buyouts of already-private firms. One caveat is that the private-firm
buyout sample is much smaller than the public-firm buyout sample, which may limit the
statistical power of the tests conducted on the private-firm buyout sample. Reflecting this
difference, the standard errors of the estimates are generally somewhat larger in Panel B
4.3
Timing of changes in injury rates after buyouts
The results in Table 4 indicate a fall in injury rates after public-firm buyouts but do not
give any indication of the exact timing of the fall. As operational changes generally take time
to produce observable improvements in workplace safety outcomes, it would be surprising
if the fall takes place immediately after the buyout. Table 5 presents estimates based on
regression equation (2), with six specifications mirroring those of Table 4. Panel A presents
estimates for public-firm buyouts, and Panel B presents estimates for private-firm buyouts.
— Table 5 here —
The patterns here are consistent with those shown in Figure 1. The small, statistically
in-significant coefficients onBuyoutF irm∗P ostBuyoutY r0 andBuyoutF irm∗P ostBuyoutY r1 in Panel A indicate that injury rates in public-firm buyout establishments fall slightly, if at
all, relative to those of non-buyout establishments in the year of the buyout and the first year
after. The remaining interaction terms indicate that injury rates at acquired establishments
fall substantially below those of control establishments the second year after the buyout and
remain low through at least the fourth year after the buyout.
The coefficients on the BuyoutF irm∗P ostBuyoutY rK interactions in Panel B, where we examine buyouts of already-private firms, vary in sign and are generally statistically
insignificant. If anything, there is some indication of elevated injury rates the fourth year
post-buyout. However, it would be difficult to attribute an increase in injury rates with such
a long lag to the buyout itself.
4.4
Differences between public- and private- firm buyouts
The estimates presented in Tables 1 and 5 suggest that the response of injury rates to
a buyout differs depending on whether the acquired firm was public or private pre-buyout.
regression equation (3). Table 6 presents the results, with six specifications mirroring those
of Table 4.
— Table 6 here —
The coefficients on the triple interaction term BuyoutF irm∗P ostBuyout∗W asP ublic
are negative, large, and statistically significant at least at the ten percent level in all six
specifications. The differential response in workplace injury rates suggests that the
going-private aspect of a public-firm buyout may play a role in driving the observed decline in
injury rates after these transactions. It is worth noting that, even though we cannot reject
the null hypothesis that the change in DART injury rates is zero after public-firm buyouts
(Table 4, Panel A), we are able to reject the null hypothesis of no change relative to a
private-firm buyout benchmark based on the results in Table 6.
4.5
Cross-sectional Variation in the Decline in Injury Rates After
Public-Firm buyouts
The differential response in injury rates suggests that the decline in injury rates after
public-firm buyouts is linked in some way to going private. We seek further insight into
the underlying cause of this decline by examining variation in the drop in injury rates with
pre-buyout firm characteristics. Table 7 reports estimates of regression equation (4), using
the characteristics described in Section 2. Panel A reports estimates where the dependent
variable is Injuries/Employee. Panel B reports estimates where the dependent variable
is DART Injuries/Employee. Only the coefficients on BuyoutF irm∗ P ostBuyout and
BuyoutF irm∗P ostBuyout∗Characteristic are shown in the table for the sake of brevity.
As the results in columns (1) through (3) show, injury rates decline more after buyouts in
acquired establishments relative to non-buyout establishments when the firm has fewer
in-stitutional investors, more transient investors (holding fixed the overall level of inin-stitutional
ownership), more analyst coverage, and higher abnormal accruals pre-buyout. These results
support the hypothesis that the drop in injury rates after public-firm buyouts is at least
partly attributable to buyouts allowing firms to escape public-market pressure and hence to
focus more on long-term investment. It is worth noting that, while AllInstHoldings and
T ransientInstHoldings are highly correlated (correlation of 0.6387 in the sample) by
con-struction, and both are highly correlated withHighAnalystCoverage(correlations of 0.5785
and 0.4112, respectively), HighAbnormalAccruals is largely uncorrelated with the other
market pressure proxies (correlations of -0.0825, 0.0493, and -0.0275 with AllInstHoldings,
T ransientInstHoldings, and HighAnalystCoverage, respectively). These weak
correla-tions suggest that HighAbnrmalAccruals is picking up different information about
public-market pressure than the other variables.
The positive coefficients on the on the triple interaction with LeverageChange in both
panels suggests that a large increase in leverage as a result of the buyout may at least partly
offset any reduction in injury risk due to the buyout itself. These coefficients are
direction-ally consistent with the findings of Cohn and Wardlaw (2016). However, the coefficient is
statistically insignificant in Panel A and is only significant at the ten percent level in Panel
B. Thus, the evidence is too weak here to draw strong conclusions.
The coefficient on the triple interaction involving CEOT urnoveris positive in both
pan-els, though it is only statistically significant (at the five percent level) in Panel A. This
result appears at odds with an argument that buyouts produce improvements in workplace
safety through the replacement of ineffective management. Finally, the coefficients on the
triple interactions with M gmtP artic and F requentP EBuyer are all statistically
in injury risk after public-firm buyouts.
Overall, the results in this section such that injury rates decline significantly after
public-firm buyouts, and that this decline is linked to alleviation of pressure from markets to focus
on short-term performance.
5
Employment Dynamics After Buyouts
The analysis in this study focuses primarily on examining within-establishment changes
in injury rates after buyouts. To add further color to this analysis, this section investigates
employment dynamics around buyouts with two questions in mind. First, how does the
distribution of employment and work intensity change across establishments with differing
levels of injury risk? Second, how do changes in injury risk after buyouts vary with changes
in employment?
The results in Section 4 support a decrease in injury risk within establishment after
public-firm buyouts. However, post-buyout changes in the distribution of employment across
establishments with differing levels of injury risk could also impact overall levels of injury
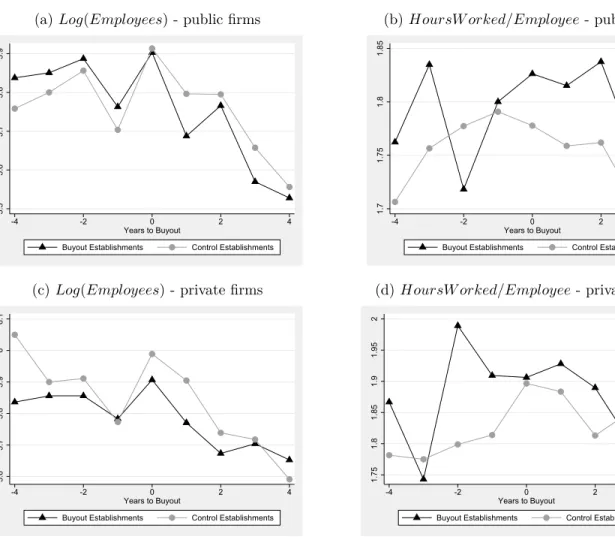
risk, as could changes in employee utilization. Figure 3 plots trends in employment and
employee utilization at buyout and control establishments in the years around the buyout.
Figure 3a plots Log(Employees) for the public buyout sample. This figure shows an
average decrease in employment after buyouts, consistent with the findings of Davis et al.
(2014) from analysis of census data. After declining over the first year after the buyout,
employment remains below control establishment levels for the three years after but exhibits
no further declines during these years. Figure 3b plots HoursW orked/Employee for the
public buyout sample. There are no consistent patterns here. Figures 3c and 3d show the
analogous figures for private-firm buyouts. There is no indication of a change in either
We test these changes more formally using the same difference-in-differences approach
described in Section 3. Table 8 presents this analysis. Panel A presents results for public-firm
buyouts, while Panel B presents results for private-firm buyouts.
— Figure 3 here —
We begin by simply estimating a variant of equation (1), substituting log(Employees)
for Injuries/Employee. Column (1) reports the results from this regression. In Panel A,
the coefficient on BuyoutF irm∗P ostBuyout, which is statistically significant at the one-percent level, implies a 13% average reduction in employment relative to pre-buyout levels.
This is consistent with the estimates of Davis et al. (2014). This similarity provides some
comfort that the sample of buyout establishment surveyed by the BLS is not too unusual.
We observe no fall in employment after private-firm buyouts in column (1) in Panel B.
— Table 8 here —
Next, we examine how the fall in employment after buyouts varies across establishments
with different levels of injury risk. We use two measure of this risk. The first is the injury
rate of the establishment in the final year reported before the buyout year. The second is the
average 4-digit SIC code injury rate over the sample period computed using all of the SOII
data. We then estimate regressions of the form of equation (4), setting Chararteristic to
each of these two measures. Columns (2) and (3) present the results. In Panel A, the positive
coefficients on both of the triple interaction terms (statistically significant at the one-percent
level) indicate that employment falls by less in relatively dangerous establishments than in
relatively safe establishments pre-buyout. The coefficients are also positive in Panel B but
are statistically insignificant.
Rather than being caused by specific jobs become safer, the overall fall in injury rates after