ENTRY INTO HIV MEDICAL CARE, RECEIPT OF CASE MANAGEMENT SERVICES, DEPRESSION, AND ART ADHERENCE AMONG ADULTS WITH HIV IN NORTH
CAROLINA
Damon Floyd Ogburn
A dissertation submitted to the faculty at the University of North Carolina at Chapel Hill in partial fulfillment of the requirements for the degree of Doctor of Philosophy in the Department
of Epidemiology in the Gillings School of Global Public Health.
Chapel Hill 2017
Approved by:
Victor J. Schoenbach Andrew Edmonds
Brian W. Pence Kimberly A. Powers
© 2017
ABSTRACT
Damon Floyd Ogburn: Entry into HIV medical care, receipt of case management services, depression, and ART adherence among adults with HIV in North Carolina
(Under the direction of Victor J. Schoenbach)
Engagement in HIV care is important for optimal clinical outcomes and reductions in transmission, particularly in Southern states. Delayed care initiation remains prevalent. While individual-level risk factors are established, barriers to prompt care initiation associated with characteristics of HIV testing facilities are not well defined. Upon care initiation, persons may benefit from the provision of case management services. Little has been published about whether case management services reduce depression or improve ART adherence.
We analyzed 2015 enhanced HIV/AIDS Reporting System data for North Carolina (NC) to estimate the cumulative incidence of persons initiating HIV care by time since diagnosis and in relation to (1) patient-level characteristics and (2) characteristics of the facility where HIV was diagnosed. Of 1,269 adults newly diagnosed in 2015, 84.9% were linked to care < three months from diagnosis; 63% initiated care within one month. Initiating care at ≥ three months was associated with younger age, IDU transmission, diagnosis at a site without co-located HIV care among males but not females, diagnosis at a facility with a higher diagnosis volume, and diagnosis at a sexually transmitted disease clinic (STD), HIV counseling and testing site, or a non-traditional testing facility setting such as a jail.
received case management services than among those who had not, though the adjusted
association was observed only among patients living above the poverty level. No differences in ART adherence were observed by receipt of case management services. Though ART adherence was high overall, depressed persons with HIV were less likely to be adherent.
I dedicate this dissertation research to my parents, Dr. and Mrs. Floyd and Trevia A. Ogburn, as well as my brother, Dr. Kenyon D. Ogburn.
To my relatives, gone yet not forgotten, thank you for your perseverance and sacrifice. Thank you for leading by example!
ACKNOWLEDGMENTS
The journey towards the completion of my doctoral work has been one of the most challenging, yet enriching experiences I’ve encountered thus far in my life. I am truly appreciative of the many opportunities, guidance, and obstacles that have promoted both personal and professional growth. First, I’d like to thank the following members of my dissertation committee for his/her invaluable insight in the development of my dissertation: Andrew Edmonds, Brian W. Pence, Kimberly A. Powers, and Becky L. White. I am grateful for their patience, guidance, and encouragement. I would like to particularly thank my advisor and dissertation committee chair, Vic Schoenbach, for his substantial contributions to my dissertation research. Dr. Schoenbach dedicated ample time not only as an advisor, but also as a counselor and coach, providing motivation and reassurance along every step of the process.
I would also like to thank members of the Division of Public Health, Communicable Disease Branch of the North Carolina Department of Health and Human Services. Erika Samoff, Mark Turner, Kearston Ingraham, Jenni Wheeler, Brad Wheeler, Nicole Adams, and Robert Winstead were instrumental with the acquisition of North Carolina, Medical Monitoring Project surveillance data for my analyses. Their invaluable guidance and time spent outside of
Within the UNC community, there are many individuals who provided academic support and/or always had their doors open to serve as counselors. I’d like to extend sincere gratitude to Chandra Caldwell, Nancy Colvin, Carmen Woody, Lisa Bradley, Valerie Hudock, and Jennifer Moore in the UNC Department of Epidemiology, as well as Charletta Sims Evans and Trinnette Cooper in the Office of Student Affairs, and Jeffrey Simms in the Department of Health Policy and Management. Felicia Mebane, former Dean in the Office of Student Affairs, has provided consistent encouragement and mentorship as well. I’d like to also thank those individuals responsible for the financial support provided by the NC Minority Presence Fellowship, the Suzanne Moulton and Thomas Wong Scholarship in Health Policy, Health Resources and
Services Administration, and the various research assistant positions held with GlaxoSmithKline and the UNC School of Medicine. My colleagues at the UNC School of Medicine were quite instrumental in providing moral support, and the experiences I had working with these persons in the community were invaluable. I’d also like to thank Chris Wiesen at The Odum Institute for his statistical computing expertise.
TABLE OF CONTENTS
LIST OF TABLES... x
LIST OF FIGURES ... xi
LIST OF ABBREVIATIONS ... xii
CHAPTER ONE: OVERVIEW ... 1
1.1 AIM 1 ... 3
1.2 AIM 2 ... 3
CHAPTER TWO: BACKGROUND AND SIGNIFICANCE ... 5
2.1 HIVEPIDEMIC IN THE SOUTHERN UNITED STATES ... 5
2.2 HIVPREVENTION STRATEGIES ... 7
2.3 THE HIVCARE CONTINUUM ... 9
2.5 HIV AND DEPRESSION ... 15
2.6 HIVCASE MANAGEMENT SERVICES ... 17
CHAPTER THREE: RESEARCH PLAN AND METHODS ... 21
3.1 STUDY DESIGN OVERVIEW ... 21
3.2 STUDY SETTING ... 22
3.3 STUDY POPULATION ... 24
3.4 DATA COLLECTION ... 25
3.5 SAMPLE WEIGHTS ... 28
3.6 ANALYTIC METHODS ... 28
3.6.1 Patient and facility characteristics and time to HIV medical care initiation (Aim 1) ... 28
CHAPTER FOUR: DELAYED INITIATION OF HIV MEDICAL CARE AND ASSOCIATED PATIENT AND FACILITY CHARACTERISTICS AMONG ADULTS NEWLY DIAGNOSED WITH HIV IN NORTH
CAROLINA ... 37
4.1 BACKGROUND ... 37
4.2 METHODS... 39
4.3 RESULTS ... 44
4.4 DISCUSSION ... 48
CHAPTER FIVE: DEPRESSION, ART ADHERENCE, AND RECEIPT OF CASE MANAGEMENT SERVICES BY ADULTS WITH HIV IN NORTH CAROLINA, MEDICAL MONITORING PROJECT, 2009-2013 ... 61
5.1 BACKGROUND ... 61
5.2 METHODS... 62
5.3 RESULTS ... 67
5.4 DISCUSSION ... 70
CHAPTER SIX: DISCUSSION ... 83
6.1 OVERVIEW ... 83
6.2 SUMMARY OF FINDINGS... 84
6.3 PUBLIC HEALTH SIGNIFICANCE... 87
6.4 FUTURE RESEARCH DIRECTIONS ... 89
LIST OF TABLES
Table 1 Studies examining delayed entry into HIV medical care ... 12 Table 2 Summary of North Carolina response rates, 2009-2013 ... 25 Table 3 Classification of exposure ... 30 Table 4 HIV medical care initiation by patient and facility characteristics,
2015 ... 53 Table 5 Patient and facility characteristics and delayed entry into
HIV medical care, 2015 ... 55 Table 6 Sociodemographic and behavioral characteristics of participants
in the North Carolina Medical Monitoring Project, 2009-2013 ... 74 Table 7 Probable current depression by sociodemographic and behavioral
characteristics, North Carolina Medical Monitoring Project,
2009-2013 ... 76 Table 8 100% ART adherence in the past three days by sociodemographic
and behavioral characteristics, North Carolina Medical Monitoring
Project, 2009-2013... 79 Table 9 Associations between utilization of case management services and
probable current depression, and 100% ART dose adherence, North
LIST OF FIGURES
Figure 1 The HIV care continuum ... 10 Figure 2 HIV care continuum among people with last known residence in
North Carolina, 2009-2013... 11 Figure 3 Medical Monitoring Project, multi-stage sampling design,
2009-2013 ... 23 Figure 4 North Carolina Medical Monitoring Project sampling schema by
year, 2009-2013 ... 24 Figure 5 Causal diagram of the relationship between the receipt of case
management services in the previous twelve months and probable,
current depression... 35 Figure 6 Causal diagram of the relationship between the receipt of case
management services in the previous twelve months and ART
dose adherence ... 36 Figure 7 Time to HIV medical care initiation by HIV medical care
co-location, 2015 ... 58 Figure 8 Time to HIV medical care initiation by testing facility HIV
diagnosis volume, 2015 ... 59 Figure 9 Time to HIV medical care initiation by testing facility type,
LIST OF ABBREVIATIONS
ADAP AIDS Assisted Drug Program
AETC AIDS Education and Training Center AIC Akaike information criterion
AIDS Acquired immune deficiency syndrome
aOR Adjusted odds ratio
aPR Adjusted prevalence ratio
aRR Adjusted relative risk
ART Antiretroviral therapy
ARTAS Antiretroviral Treatment Access Study
ARV Antiretroviral
CBO Community-based organization
CDC Centers for Disease Control and Prevention CES-D Center for Epidemiologic Studies-Depression
CI Confidence interval
DAG Directed acyclic graph
DHHS Department of Health and Human Services
DUA Data use agreement
eHARS enhanced HIV/AIDS Reporting System
ER Emergency room
HAART Highly Active Antiretroviral Therapy
HIV Human immunodeficiency virus
HR Hazard ratio
HRSA Health Resources and Services Administration
ID Identification
IDU Injection drug use
IRB Institutional review board MMP Medical Monitoring Project MRA Medical record abstraction
MSM Men who have sex with men
NC North Carolina
NHAS National HIV/AIDS Strategy
OR Odds ratio
PHQ-8 Patient Health Questionnaire (8 item)
PR Prevalence ratio
PrEP Pre-exposure prophylaxis PSU Primary sampling unit
RW Ryan White
STD Sexually transmitted disease
TB Tuberculosis
US United States
CHAPTER ONE: OVERVIEW
Interventions focused on persons living with the human immunodeficiency virus (HIV) are of great importance for reducing HIV comorbidities, improving clinical outcomes and survival, and preventing further transmission. Initial HIV prevention strategies focused on reductions in sexual partners,1 changes in sexual behaviors,1-3, increase in condom usage,2, 3 and abstinence.3 Although these behavioral approaches have been shown to be effective at reducing HIV transmission, the more recent “test-and-treat” strategy is much more powerful.4 Early HIV detection with prompt linkage to HIV medical care including initiation of and adherence to antiretroviral (ART) therapy dramatically reduces HIV transmission.4, 5
Despite widespread endorsement of the new strategy, failure to promptly initiate care upon initial detection is common, leading to ongoing HIV transmission and more rapid
progression to the acquired immune deficiency syndrome (AIDS) as defined by CD4 criteria.6 A meta-analysis of time to enter care between 1995 and 2009 found that 28% of HIV-positive people entered care more than 3 months after initial diagnosis.7 A study measuring access to HIV primary care in the St. Louis, MO area found that 10% to 20% of newly diagnosed individuals did not enter care even after three years following diagnosis.8 In Southern states
disproportionately affected by HIV, the prevalence of delayed linkage to HIV medical care among people living with HIV is not clear. Factors such as sex,9, 10 age,9-12 race,13-15
have demonstrated that initial HIV diagnosis at larger medical facilities in urban areas or at facilities with co-located HIV clinical care significantly decreased delayed entry into HIV medical care.10, 17-20 The type of facility at initial HIV diagnosis may also be a factor. In New York City surveillance data, patients diagnosed at a community testing site, city correctional system, and sexually transmitted disease (STD) or tuberculosis (TB) clinic were less likely to initiate HIV medical care within three months of initial diagnosis than patients diagnosed at sites with co-located medical care.20
Further along the HIV care continuum,21 according to a meta-analysis of 31 ART
adherence studies, only 55% of HIV-infected persons reached adequate levels of adherence upon initiation of and linkage to HIV medical care.22 ART adherence is essential to achieve good clinical and immunologic outcomes, particularly viral suppression.23-25 Given how crucial viral suppression is both to patient survival and also to preventing further transmission,6 it is also important to address any unmet needs that may compromise ART adherence and viral
suppression. Depression, the most prevalent psychiatric disorder among HIV-infected patients other than substance use disorders, has serious effects on a patient’s quality of life and course of illness.26 Numerous prospective and cross-sectional studies have demonstrated significant associations of depression or depressive symptoms with ART non-adherence and
persons with HIV who have initiated HIV care. HIV patients who were aware of their status but had not been retained in care within the past six months or never initiated care had lower mental health scores than persons who received some HIV care services, and did not have case
managers.35
The goal of the present research is to examine (1) potential patient and testing facility barriers to linkage to care, and (2) the use of HIV case management services in relation to HIV-related mental health and clinical outcomes. Using North Carolina (NC) data from two national surveillance databases – the enhanced HIV/AIDS Reporting System (eHARS, 2015) and the Medical Monitoring Project (MMP, 2009-2013) – we will address the following aims:
1.1 Aim 1
Specific Aim 1. Estimate the cumulative incidence of persons initiating HIV medical
care following diagnosis, examine patient-level sociodemographic and behavioral
characteristics associated with delay in initiating care, and assess time to care initiation in relation to characteristics of the facility where HIV was diagnosed.
1.2 Aim 2
Specific Aim 2. Estimate the prevalence of probable current depression and 100% ART
dose adherence in the past three days in relation to the receipt of case management services in the previous 12 months.
CHAPTER TWO: BACKGROUND AND SIGNIFICANCE
2.1 HIV Epidemic in the Southern United States
The Centers for Disease Control and Prevention (CDC) estimate that more than 1.2 million people living in the United States (US) are infected with HIV. Approximately 1 in 8 (~13%) HIV-infected persons are unaware of their HIV status.36 The number of incident cases remains stable at approximately 50,000 cases per year; however, several subpopulations are disproportionately affected. Blacks represent 12% of the U.S. population but accounted for approximately 44% of new HIV infections in 2010. Hispanics represent 16% of the population, but accounted for roughly 21% of incident infections in the same year. Approximately 62% of persons receiving an HIV diagnosis in 2011 were men who have sex with men (MSM).36 Young black MSM between the ages of 18 and 30 are at greatest risk for HIV infection.37
The District of Columbia and sixteen states that comprise the Southern region of the US carry a severe HIV burden.38 Six southern states (NC, South Carolina, Alabama, Georgia, Louisiana, Mississippi) – the Deep South39 – have similar HIV/AIDS epidemic profiles. The Deep South has a history of challenges including high STD rates, poor medical infrastructures, high poverty levels, and considerable numbers of persons lacking health insurance. Minority groups, particularly blacks, are disproportionately affected by these factors, which are related to the higher HIV/AIDS incidence rates observed in this region.39, 40
individuals were newly diagnosed, including 1,513 over 13 years of age, for an adult/adolescent incidence rate of 18.7 per 100,000/year.41 By 2015, the most recent year for which data are available, the number of adult/adolescent incident HIV cases diagnosed had decreased to 1,336, an HIV incidence rate of 15.9 per 100,000/year.42 Although incidence decreased, the high rates of undiagnosed and untreated HIV, along with aforementioned factors, enable ongoing HIV transmission. Moreover, 2015 adult/adolescent HIV incidence in NC continued to be much higher in the black population, with their share of new diagnoses nearly twice the percentage of blacks in the state’s adult/adolescent population.42
Challenges to removing barriers to HIV testing and treatment in NC, particularly among minorities, include historical factors specific to the Deep South. Two more commonly described challenges are poverty and rurality, which limit access to healthcare. Between 2009 and 2010, 19% of the 19-64 year old population was at or below the federal poverty line.43 Since NC has not adopted the Affordable Care Act’s Medicaid expansion, persons above the poverty line may have even greater difficulty accessing healthcare than the poor.44 In 2006, the CDC reported that NC had the highest rate of HIV and AIDS cases in rural areas.43 Since most HIV care
management is available only in urban areas, HIV-infected rural residents often travel significant distances to receive care.45 Rural communities often experience shortages of trained medical and mental health professionals,40, 46 lack of public and personal transportation,40, 46 lack of
knowledge regarding HIV prevention,46 and few systems of support and counseling for HIV-infected persons.45, 46 In addition, persons living with HIV in rural areas face greater stigma from community members than persons living in or near urban areas.39
testing, treatment initiation, and adherence, as well as potential facilitators including counseling and case management services, to assist NC HIV prevention strategists in fielding interventions that reduce transmission.
2.2 HIV Prevention Strategies
In 2003, the CDC along with other government agencies released guidelines for
incorporating HIV prevention into the medical care of HIV-infected persons. New and existing strategies such as risk screening, behavioral interventions, and partner notification and
counseling were suggested in these guidelines.47 In 2010, the US government created a plan known as the ‘The National HIV/AIDS Strategy’ (NHAS) with a goal of addressing the national HIV epidemic. Building on the strategies implemented in 2003, the Strategy has three main goals: reduce HIV incidence; increase access to care and optimize health outcomes for people living with HIV; and reduce HIV-related health disparities. In addition, the strategy set an overall goal of reducing HIV incidence by 25% by the year 2015.48 States with a high HIV burden, such as NC, and metropolitan cities serve as focal points, as described by specific action steps listed within the proposed strategy. In 2014, the federal government allotted a total of $29.5 billion towards combating HIV, with the majority (55%) for HIV care and the least amount (3%) for HIV prevention services.49
as lessons learned, contributed to ‘The National HIV/AIDS Strategy: Updated to 2020’ in 2015. This Strategy maintains the original plan of action outlined in 2010 with an additional goal of achieving a more coordinated national response to HIV. Emphasis is now placed on increasing testing; linking and retaining in care 85% of HIV-infected persons within one month of
diagnosis; and achieving viral suppression among 80% of persons living with HIV. In addition, the Strategy aims to increase access to pre-exposure prophylaxis (PrEP). A focus on
subpopulations with the highest rates remains key.50
In 2011 the landmark HIV Prevention Trials Network (HPTN) 052 phase III clinical trial assessing the effects of early initiation of antiretroviral (ARV) therapy on heterosexual HIV transmission among serodiscordant couples reported that immediate treatment reduced HIV transmission by 96%;51 efficacy was 93% at the trial’s conclusion in 2016. Among the 1,171 heterosexual couples with complete follow-up data, 78 HIV infections occurred. A total of 46 out of 78 infections were partner-linked. Approximately 93% (n=43) of these infections occurred among partnerships where the HIV-infected person delayed initiation of ART treatment.52, 53
Treatment as prevention has also evolved among persons at high risk of infection. The Pre-exposure Prophylaxis Initiative trial was an international study evaluating the efficacy and safety of once daily Truvada® for the prevention of HIV among men and transgender women who have sex with men. Truvada® was shown to provide 44% protection from HIV
acquisition.57 ARV prophylaxis for HIV prevention was also assessed among heterosexual partners. A randomized trial following 4,747 couples conducted in Kenya and Uganda reported a 67% relative reduction in the incidence of HIV among persons taking once-daily tenofovir and a 75% relative reduction in the incidence of HIV among persons taking Truvada®.58 Given the efficacy of PrEP, the Food and Drug Administration approved its use in July 2012. In 2014, clinical practice guidelines were released to assist clinicians with prescribing PrEP and providing additional resources to their patients.50
2.3 The HIV Care Continuum
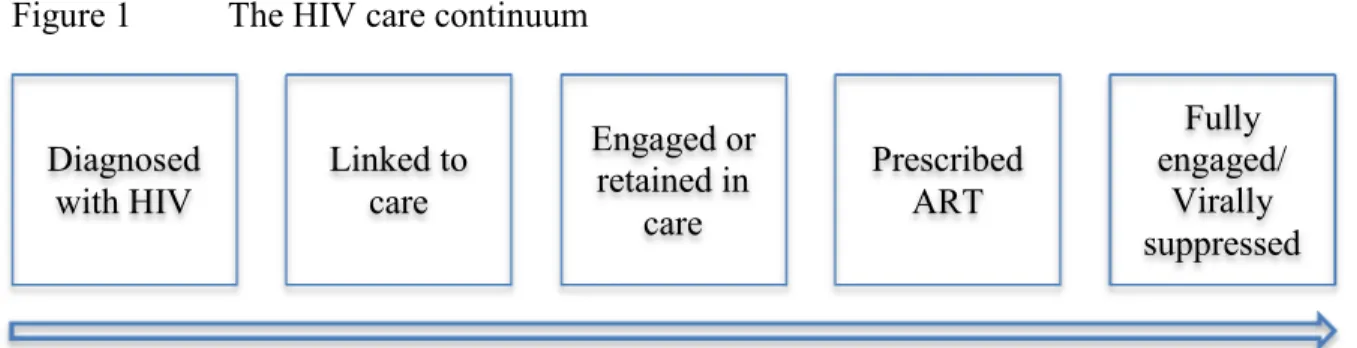
Effective test-and-treat HIV prevention strategies require identification and elimination of barriers along each step of the HIV care continuum, depicted in Figure 1. In 2013, President Obama and the White House administration established the HIV Care Continuum Initiative to accelerate progress towards this goal.49 Specifically, the administration identified the following points along the continuum as requiring the greatest improvements: 1) awareness of status, 2) linkage to care, 3) engagement in care and 4) viral suppression.50 With emphasis on the importance of the test-and-treat strategy, national testing efforts have increased. However, a large number of newly diagnosed, HIV-infected persons have already advanced to full blown AIDS by the time of diagnosis. High levels of viremia may lead to HIV comorbidities and increased likelihood of transmission to uninfected partners.51 It is important to identify
Figure 1 The HIV care continuum
(Adapted from Gardner et al. 2011)
Besides the delay in diagnosing HIV, there is also delay in care initiation after diagnosis. In the US, delayed entry into HIV medical care is common. An estimated 75% of newly
diagnosed persons initiate care six to twelve months after initial HIV diagnosis, while only 80%-90% link to care within three to five years.59 In NC some 30,000 cases of HIV have been
diagnosed and reported by the end of 2013 (Figure 2). Although the true number of persons seeking care was likely understated due to incomplete laboratory reporting, roughly half of these HIV-infected persons had one care visit during calendar year 2013. Approximately two-thirds of HIV-infected persons receiving at least one care visit in 2013 had a second visit three or more months later within the same year. In addition, viral suppression was documented for only 36.4% of the total cases.41
Diagnosed with HIV
Linked to care
Engaged or retained in
care
Prescribed ART
Fully engaged/
Figure 2 HIV care continuum among people with last known residence in North Carolina, 2009-2013
a2013 data are overestimated due to reporting delays for death information
bLegend: year shown refers to the year in which care measures were evaluated; cases were diagnosed and reported between the beginning of the epidemic and the end of the prior year.
Source: 2013 North Carolina HIV/STD Epidemiologic Profile
In 2015, additional data sources were available to measure points along the HIV care continuum in NC, including Ryan White (RW) service data, CAREWare, laboratory claims from Medicaid, and ARV medications dispensed from the AIDS Drug Assistance Program (ADAP) and Medicaid.60 Of an estimated 35,700 persons living with HIV infection in NC in 2015, 32,130 (90%) were diagnosed and reported though 2014. Approximately 71% of those diagnosed and reported had at least one care marker (e.g., viral load (VL), CD4) in a year, and 59% were virally suppressed.60 While these percentages were an improvement from previous estimates, barriers along each point of the continuum prevent many HIV-infected persons from ultimately achieving viral suppression.
2.4 Delayed Entry into HIV Medical Care
An estimated 17% to 29% of HIV-infected individuals do not enter care within six months of initial HIV diagnosis or initial clinic appointment (Table 1). The estimates vary on the basis of sample design and the defined time to entry to care.7, 9, 10, 14, 16, 19, 20, 61 One prospective, five-year surveillance study conducted in St. Louis, Missouri reported that only 73% of newly diagnosed persons had evidence of an HIV primary care visit from 1998-2002.8 Based on surveillance data for New York City residents diagnosed in 2003, 63.7% of newly diagnosed, HIV-infected persons initiated care within three months of diagnosis.20 A study conducted in New York City using MMP surveillance data from 2007-2008 reported that among 513 persons in HIV care at the time of interview, 23% had entered care more than three months after initial diagnosis.10
Table 1 Studies examining delayed entry into HIV medical care
Source Sample Design Sample % Delayed
> 3 months delayed entry into HIV care since baseline
Turner et al. (Arch Intern Med, 2000) national probability sample of persons in care
n = 1540, diagnosed by 02/93 and in care ≤ 3 years
29%
Turner et al. (Arch Intern Med, 2000) national probability sample of persons in care
n = 1960, diagnosed by 02/95 and in care ≤ 1 year
17%
Torian et al. (Arch Intern Med, 2008) New York City surveillance data
n = 1,928 19%
Reed et al. (AIDS Patient Care STDS, 2009) US facility and population-based surveillance data
n = 3,942 28%
Jenness et al. (AIDS Care, 2012) national probability sample of persons in care
n = 513 23%
> 4 months delayed entry into HIV care since baseline
Marks et al. (AIDS, 2010) meta-analysis n = 6,586 28% > 6 months delayed entry into HIV care since baseline
Turner et al. (Arch Intern Med, 2000) national probability sample of persons in care
n = 1540, diagnosed by 02/93 and in care ≤ 3 years
21%
> 12 months to delayed entry into HIV care since baseline
Gay et al. (AIDS, 2006) convenience sample n = 348 (note: 37% initiated care at least once
prior to study)
The Supplement to HIV/AIDS Surveillance Project was a cross-sectional interview study designed to collect behavioral data from adults with HIV, most of whom had entered HIV care, in 18 states from 2000-2004. Among 3,942 respondents, 28% had delayed entry to care defined as three months or longer after initial diagnosis.16 The Antiretroviral Treatment Access Study (ARTAS) examined time to care among recently diagnosed, HIV-infected persons in Atlanta, Baltimore, Los Angeles, and Miami. Only 60% of patients who received passive referrals to care linked to care within six months of initial diagnosis.12 One cross-sectional study among patients living in NC initiating HIV medical care between 2000 and 2003 at the University of North Carolina HIV outpatient clinic reported that 32% of patients did not initiate care for at least one year after initial diagnosis.9
Factors associated with delayed entry into care include minority race14, 15, injection drug use,16 unemployment,16 travel distance to care,13 lacking private health insurance,14-16 initial detection in a nonmedical environment,20 and scheduling lag, defined as the time from the call to schedule a first patient visit to the appointment date.14 Factors commonly identified as associated with difficulties in accessing HIV care in NC include rural residence, stigma, lack of
transportation, and relatively few HIV-trained practitioners.40 Race/ethnicity13 and even laws and healthcare policies specific to some Southern states are relatively frequent barriers as well.62
Overall, though, little has been published detailing the relation of these patient characteristics, as well as of testing facility factors, to delayed entry to HIV medical care. In other areas of healthcare, co-location of medical services has been found to be significantly associated with more effective service delivery and better outcomes, which could have important implications for HIV linkage to care programs. One study examined no-show rates in
health care was provided at a location separate from the primary care physician. Co-located care was provided in the same location as the primary care physician. Results showed that, among Medicaid patients, no-show rates for the co-located care group were significantly lower than for the coordinated care group (p = 0.001), which has important implications for integrating services into the offices of physicians, particularly for vulnerable populations.63 A randomized trial assessed the efficacy of an integrated model of primary medical care for veterans with severe mental disorders. The integrated medical care clinic provided patients with on-site primary care as well as case management with collaboration from mental health providers. Researchers found that patients treated in the integrated care clinic were significantly more likely to have made a primary care visit, had greater average number of primary care visits, and had a significantly greater improvement in health as measured by a 36-Item Short-Form Health Survey.64
With regard to linkage to HIV medical care, The ARTAS-I was a CDC sponsored, two-arm randomized controlled trial comparing a brief strengths-based case management intervention with standard-of-care referral in linking recently diagnosed, HIV-infected persons to care. Due to successful, timely entry in the arm receiving case management services, ARTAS-II was funded to evaluate the same model in local and health state departments and community-based
organizations (CBOs). Researchers used data from the ARTAS-II project, site visits, and project director reports to examine factors associated with timely linkage to HIV medical care. From October 2004 – June 2007, ARTAS-II obtained structural factor data from ten health
Most research examining testing facility characteristics and time to entry into HIV
medical care has assessed linkage models at large medical facilities or emergency departments in larger cities often co-located with HIV testing facilities. The rates of linkage to care within three months were often greater than 80-85%.17, 18 However, even in large cities, initial diagnosis at sites in nonmedical environments (versus medical environments)10 or sites without co-located HIV care (versus sites with co-located HIV care) was associated with delayed entry to care [community testing site (hazard ratio [HR], 1.9; 95% confidence interval [CI], 1.5-2.3); city jail (HR, 1.6; 95% CI, 1.2-2.0); STD/TB clinic (HR, 1.3; 95% CI, 1.1-1.6)].20
Notwithstanding the advantages of testing in facilities which have HIV medical care onsite, it is also important to consider how testing sites without co-located HIV medical care can facilitate patient initiation of care, since such sites detect many cases of HIV that would
otherwise have gone undetected. This phenomenon is particularly relevant in resource-limited settings where access to medical care can be problematic, and a great need for general testing services remains. Thus, additional research is needed to assess the impact of various testing facility types on delayed entry into care in urban and rural settings in southern states such as NC and with a focus on subpopulations experiencing the highest rates of new HIV infections.
2.5 HIV and Depression
Once an HIV-infected person is engaged in care, it is crucial to address unmet needs that can compromise patient adherence and achievement of viral suppression. Depression, the most prevalent psychiatric disorder among HIV-infected patients after substance use disorders, has important implications for patient retention and quality of life.26 Chander et al. reviewed
estimates of depression among HIV-infected persons engaged in care range from 20% - 30%.66 These estimates are at least twice those of general population national depression prevalence estimates, which range from 4% - 7% based on data from the Behavioral Risk Factor
Surveillance System.67, 68 A 2014 study using national surveillance data for HIV-infected persons in care reported a 12.4% prevalence of major depression (95% CI, 11.2-13.7) and a 13.2%
prevalence of other depression (95% CI, 12.0-14.4).68
Numerous prospective and cross-sectional studies have examined associations of depression or depressive symptoms with ART adherence, viral load, and immunological outcomes. A nested cohort analysis of 873 HIV-infected men in the Multicenter AIDS Cohort Study examined predictors and effects of highly active antiretroviral therapy (HAART) interruption and discontinuation. Approximately 28% of the study population was depressed, based on a Center for Epidemiologic Studies Depression (CES-D) Scale score greater than 15. Depression was significantly associated with HAART interruption [(adjusted odds ratio (aOR), 1.97; 95% CI, 1.38-2.80)] and HAART discontinuation (aOR, 1.42; 95% CI, 1.17-1.72).25 A prospective study of 961 HIV-infected women participating in the Women’s Interagency HIV Study examined the associations of race, sociodemographic, and behavioral characteristics with response to HAART. Approximately 50% of the women were classified as depressed (CES-D >16) at their last pre-HAART visit. Depression was found to be significantly associated with poorer virologic response (aOR, 0.81) and increased likelihood of immunologic failure (aOR, 1.98). In addition, depression was significantly associated with a higher risk of all-cause death, unrelated to AIDS (aOR, 1.65).30
prevalence of 47%. Researchers found that depression was significantly associated with increased odds of virological failure (aOR, 2.09; 95% CI, 1.19-3.68).23 A study of 1910 HIV-infected patients reported that the 16% of patients with depression, measured using the
Composite International Diagnostic Interview, were significantly more likely to be non-adherent to ART medication during the week prior to interview in comparison to patients who were not classified as depressed.29
Given empirical evidence of associations of depression with non-adherence and immunological failure, treatment of depression may improve outcomes among HIV-infected persons. A retrospective cohort study of HIV-infected persons who received clinical services from Denver Health reported lower antiretroviral adherence among depressed patients not on antidepressant treatment compared to depressed patients on antidepressants (P = 0.012).69
However, antidepressant non-adherence and concurrent substance abuse can obstruct the efficacy of antidepressants.26 Additional studies assessing the association between antidepressants and ART adherence are needed, particularly among subpopulations with higher HIV prevalence. In addition, more approaches to alleviating mental illness should be explored.
2.6 HIV Case Management Services
One potential resource for facilitating treatment of depression among HIV-infected persons is case management. Case management, as defined by the Commission for Case
Manager Certification, is a ‘collaborative process that assesses, plans, implements, coordinates, monitors and evaluates the options and services required to meet the client’s health and human service needs’.70 A clear need for case management services persists among HIV-infected
Ontario, Canada. Results showed that depression was common (54.2%), and associated with a diminished health status. Depressed, HIV-infected persons used significantly more community-based service organizations and crises centers. Findings suggested that caseworkers and service organizations could improve access to medications as well as quality of life for HIV-infected persons.71
The majority of studies examining case management services among HIV-infected persons assessed the impact of these services on linkage to care, unmet needs, utilization of ART medications, or clinical outcome indicators unrelated to mental health. In a 2005 study, recently diagnosed participants in the ARTAS study were randomized to either standard of care passive referral or case management for linkage to local HIV clinics. The study reported that a higher proportion of participants in the case-managed study arm (N=136) visited an HIV clinician in comparison to those in the standard of care arm (N=137) at least once within six months (78% vs. 60%; adjusted relative risk (aRR), 1.36; P = 0.0005, one-tail) and at least twice within twelve months (64% vs. 49%; aRR 1.41; P = 0.006, one-tail).12 A 2001 study assessed the efficacy of case managers on unmet needs and on utilization of medical care and ART medications among a national probability sample of HIV-infected persons (N=2437). Contact with a case manager at baseline was significantly associated with decreased unmet need for income assistance [odds ratio (OR), 0.54; 95% CI, 0.36-0.91], health insurance (OR, 0.54; 95% CI, 0.33-0.89), home health care (OR, 0.29; 95% CI, 0.15-0.56), and emotional counseling (OR, 0.62; 95% CI, 0.41-0.94) at follow-up. In addition, contact with a case manager was associated with higher
In a cross-sectional study of 1133 HIV-infected individuals identified through outreach programs who knew their status and were not newly diagnosed, 12% had not received HIV medical care in the six months prior to the interview. In multivariable analyses, those with no care were less likely to have a case manager (p < 0.001) or use mental health services (p < .001), and had poorer mental health scores (p < 0.05).35 The ARTAS-II recruited HIV-infected persons from ten study sites in the US. Five sessions with a case manager were scheduled over a 90-day period. HIV-infected persons who had two-five sessions with a case manager were significantly more likely to engage in HIV care compared to those who had fewer than two sessions.19
A 2013 study assessed linkage, retention in care, and viral suppression among newly diagnosed and prevalent HIV-infected persons identified from the District of Columbia Department of Health, which funds facilities to provide HIV case management. HIV-infected persons receiving care in facilities funded to provide case management were significantly more likely to be retained in care (aOR, 4.13; 95% CI, 1.93-8.85) than HIV-infected persons receiving care in facilities not funded to provide case management, though similarly likely to be virally suppressed (aOR, 1.06; 95% CI, 0.68-1.62).73 In another study, the health service utilization of 72 subjects receiving directly administered HAART was analyzed for its effect on viral load at six-months. In adjusted multivariable analyses, case management services were significantly associated with virologic suppression at six months (aOR, 5.8; 95% CI, 1.1-30.5, P = 0.04).32
Given the clinical benefits of case management services, it is essential that case
training, and insufficient knowledge of HIV/AIDS and medications. Without appropriate training and resources, case managers may negatively affect client adherence, which may directly affect the client’s mental and clinical outcomes.74
Further research on the various stages of the HIV continuum of care, including the potential benefits of case management services on management of depression and ART adherence, is desirable, particularly in Southern states experiencing a multitude of barriers to HIV medical care and higher incidence in subpopulations. NC has an integrated surveillance system with multiple programs collaborating to maximize disease prevention and treatment efforts. Educational guidelines for health professionals are established through the NC AIDS Education and Training Center (AETC) Program. Led by HIV clinical experts equipped to provide local training and education, this program was established by the Department of Health and Human Services (DHHS) and the Health Resources and Services Administration (HRSA). Clinicians receive technical and clinical information on services, such as PrEP, which is
CHAPTER THREE: RESEARCH PLAN AND METHODS
3.1 Study Design Overview
The two specific aims for this dissertation research are:
Specific Aim 1. Estimate the cumulative incidence of persons initiating HIV medical
care following diagnosis, examine patient-level sociodemographic and behavioral
characteristics associated with delay in initiating care, and assess time to care initiation in relation to characteristics of the facility where HIV was diagnosed.
Specific Aim 2. Estimate the prevalence of probable current depression and 100% ART
dose adherence in the past three days in relation to case management utilization in the previous twelve months.
Both aims were accomplished by analyzing NC data included in national surveillance systems developed by the US CDC.
For Aim 1 we analyzed population-based, surveillance data from the 2015 eHARS, a system developed by the CDC to enable states to collect and update sociodemographic and clinical data on HIV-infected persons. The state of NC requires named reporting of all HIV and AIDS diagnoses, all viral load and CD4 cell count values, all positive Western blot tests for HIV antibody, and all HIV genotypes.76, 77 Information on the type of testing facility at initial
For Aim 2 we analyzed data for 2009-2013 from the NC MMP. The MMP is a
surveillance system designed to capture behavioral and clinical data from HIV-infected persons who have at least one HIV medical care visit during the survey window each year. MMP data are gathered from personal interviews with sampled patients and from abstraction of medical records
3.2 Study Setting
The NC Division of Public Health’s Communicable Disease Branch uses eHARS to monitor all persons either diagnosed with HIV in NC or diagnosed with HIV in another state and now living in NC. The state-run, population registry maintains risk factor information,
HIV/AIDS diagnosis dates, residence at diagnosis, and testing site, for regular surveillance reporting to the CDC. Selected laboratory values, including CD4 cell counts <200 cells/mm3 and detectable viral loads, are also reported in eHARS.
Figure 3 Medical Monitoring Project, multi-stage sampling design, 2009-2013
Participating project areas include sixteen states (California, Delaware, Florida, Georgia, Illinois, Indiana, Michigan, Mississippi, New Jersey, New York, NC, Oregon, Pennsylvania, Texas, Virginia, and Washington), six separately funded large metropolitan areas (Chicago, Houston, Los Angeles County, New York City, Philadelphia, and San Francisco) within five of the sampled states, and Puerto Rico.68, 79 A facility sampling frame is developed in each of the 26 project areas. An eligible facility provides HIV medical care, which is defined as having
providers who prescribe antiretroviral therapy or order CD4 or HIV viral load tests. Only
providers who manage their own patients’ HIV medical care are included in the facility sampling frame. Patients are then sampled from each facility with a third-stage sampling probability. Each patient sample is used for only one data collection cycle, with a new sample of patients drawn from participating facilities in each data collection cycle.79 For our research, we will only be utilizing MMP surveillance data from the state of NC.
Stage 1: State/Territory ("Site") Population: All U.S. States, D.C., Puerto Rico
Sample: 23 project areas (16 states, 6 separately-funded metropolitan areas, Puerto Rico)
Stage 2: Facility (Provider)
Population: Facilities providing HIV care in sampled state - large and small, public and private Sample: ~40-60 facilities per project area
Stage 3: Patient
Population: HIV-infected adults ≥ 18 years of age who received care at a sampled facility between January and the end of April
3.3 Study Population
The study population for Aim 1 was drawn from all HIV-infected persons at least 18 years of age, residing in NC and alive as of December 31, 2015 as recorded in eHARS.
The study population for Aim 2 was drawn from respondents to the 2009-2013 MMP questionnaires. Respondents for each MMP annual data collection cycle were sampled to be representative of HIV-infected adults at least 18 years old, who had at least one medical care visit at a NC participating facility between January and April in a data collection year. The three-stage sampling schema within NC for each year is provided below (Figure 4). While patients with complete interview and medical record abstraction (MRA) data were sampled, we only used interview data. Our MMP 2009-2013 analytical sample included a total of 910 respondents 18 years of age or older – 602 males (67.2%), 297 females (31.3%), 10 transgender persons (1.3%), and 1 intersex person (0.1%).
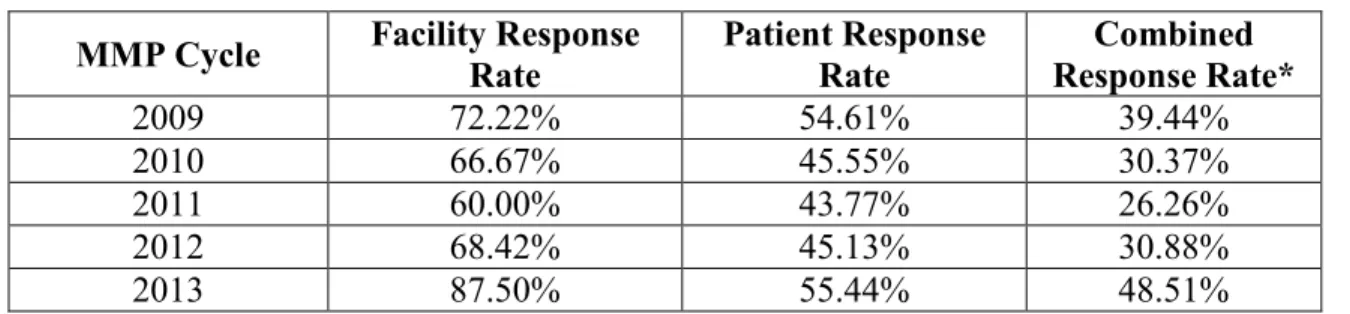
For each data collection year, the response rates among facilities and among patients in those facilities, adjusted for eligibility, were provided in the MMP response rate summary reports (Table 2). The facility response rate was calculated using the total number of eligible responding facilities and the total number of sampled participating eligible facilities. The adjusted patient response rate was calculated using the total number of sampled patients with overlapped interview data and MRA data, adjusted for eligibility. Although the response rates were lower than optimal, empirical research suggests that low response rates are not necessarily the result of nonresponse bias, particularly when probabilistic samples are drawn from well- constructed sampling frames.81, 82
Table 2 Summary of North Carolina response rates, 2009-2013
MMP Cycle Facility Response
Rate
Patient Response Rate
Combined Response Rate*
2009 72.22% 54.61% 39.44%
2010 66.67% 45.55% 30.37%
2011 60.00% 43.77% 26.26%
2012 68.42% 45.13% 30.88%
2013 87.50% 55.44% 48.51%
* = Facility response rate times patient response rate
Response rates provided by 2009-2013 MMP Response Rate Summary Reports83
3.4 Data Collection
enhanced HIV/AIDS Reporting System (eHARS)
Medical Monitoring Project (MMP) Questionnaire
The most updated version of the MMP questionnaire used in our analyses had twelve sections. The first section (I) included participant identification (ID), facility ID, and the type and date of the interview. The next section (D) covered participant demographic characteristics such as type of residence, age, gender, education status, sexual orientation, and health insurance status. Participants were then asked to provide feedback on access to care (section A), including HIV testing and care experiences, sources of care, and met and unmet needs. The next section (R) gathered information on stigma and discrimination; quite often, HIV-infected individuals experiencing stigma and discrimination have difficulty taking prescribed HIV treatment medication and remaining adherent, which were ascertained in section T.
The largest portion of the questionnaire (section S) gathered information regarding sexual behaviors, including number of sex partners and types of sexual activity. In section U
respondents reported on cigarette and alcohol use, non-injection drug use, and injection drug use. Section B assessed transmission risk factors, including questions about how participants may have acquired HIV and about their past partners’ behaviors.
Sections P and M gathered information regarding prevention activities and depression, respectively. Depression was measured by asking the participant questions about his/her overall mood using the eight-item Patient Health Questionnaire depression scale (PHQ-8). This scale has been established as a valid diagnostic measure for depressive disorders in large population-based studies.84
pregnancies and pregnancy outcomes. Specific health condition and preventive therapy questions included CD4 and VL dates, vaccination history and STD testing and diagnoses. An additional interview completion portion of the questionnaire (section E) confirmed respondent
compensation, reassured confidentiality, and assessed the interviewer’s confidence in the validity of the respondent’s answers.
Medical Record Abstraction (MRA) – MMP Data
Though MRA data was not used in our analyses, these data were obtained from the medical charts of study participants with completed interview data to form an overlap dataset. In general, the MRA data gather the following information on respondents: patient demographics, a comprehensive medical history to include disease diagnoses and surgical histories, AIDS
defining opportunistic illnesses, prophylaxis, hepatitis/toxoplasma/tuberculosis screening, immunizations, antiretroviral therapy, laboratory test results, HIV antiretroviral resistance testing, substance abuse, and mental health with an additional field for clinical notes and remarks.
Data Acquisition and Approval
The CDC have determined that MMP is a public health surveillance activity.85 Because eHARS and MMP are not considered research, they are not subject to human subjects
regulations including federal institutional review board (IRB review).86 Funding for the MMP in NC was provided by a cooperative agreement (PS09-937) from the CDC. This doctoral
dissertation does require oversight by the IRB at the University of North Carolina at Chapel Hill. The IRB determined that the dissertation research was exempt from full review because it is an activity using de-identified, secondary data conducted for public health purposes (IRB Review #: 14-2675).
3.5 Sample Weights
The MMP data were collected using a complex, multi-stage sampling scheme, which requires special analytical procedures.87-91 Unequal selection probabilities, which necessitated weighted analysis, and appropriate methods for variance estimation were employed. The MMP-provided sample project area weights (pa_wgt_over), which adjust for nonresponse, and project area strata (pa_strat) and cluster (pa_clust) variables, which account for the design complexity, were applied to univariable, bivariable, and multivariable analyses using SAS 9.4, Cary, NC.
3.6 Analytic Methods
3.6.1 Patient and facility characteristics and time to HIV medical care initiation (Aim 1)
Measurements
Outcome: Time to initiation of HIV medical care was defined as the number of calendar days from the date of initial HIV diagnosis (‘Day 0’) to the date of the first CD4 or VL
VL data ≥ three months since the date of HIV diagnosis (or no evidence of care) versus an earlier date.
Exposure: Patient-level characteristics. In relation to time to HIV care initiation, we examined age at initial HIV diagnosis (categorized at approximate quartiles: 17-24 years, 25-30 years, 31-44 years, and 45+ years), sex at birth (male, female), and race/ethnicity (non-Hispanic white, non-Hispanic black, and Hispanic/other). Due to small sample sizes, HIV-infected persons identifying as American Indian/Alaskan Native, Asian, Native Hawaiian/Pacific Islander, and multi-race were included in the Hispanic/other category. The following CDC hierarchical HIV transmission exposure categories were analyzed in relation to care initiation: MSM, injection drug use (IDU; including MSM/IDU), heterosexual transmission, and unknown HIV exposure.
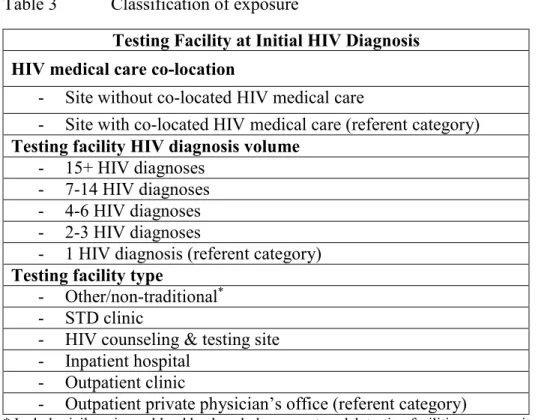
Facility-level characteristics. We examined time to initiation of HIV care in relation to three characteristics of the facility at which the HIV diagnosis was made: whether HIV medical care was available at the facility (co-located HIV medical care), the total number of HIV diagnoses reported from the testing facility in 2015 (facility diagnosis volume, categorized at approximate quintiles), and a six-category version of the facility type code from eHARS. Descriptions of the strata of each facility characteristic are provided in Table 3.
Table 3 Classification of exposure
Testing Facility at Initial HIV Diagnosis HIV medical care co-location
- Site without co-located HIV medical care
- Site with co-located HIV medical care (referent category) Testing facility HIV diagnosis volume
- 15+ HIV diagnoses - 7-14 HIV diagnoses - 4-6 HIV diagnoses - 2-3 HIV diagnoses
- 1 HIV diagnosis (referent category) Testing facility type
- Other/non-traditional* - STD clinic
- HIV counseling & testing site - Inpatient hospital
- Outpatient clinic
- Outpatient private physician’s office (referent category)
* Includes jails, prisons, blood bank and plasma centers, lab testing facilities, community centers, social service organizations, military processing centers, and university student health centers.
Data Analysis
full (main effects + interaction) models, where the model with the smaller AIC value was determined to have the better fit. This procedure indicated that including an interaction between sex and co-location of medical care improved model fit.
We then used multivariable unconditional logistic regression with a backward elimination modeling strategy with Wald chi-squared test p < 0.10 for retention to identify patient and
facility risk factors independently associated with delayed entry into HIV medical care. The adjusted coefficients for facility volume displayed a clear dose-response relationship, so we elected to retain that variable despite its p-value of 0.25. Thus, all coefficients for patient and facility characteristics were adjusted simultaneously for the other characteristics, in a single multivariable, logistic regression model that included an interaction term for sex at birth with HIV co-location.
The Kaplan-Meier non-parametric product limit estimator was used to estimate the cumulative incidence of HIV care initiation according to days since HIV diagnosis. Persons either initiated care or were censored at the end of the date range for the data (June 15, 2016). The graphs of the cumulative incidence of HIV care initiation were stratified by testing facility characteristics: HIV care co-location, facility HIV diagnosis volume, and testing facility type. Facility HIV diagnosis volume was collapsed into low-volume (1-3 HIV diagnoses), medium-volume (4-14 HIV diagnoses), and high-medium-volume (15+ HIV diagnoses) categories.
Of 1,269 participants, 14.1% (N=179) were diagnosed in a hospital as inpatients, and approximately 3.0% (N=33) had an initial HIV diagnosis occur in the emergency room (ER). Because some have argued that CD4/VL testing performed during an acute hospitalization or ER visit may not represent true HIV care initiation,92 we conducted a sensitivity analysis that
NC). The IRB at the University of North Carolina at Chapel Hill determined that these analyses of data collected for public health surveillance purposes were exempt from full review (IRB # 14-2675).
3.6.2 HIV Case Management Utilization and Depression (Aim 2)
Measurements
Outcome: Depression was identified from responses on the PHQ-8.84 The PHQ-8 assigns a score for the number of days in the previous two weeks that the respondent experienced each of the eight criteria for depression from the Diagnostic and Statistical Manual of Mental Disorders, fourth edition (DSM-IV).93 Probable, current depression (we combined major with other) was defined based on Kroenke and Spitzer’s 2002 algorithm of experiencing at least two depressive symptoms for “more than half the days” in the preceding two weeks, with at least one symptom being depressed mood or anhedonia. This diagnostic algorithm yields comparable judgments to a total PHQ-8 score of ≥ 10, which we also examined.84, 94
The prevalence of self-reported 100% ART dose adherence in the past three days was estimated using AIDS Clinical Trials Group measures.95 ART dose was defined as either a single tablet or multiple tablets taken concurrently. At the time of interview, participants were asked, “In the past three days, were you 100% dose adherent to your ART medicine?” If the respondent missed part of a dose, they were instructed to report that incident as a missed dose. HIV-infected participants were recorded as either 100% ART dose adherent or not 100% ART dose adherent in the past 72 hours. We also analyzed the MMP question about ART schedule adherence.
Additional covariates: Various characteristics were considered as potential correlates and/or effect measure modifiers of the associations between utilization of case management services in the previous twelve months and 1) probable current depression, and 2) 100% ART dose adherence in the past three days. Sociodemographic risk factors included age at interview (18-29, 30-39, 40-49, ≥ 50 years), gender (male, female, transgender/intersex), race/ethnicity (non-Hispanic white, non-Hispanic black, Hispanic/Latino, other), sexual orientation
(heterosexual, homosexual, bisexual, other/unclassified), education (< high school, high school or equivalent, > high school), yearly household income ($0-$19,999, $20,000-$39,999, $40,000-$74,999, ≥ $75,000), federal poverty level (living at or below, versus above, the poverty level, defined per 2012 standards using household income and size),96 and health insurance (public or private, RW/ADAP only, uninsured). Because NC has many rural areas requiring long travel distances to visit medical providers, we examined the need for transportation assistance services in the previous twelve months (yes/no). Behavioral risk factors examined included alcohol consumption in the previous twelve months and current smoking status (yes/no).
Data Analysis
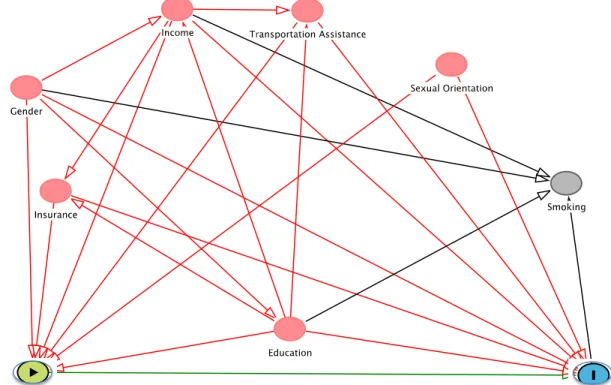
Effect measure modification was examined for each variable using a product interaction term and an adjusted Wald test with a 0.15 significance level. Potential confounders of the relation between case management utilization and probable current depression (Figure 5), as well as ART dose adherence (Figure 6), were selected a priori from literature and with the use of a directed acyclic graph (DAG). Adjusted PRs and 95% CIs were calculated using multivariable Poisson models with robust variance to account for violations of the distribution assumptions. We assessed possible collinearity among variables using variation inflation factors; no
collinearity was noted. Analyses were performed using Stata version 14 (StataCorp, College Station, TX) and SAS 9.4 (SAS Institute, Cary, NC). Except where noted, all analyses
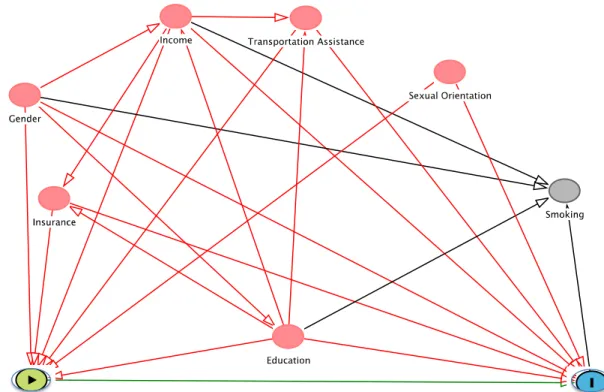
Figure 5 Causal diagram of the relationship between the receipt of case management services in the previous twelve months and probable, current depression
Figure 6 Causal diagram of the relationship between the receipt of case management services in the previous twelve months and ART dose adherence
CHAPTER FOUR: DELAYED INITIATION OF HIV MEDICAL CARE AND ASSOCIATED PATIENT AND FACILITY CHARACTERISTICS AMONG ADULTS
NEWLY DIAGNOSED WITH HIV IN NORTH CAROLINA
4.1 Background
Approximately 1.2 million people in the US were living with HIV as of 2015.37 Although new HIV diagnoses declined 19% between 2005 and 2014,37 incidence rates remain high among MSM (67% of incident cases), non-Hispanic blacks (45% of incident cases), Hispanics/Latinos (24% of incident cases), and residents of the South (HIV incidence 16.8 per 100,000 persons). Incidence rates (per 100,000 people) in the Northeast, West, and Midwest are lower at 11.6, 9.8, and 7.6, respectively.37, 97
The NHAS: Updated to 2020 outlines strategic initiatives to prevent the spread of HIV. First put forward in 2010, the main goals of the Strategy are to improve the national response to the epidemic by reducing new HIV infections, increasing access to care while optimizing health outcomes, and reducing HIV-related health disparities and inequities.50, 98 Given persistent transmission among specific demographic and geographic subpopulations despite increases in HIV testing rates, the 2020 update emphasizes improving key components of the HIV care continuum, namely timely initiation of HIV medical care upon diagnosis, prescription of and adherence to ART, retention in care, and achievement of viral suppression.21, 50
and poor medical infrastructures,39, 40, 62 racial disparities,62, 99 limitations in access to care due to lack of health insurance,62 and few systems of support and counseling.45 By 2013, NC met the 2015 NHAS goal of increasing HIV testing (ever tested) by four percentage points, from 44.2% to 48.4%.100 Timely initiation of HIV care, with ART, significantly reduces the rate of HIV transmission 51 and also maximizes the benefits of treatment for the patient.98
Several studies have assessed delay in initiating HIV care following HIV diagnosis.7, 9, 10, 16, 20, 61 These studies have used various time intervals following initial HIV diagnosis
(commonly three, six, and twelve months) and study populations, including patients identified from public health surveillance in US cities and national probability samples of persons in care, to examine patient and testing facility characteristics as potential correlates of delayed care initiation. Patient-level characteristics associated with a delay (entry into HIV care three or more months after initial diagnosis) include male gender;16 black,61 Latino,61 and non-white race;20 younger age;10 IDU;10, 20 MSM and IDU HIV transmission exposure modes;16 unemployment;16 and birth outside of the US.20 The national ARTAS-II project reported that persons diagnosed at HIV testing sites with co-located HIV care services entered HIV care significantly earlier than persons diagnosed at sites without co-located care.101 In New York City, persons diagnosed at a community testing site,20 city correctional system,20 STD or tuberculosis clinic,20 or a non-medical facility10 initiated HIV care later than persons diagnosed at a facility with co-located medical care.
There are no statewide studies of delayed initiation of HIV care within the Southern US, a region plagued by poor health indicators and disproportionately affected by the HIV
persons initiating HIV care according to time since diagnosis, to examine patient-level
sociodemographic and behavioral characteristics associated with delay in initiating care, and to assess time to care initiation in relation to characteristics of the facility where HIV was
diagnosed.
4.2 Methods
enhanced HIV/AIDS Reporting System (eHARS)
eHARS is a surveillance system developed by the CDC to enable states to collect and update sociodemographic and clinical data on persons living with HIV. The NC Division of Public Health’s Communicable Disease Branch maintains the NC eHARS. According to NC General Statute 130A, all clinicians or persons in charge of laboratories are required to report a HIV diagnosis to the local health director/health department within 24 hours.76 Laboratory results from tests to determine the absolute and relative counts for the T-helper (CD4) subset of lymphocytes and all results from tests to determine HIV VL are also required to be reported (10A NCAC 41A.0101 section b4).77 The Branch uses eHARS to maintain statistics on all persons either diagnosed with HIV in NC or diagnosed with HIV in another state and currently residing in NC. eHARS stores sociodemographic, geographic, and HIV transmission risk data as well as clinical laboratory testing dates and values.
Study Population
meeting our inclusion criteria (age ≥18, NC residence through end of 2015). We excluded three patients missing information on key facility-level variables, leaving 1,269 persons.
eHARS contains the date of each person’s initial, Western-blot confirmed HIV diagnosis. Reporting guidelines specify that the diagnosis date is the date that the specimen for an
individual’s first positive HIV test result was drawn.102 The dataset also included the dates of the earliest and most recent CD4 counts and VL measurements through June 10, 2016. The earliest CD4 or VL measurement was treated as the person’s date of HIV care initiation. In the final dataset, 94 patients lacked any CD4 or VL measurement and were treated as having not entered care as of June 15, 2016 and censored on this date.
Individual-level characteristics
We examined age at initial HIV diagnosis (categorized into approximate quartiles: 17-24 years, 25-30 years, 31-44 years, and 45+ years), sex at birth (male, female), and race/ethnicity (non-Hispanic white, non-Hispanic black, and Hispanic/other). Due to small counts, persons with HIV identifying as American Indian/Alaskan Native, Asian, Native Hawaiian/Pacific Islander, and multi-race were included in the Hispanic/other category. The following CDC hierarchical HIV transmission categories were utilized: MSM, IDU (including MSM/IDU), heterosexual, and unknown.
Facility Characteristics
Testing Facility with Co-located HIV Care
Co-located HIV care was defined as the presence of an onsite HIV medical provider who prescribed ART. Testing facilities in NC with co-located HIV care were identified using the NC ONE CALL HIV Provider Directory, which lists all licensed HIV medical providers and
associated medical groups in the state by county. ONE CALL was developed in 2013 through a partnership between the Division of Infectious Diseases at the University of North Carolina at Chapel Hill School of Medicine and the Communicable Disease Branch of the NC Division of Public Health.103 By matching the names of testing facilities in the eHARS dataset with the ONE
CALL provider directory, we coded all eligible persons in terms of whether their initial HIV diagnosis was made at a testing facility with co-located HIV medical care.
Testing Facility HIV Diagnosis Volume
The annual HIV diagnosis volume for each eligible person’s testing facility at HIV diagnosis was categorized according to approximate quintiles: 1 HIV diagnosis, 2-3 HIV diagnoses, 4-6 HIV diagnoses, 7-14 HIV diagnoses, and 15+ HIV diagnoses.
Testing Facility Type at Initial HIV Diagnosis
HIV testing facilities are assigned one of twenty-six codes in eHARS according to organizational and institutional characteristics. For our analyses, on the basis of these codes, we created six categories: (1) “Private physician’s offices” included licensed medical physicians and medical groups providing general or specialty medical care to ambulatory patients; (2) “STD clinics,” typically housed in county health departments, provided testing and treatment, or referrals for treatment, specifically for STDs; (3) “HIV counseling and testing sites,”
(4) “Inpatient hospitals” included all NC hospitals providing inpatient medical care;
(5) “Outpatient clinics” were facilities providing general or specialty medical care to ambulatory patients, including hospitals’ outpatient services, Departments of Veteran Affairs, and
freestanding urgent care and medical centers; and (6) “Other” (or “Non-traditional testing facilities”) included all other facilities from which positive tests were reported, such as jails and prisons, blood bank and plasma centers, lab testing facilities, community centers, social service organizations, military processing centers, and university student health centers. Our “Other” facility type included the eHARS “Other” category as well as other facility types with fewer than 50 reported patients.
Time to Initiation of and Delayed Entry into HIV Medical Care
Time to initiation of HIV care was defined as the number of calendar days from the date of HIV diagnosis (‘Day 0’) to the date of the first CD4 or VL measurement. We estimated the cumulative incidence of care initiation at various time points and, consistent with earlier
studies,10, 16, 20, 61 focused on delayed initiation defined as a first CD4 or VL ≥ three months since the date of HIV diagnosis (or no evidence of care initiation).
Statistical Analysis