VALUE CREATION IN PROXIMITY TO U.S. LIGHT RAIL TRANSIT STATIONS
William Leslie Bishop
A dissertation submitted to the faculty at the University of North Carolina at Chapel Hill in partial fulfillment of the requirements for the Doctor of Philosophy degree
in the Department of City and Regional Planning.
Chapel Hill 2018
© 2018
ABSTRACT
William L. Bishop: Value Creation in Proximity to U.S. Light Rail Transit Stations (Under the direction of Roberto G. Quercia, Ph.D.)
A quasi-experimental, longitudinal spatial difference-in-differences, design is
employed to estimate differential rates of assessed value creation over time in proximity to light rail transit (LRT) stations. Over the 10-year period from 2005 through 2015, total assessed valuation within ½ mile (but non-overlapping) transit areas of influence (TAIs) surrounding 229 stations, located along 21 light rail transit lines within 14 U.S. transit systems, increased at an average annually compounded rate of 3.13% faster than within surrounding control/comparison areas between 1-mile and 2-miles from stations. Differential rates of assessed value creation varied significantly both within and between transit systems.
Under an alternative definition of treatment areas (wherein all folios within the TAI were counted and attributed to treatment, whether or not treatment areas overlapped) , total assessed valuation within ½ mile (but non-overlapping) transit areas of influence (TAIs) surrounding 22- stations within 13 U.S. transit systems, increased at an average annually compounded rate of 3.21% faster than within surrounding control/comparison areas between 1-mile and 2-1-miles from stations, or a total of 63% over the period. Differential rates of assessed value creation varied significantly both within and between transit systems.
Unique contributions of this work include quantification of actual differential rates of aggregate annual value creation over time within areas proximate to U.S. light rail transit
marginal willingness to pay for amenities such as proximity to transit. The comprehensive nature of the database studied has allowed identification of significant variation in market responsiveness across metropolitan regions as well as within single light rail corridors This variation underscores the importance of individual market and submarket characteristics including timing.
ACKNOWLEDGEMENTS
This dissertation was made possible in large part through the indulgence and extraordinary accommodation of my committee members Professors Nikhil Kaza, Noreen McDonald, Roberto G. Quercia, and Yan Song within the Department of City and Regional Planning at the University of North Carolina at Chapel Hill, and Professor Daniel Rodríguez with the University of California at Berkeley, College of Environmental Design. I owe particular gratitude to my academic advisor, Roberto G. Quercia, for his patience, encouragement, and excellent and extensive academic mentorship.
The geographic information systems (GIS) components of this work could not have been accomplished without the extraordinary effort, diligence, and perseverance of Phillip McDaniel, GIS Librarian, Matthew Jansen, Data Analyst, and Hannah Reckhow, MCRP Candidate and Claire Nelson, Student GIS Consultant, who assisted them. The GIS team, associated with the Davis Library at the University of North Carolina at Chapel Hill, worked above and beyond the call of duty and exceeded all expectations in assisting on this project.
Director of System Planning & Development, Houston METRORail; Brandon M. Farley,
Transportation Planning Manager V, Los Angeles County Metropolitan Transportation
Authority; John Dillery, Senior Transit Planner, Minneapolis Metro Transit; Ray Amoruso,
Chief Planning and Development Officer, The Tide – Hampton Roads Transit, Norfolk; Tracey
Foster, Director of Real Estate, San Diego; Joshua Matthews, Planner II, Valley Metro, Phoenix, Eric Hesse, Strategic Planning Coordinator, TriMet, Portland; Levi Roberts, Strategic Planner II, Utah Transit Authority, Salt Lake City; and Vivian Baker, Director, Intermodal and Interagency Coordination, New Jersey Transit, Newark.
I convey thanks and appreciation to Sasha Page with IMG-Rebel. Although not involved in this research project, Sasha helped to develop my interest in public infrastructure investment-induced value creation and value capture through several related consulting assignments. Sasha was also my coauthor, along with Waiching Wong, of the “Guide to Value Capture Financing for Public Transportation Projects” published by the National Academies of Sciences (2016) on behalf of the Transit Cooperative Research Project and referenced
extensively herein.
I thank Mary K. Wolfe for her diligent and meticulous proof-reading and copyediting. I gratefully acknowledge the effort of Adam Laughery, National Account Executive, Housing Data Solutions for Government and Academia, CoreLogic, Washington, D.C., who helped me navigate an otherwise arduous data acquisition and procurement process.
PREFACE
The research reflected in this dissertation is motivated by prior work related to value capture and private sector value creation induced through public investment in light rail transit infrastructure. These subjects appear to be of increasing interest as transit agencies and advocates search for new infrastructure funding sources, and as the federal government considers both significant new infrastructure investment initiatives and strategies for maximizing the value creation and economic development which such investment may induce.
I approach this research with some relevant professional experience and perspective in place. Although I hope that I interpret and grasp the implications of the subject data
objectively and with appropriate scientific rigor, I do so through that particular lens framed from within my specific experience. Having spent 30-years as a master-planned community (land) developer, I retain profound and visceral respect for the determinative power of quasi-efficient real estate markets. To the extent I am biased in this regard, it is in the sense I that reflexively perceive “it” [private real estate value creation in this case] to be all about the market. From this perspective, public investment in light rail transit infrastructure is merely one of many intricately interwoven factors defining market opportunity, including the opportunity for private sector value creation.
some circumstances, and weak locations may fail or go undeveloped even in very strong markets. These common observations are directly relevant to conclusions derived from the data in this study. The data revealed profound variation in the extent of differential value creation both between markets (transit systems) and across sub-markets (stations within lines/systems). These variations were, perhaps, exacerbated by the fact that data availability dictated that this study span the period of the financial crisis and significant market dysfunction. I may be particularly sensitive to the pervasive impact of these market dynamics because I was personally impacted significantly and adversely by the Great Recession as were many or all of the real estate markets that comprise the subject of this analysis.
Estimation of relative market values (and associated costs) of various alternative amenities and development schemes including matters of design, typology, connectivity, and tradeoffs between public and private goods/realm) is central to the preoccupying strategic thinking (or visceral instinct/reflex) of master-planned community developers. Developers are perpetually weighing and re-weighing “the value proposition.” This may be framed, for example, as “what premium might a mother of school aged children (very often the home buying decision maker within suburban master-planned communities) be willing to pay for one type of amenity
Subsequent to my retirement from development, I have provided various consultancy services related to value creation and value capture in connection with light rail transit
development. I have also coauthored a guidebook for transit agency officials aimed at maximizing value creation and value capture opportunities associated with transit station development. All of this work has been conceived through a lens of (more or less) free-market economics, and subject to the admonition that it is the market that matters in determining outcomes. Writing now as a planner, I am reminded that to expect any particular outcome in response to planning, or the plans that result, in the absence of market validation, is folly, regardless of how well-intentioned and expertly informed such planning efforts may be.
On May 5, 2017, I was honored to appear before a working group of the Senate Committee on Banking, Housing, and Urban Affairs, Washington, D.C., on the matter of "Innovative Approaches for Measuring and Capturing the Economic Benefits of Public Transportation.” I presented preliminary findings of the research reflected herein as well as highlights and recommendations of the "Guide to Value Capture Financing for Public
Transportation Projects," recently published by the National Academies of Sciences on behalf of the Transit Cooperative Research Project (TCRP). The round table-like discussion following presentations to the Senate Banking Committee’s working group meeting was wide ranging and included: federal transit infrastructure investment strategy and objectives, measurement of induced value creation, strategies and institutional requirements for successful value capture, regulatory and approval processes, workforce and affordable housing (including consideration of housing as infrastructure and as a tool for economic development), economic structural
This research follows a number of closely related consulting projects related to finance, value capture, and value creation in connection with GoTriangle’s proposed Durham-Orange light rail transit line, Charlotte’s Blue Line and ongoing Blue Line Extension, the extension of Boston’s Green Line, and private endeavors related to public transit projects elsewhere. This study, like much of my recent work, including a 2015 white paper,
"Consideration of Economic Development Potential: Light Rail Transit in Durham and Orange Counties, North Carolina,” targets transit agency professionals and others engaged in financing or evaluating transit infrastructure projects.
I hope that this research will contribute in some small measure to a greater and more strongly nuanced understanding of the degree of aggregate private sector value creation that may be induced through public investment in new transit infrastructure, the significant extent to which value creation varies from case to case, and the factors that contribute to that variation.
Notes on scope and methodology
The study originally defined and proposed as the basis of this dissertation was
conceived with the understanding that 30 years of assessed valuation data had been compiled and were available through CoreLogic. Additionally, it was thought that the repeat sales data
underpinning the Case-Shiller home price index (also owned by CoreLogic) were available at a level of geographic detail that would allow comparison with assessed valuation data over time. Based on this understanding a study of more than 1,100 transit stations over as many as 30 years was proposed.
was further reduced to the 229 stations within 14 transit systems as a result of various data quality issues; these are the subject of this study. Note that several of the subject transit systems include stations on more than one LRT line. Subject stations have been organized within transit systems, denoting both geographical location and transit agency of operation, for the sake of convenience and identification.
TABLE OF CONTENTS
LIST OF TABLES ...xvii
LIST OF FIGURES ... xix
LIST OF ABBREVIATIONS ... xxi
CHAPTER 1: INTRODUCTION ... 1
Measuring transit-induced value creation ... 5
Transit-oriented and transit-influenced development, and value creation ... 6
Quantifying effects of proximity to light rail transit stations on assessed valuation over time 10 Effect of station-specific characteristics and transit agency initiatives on variation in differential rates of light rail transit influenced value creation ... 12
CHAPTER 2: LITERATURE REVIEW ... 18
Light rail transit value creation and the value premium ... 20
Hedonic price models ... 21
Bus rapid transit (BRT) and other value impact studies ... 27
Light rail transit and transit-oriented development (LRT and TOD) ... 28
Quantifying effects of proximity to light rail transit stations on assessed valuation ... 30
Consideration of station-specific characteristics and transit agency initiatives, and variation in differential rates of LRT-influenced value ... 33
Timing of value impacts ... 34
Contribution(s) of this work ... 35
CHAPTER 3: RESEARCH METHODS AND DESIGN ... 37
Conceptual Framework ... 37
Mixed model ANOVA ... 40
Geographic Information Systems ... 45
Treatment Areas... 46
Control Areas: Geographies surrounding subject TAIs ... 50
Quantifying effects of proximity to light rail transit stations on assessed valuation ... 52
Mixed model ANOVA ... 54
Time interaction effects ... 56
Research questions and hypotheses ... 57
Panel Regression ... 59
CHAPTER 4: DATA ... 61
Selection of independent covariates for inclusion in model(s) ... 64
Descriptive Statistics ... 64
Significance and size of effect of station-specific characteristics and transit agency initiatives on variation in differential rates of value creation in proximity to LRT stations ... 66
CHAPTER 5: SURVEY OF TRANSIT AGENCIES ... 68
CHAPTER 6: RESULTS (ANOVA, non-overlapping treatment areas) ... 75
� Total Assessed Value (model 1) ... 75
� Total Assessed Value (model 2) ... 76
� Assessed Land Value ... 76
� Assessed Improvement(s) Value... 77
� Folio Density ... 78
Total Assessed Value ... 79
Heterogeneity in differential assessed value creation within systems. ... 81
Station characteristics - significance and magnitude ... 85
Estimated Marginal Means ... 88
Supplemental Analyses ... 90
Assessed Value-Land ... 90
Assessed Value-Improvements ... 96
Folio Density ... 102
Qualitative results ... 107
Summary of findings... 109
Implications for literature ... 110
CHAPTER 7: RESULTS (Panel Regression, uncropped overlapping treatment areas)... 112
Panel Regression ... 117
CHAPTER 8: LIMITATIONS ... 129
Non-random determination of transit line corridors and alignments, station locations and design, and institutional factors ... 129
Data quality ... 129
Tax assessment and methodology ... 130
Assessed valuation as a measure of value ... 131
An observation regarding reassessment methodology ... 132
Structural bias in data aggregation and reporting ... 132
Missing data ... 133
Measurement and reporting error ... 134
Transit Areas of Influence, treatment, control, and buffer area definitions. ... 134
External validity ... 135
Selection bias ... 136
Treatment confounding control, interference, buffer effects ... 137
Spatial autocorrelation ... 139
Temporal autocorrelation ... 139
Other confounding, and unobserved variables not included in model ... 140
Substitution effects ... 140
CHAPTER 9: CONCLUSIONS AND OBERVATIONS ... 142
Assessed value creation ... 142
Station characteristics ... 143
Transit agency initiatives and objectives ... 143
Unanticipated results ... 144
Value creation / treatment effect ... 144
Specific market, market conditions, and other (unknown) factors ... 144
Contribution of land and improvement to total assessed value ... 145
Parking and station character ... 146
Station typology ... 147
Insignificant demographic covariates ... 147
Transit agency perspectives... 147
Other considerations ... 148
A question for future consideration: ... 149
Suggestions for future research ... 150
Opportunities for case study analyses ... 151
Understanding variation in differential value creation rates ... 151
Understanding sub-market (intra-transit line) characteristics ... 152
Understanding predevelopment land speculation and timing of value creation... 153
Implications for practice ... 153
APPENDIX I – Survey Instrument... 155
APPENDIX II – Stations Excluded from Analysis ... 161
APPENDIX III – GIS Data Processing ... 162
APPENDIX IV - Selection of demographic covariates ... 170
APPENDIX V – Transit Agency Survey Data – Descriptive Statistics ... 173
Station Characteristics... 173
Transit line design/development objectives ... 174
Value Creation Strategies ... 175
Value Capture Strategies ... 176
Transit Agency Perspectives ... 177
LIST OF TABLES
Table 1: Variables, measures, and sources... 44
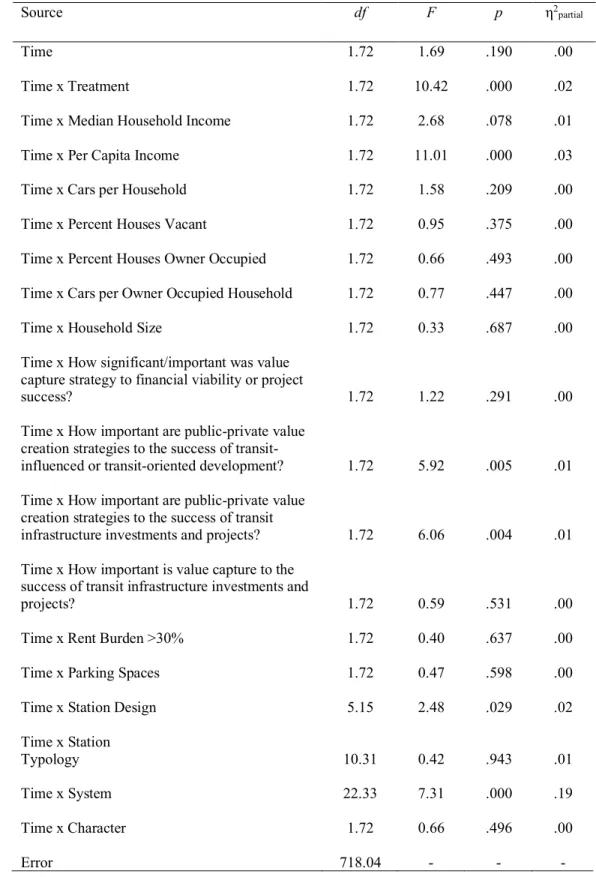
Table 2: ANOVA Source Table, Total Assessed Value (1), Between Subjects ... 83
Table 3: ANOVA Source Table, principal treatment effect, Total Assessed Value (1) ... 85
Table 4: ANOVA Source Table, Total Assessed Value (2), Between Subjects ... 86
Table 5: ANOVA Source Table, Station Characteristics, Total Assessed Value (2), Within-Subjects ... 89
Table 6: ANOVA Source Table for Assessed Land Value per Acre, Between-Subjects ... 93
Table 7: ANOVA Source Table, Station Characteristics, Assessed Land Value, Within-Subjects96 Table 8: ANOVA Source Table for Assessed Value - Improvements per Acre, Between-Subjects ... 100
Table 9: ANOVA Source Table, Assessed Value-Improvements, Within-Subjects ... 102
Table 10: ANOVA Source Table for Folio Density (counts per acre), Between-Subjects ... 105
Table 11: ANOVA Source Table, Folio Densities, Within-Subjects ... 107
Table 12: Differential Rates of Total Assessed Value Growth per Acre, by Station Quintile .. 114
Table 13: Differential Rates of Total Assessed Value Growth per Acre, by Transit System .... 115
Table 14: Differential Rates of Total Assessed Value Growth/Acre by Charlotte Blue Line Station ... 116
Table 15: Panel Regression Differential Rates Total Assessed Value Growth/Acre on Year (only)... 119
Table 16: Panel Regression Differential Rates of Total Assessed Value Growth per Acre on Station Characteristics (only) ... 120
Table 18: Panel Regression Differential Rates of Total Assessed Value Growth per Acre on Reported Transit Agency Value Creation Initiatives (only) ... 124 Table 19: Panel Regression Differential Rates of Total Assessed Value Growth per Acre on
Reported Transit Agency Perceptions of the Importance of Various Value Creation and Capture Strategies to Financial Viability or Project Success (only) ... 125 Table 20: Panel Regression Differential Rates of Total Assessed Value Growth per Acre on
Reported Employment of Various Value Capture Strategies (only) ... 126 Table 21: Full Regression Model: Panel Regression Differential Rates of Total Assessed Value
LIST OF FIGURES
Figure 1: Virtuous cycles of value creation ...4
Figure 2: Investment, value creation, value capture and transfer ...7
Figure 3: Inter-entity engagement and strategic partnership ...9
Figure 4: Conditions precedent to value creation and capture, Adapted from Guide to Value
Capture Financing for Public Transportation Projects ... 13
Figure 5: 14 U.S. transit systems comprising the subjects of this analysis ... 46
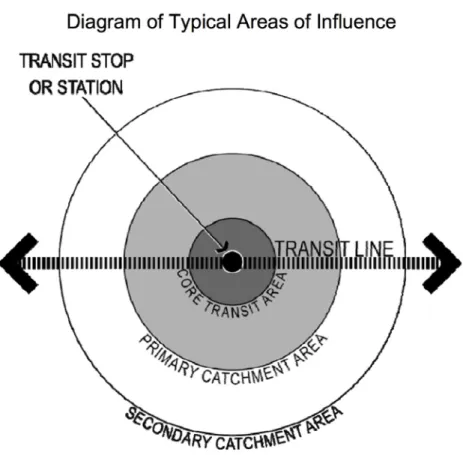
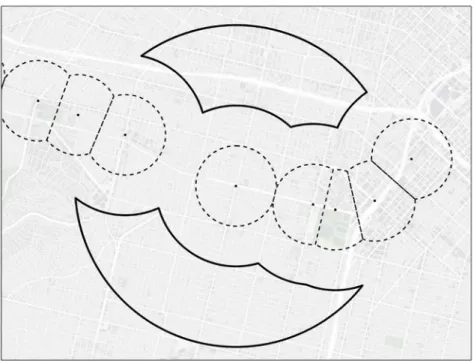
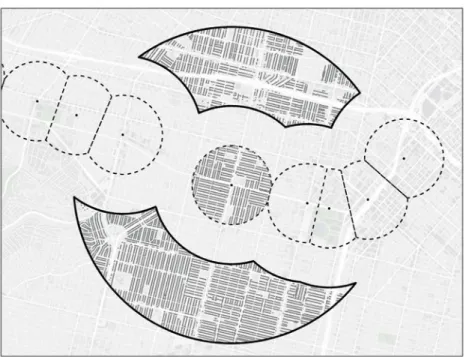
Figure 6: Defining Transit Areas of Influence APTA SUDS-UD-RP-001-09 (APTA, 2009) ... 47
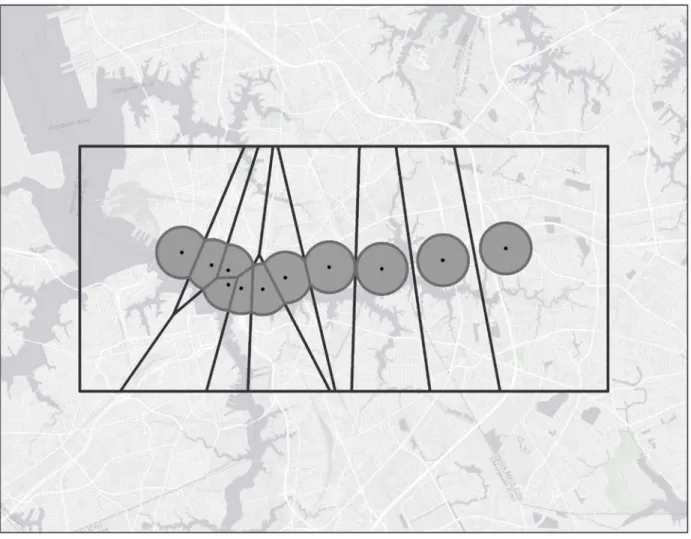
Figure 7: Treatment areas defined exclusive overlaps using Thiessen polygon and union
method ... 49
Figure 8: Representative treatment and corresponding control areas, exclusive of folio
centroids. ... 51 Figure 9: Representative treatment and corresponding control areas, inclusive of folio
centroids. ... 52
Figure 10:(Unadjusted) Mean Total Assessed Value Per Acre ... 79
Figure 11: Differential (mean) rates of change in total assessed value over time, by quintile. .. 80
Figure 12: Mean differential rates of change in Total Assessed Value by System ... 81
Figure 13: Estimated Marginal Means, Total Assessed Value ... 88
Figure 14: Mean Assessed Value-Land per acre ... 91
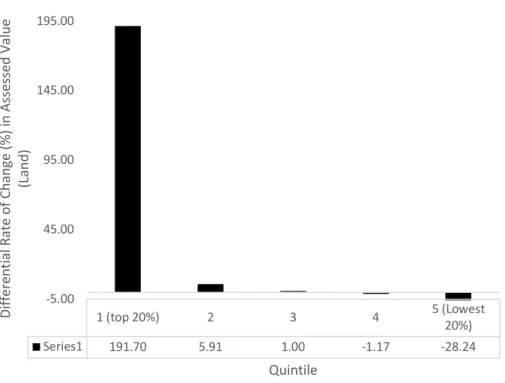
Figure 15: Differential (mean) rates of change in assessed land value over time, by quintile. .. 92
Figure 16: Mean differential rates of change in Assessed Land Value by System... 93
Figure 17: Estimated Marginal Means, Assessed Value – Land ... 95
Figure 19: Differential (mean) rates of change in assessed improvement(s) value over time, by
quintile. ... 98
Figure 20:Mean differential rates of change in Assessed Improvement(s) Value by System ... 99
Figure 21: Estimated Marginal Means, Assessed Improvement(s) Value ... 101
Figure 22: Mean Folio Densities per acre ... 103
Figure 23: Differential (mean) rates of change in total assessed value over time, by quintile. 104 Figure 24: Estimated Marginal Means, Folio Densities ... 106
LIST OF ABBREVIATIONS
APTA American Public Transportation Association ATE Average Treatment Effect
BRT Bus Rapid Transit CBD Central Business District
GIS Geographic Information Systems LRT Light Rail Transit
SAD Special Assessment District TAI Transit Area of Influence
TCRP Transit Cooperative Research Project TIF Tax Increment Financing
TID Transit Influenced Development TOD Transit Oriented Development VC Value Capture
CHAPTER 1: INTRODUCTION
Public investment in infrastructure, such as that required for light rail transit, can induce or facilitate market response resulting in higher rates of private sector value creation than might otherwise have occurred. This study examines the extent of differential aggregate private sector value creation by comparing the private sector value creation (revealed through changes in assessed valuation) occurring within ½-mile of 229 U.S. light rail transit stations to the private sector value creation occurring within surrounding areas over a period extending from 2005 through 2015. The analysis seeks to identify factors contributing to variation in differential rates of value creation and to estimate the significance and magnitude of those affects.
“Value creation” is the principal objective of many economic enterprises. It may be the raison d'être for all for-profit corporations for example. In the context of this writing, “value creation” is any increase in the market value of real property (comprised of land and
improvements) resulting from development, redevelopment, renovation, and/or increases in per unit market prices that would result in greater taxable value on an ad valorem basis. The
relationship between public infrastructure investment and the subsequent (or anticipatory) private-sector investment it may induce is complex and nuanced. Any implication that private-sector value creation, as referred to herein, results directly or exclusively from such public-private-sector infrastructure investment is unintentional. We do not know, and cannot demonstrate, whether or not differential changes in value creation are due to transit investment, or something else in part or in whole.
The extent of differential value creation and factors contributing to variation are of importance because of increasing interest in infrastructure investment in general, and transit infrastructure in particular. Buttressing and perhaps underlying much of the interest in value creation, planners, transit agencies, and financiers and financial advisories are increasingly looking to value capture as a means to fund and finance some part of the significant
infrastructure cost associated with transit projects.
Transit ridership within the United States has increased significantly over the past 20-years and has recently been growing at a faster rate than private automobile travel. Virtually all U.S. transit ridership growth has been on rail. The proportion of transit riders on busses has decreased significantly over the same period (APTA, 2015; Newman, 2013). “Light rail has had the fastest growth rate of any mode, almost tripling patronage [albeit from a low starting point] between 1993 and 2011” (Newman, 2013). Increasing demand for public transit, combined with rising infrastructure costs in an environment of modest economic growth and recovery from financial crisis, has amplified financial challenges for transit agencies.
by the fact that both the volume of new transit ridership and the magnitude of value creation in response to new light rail transit infrastructure varies significantly both across and within
metropolitan markets. Not only do underlying economic and market forces play significant roles in determining private sector response to public sector investment, but market conditions and opportunities fluctuate significantly with market and economic cycles.
Value capture and transportation infrastructure investment in the U.S.
Although this study does not address value capture per se, value capture provides both context and motivation for this value creation analysis. Value capture refers to a range of
mechanisms and strategies designed to recover some of that private sector value creation induced by public investment in transportation (or other) infrastructure which is capitalized into real property values. Within the context of fixed guideway transit, value capture opportunities arise from value created within the oriented development (TOD) and/or otherwise transit-influenced development (TID) that can result in proximity to transit stations. Value associated with the transit service and accessibility, as well as that of other amenities common to
development occurring in proximity to transit stations may become capitalized into the market price of real property (Cervero, 2004; McIntosh et al., 2014). Understanding the magnitude of such value creation, and the extent to which some portion of that value constitutes a market premium to transit, is increasingly important to those looking to value capture as a means of financing some portion of transit (or other transportation) infrastructure investment.
Tan, Janssen-Jansen, & Bertolini, 2014). Such a virtuous cycle is illustrated in Figure 11. Investment in (capacity and accessibility creating) transit infrastructure by transit agencies, federal, state, and local government, and other public-sector actors can induce private sector investment, development, and value creation.
Some part of any such value creation may be captured by public sector investors both to recoup investment and to invest in additional transit capacity. Subject to adequate unsatisfied demand for transit, increased capacity provides
improved accessibility and ridership (as well as ancillary market demand and activity) inducing additional value creation. Such value creation may include a variety of urban amenities, such as those often embedded in transit-oriented development, that further spur demand, and so on. Such virtuous cycles of investment, value creation, value capture,
reinvestment, and expansion of value-inducing capacity are possible because some part of the value of enhanced mobility, accessibility, and other prospective amenities can become
capitalized into nearby land, commercial real estate, and housing prices (Agostini & Palmucci, 2008; Golub, Guhathakurta, & Sollapuram, 2012).
Notwithstanding the great potential for such value creation, and the potential for value capture to offset public investment in transit infrastructure, results within the U.S. have been
mixed and often less than uniformly satisfactory both with respect to value creation and to value capture. In response, the Transit Cooperative Research Program (TCRP), an applied, research program that develops near-term, practical solutions to problems facing transit agencies, recently sponsored development of the Guide to Value Capture Financing for Public Transportation Projects recently published by the National Academies Press (2016).
Value capture is the public recovery of a portion of increased property value created as a result of public infrastructure investment. Common value capture mechanisms are impact fees, joint development, sale or leasing of air rights, land value taxation, station naming rights, negotiated exactions, parking fees, sales tax and special assessment districts (SADs), and tax increment financing (TIF). Given expanding demand for new transit infrastructure and scarce financial resources, U.S. transit agencies are increasingly looking toward innovative funding sources and strategies. Value capture is one of these innovative strategies (Page & Bishop, 2016).
Measuring transit-induced value creation
Capitalization effects, the extent to which the value of transit accessibility and/or other transit proximity related amenities or benefits become capitalized into the market price of real property, may be either positive or negative. Proximity to light rail transit stations may increase property values because of enhanced mobility and accessibility as well as proximity to other amenities. On the other hand, proximity to rail lines further removed from station area may decrease property values because of nuisance effects and negative externalities such as noise, vibration, and other environmental impacts (Armstrong & Rodriguez, 2006; Golub et al., 2012).
The literature on land and property values demonstrates a great deal of variability in the estimated change in values arising from rail investments… a meta-analysis on empirical estimates from 23 studies that analyzed the impact of rail on land/property value changes… show that a number of factors produce significant variations in the estimates. These include the type of land use, the type of rail service, the rail system life cycle maturity, the distance to stations, the geographical location, accessibility to roads, methodological characteristics, as well as whether the impacted area is land or property (Mohammad, Graham, Melo, & Anderson, 2013).
This study contributes to a growing body of literature regarding value creation induced through proximity to light rail and/or other transit stations within transit-oriented development (TOD) or within otherwise transit-influenced development (TID). Unlike hedonic price models which estimate consumers’ marginal willingness to pay for amenities such as proximity to transit, this study quantifies actual differential rates of aggregate annual value creation within areas proximate to U.S. light rail transit stations compared to surrounding areas. Additionally, this study contributes to an understanding of the impact on value creation of station characteristics and transit agency implementation strategies. These include 1) early engagement by transit agencies in strategic public-private partnership, 2) station location in terms of
development typology, 3) dominance of pedestrian or vehicular design, and 4) employment of specific value capture strategies.
Transit-oriented and transit-influenced development, and value creation
Much of the literature relating to value creation and value capture has focused on attributes of transit-oriented development in addition to the value-related effects of transit capacity and accessibility. The viability and success of value capture strategy within TOD and TID is explicitly dependent on the extent of differential value creation, as well as other
institutional, economic, market, and financial factors. While “it has long been recognized that fixed transit infrastructure creates urban value in the property and land markets” (Cervero & Kang, 2011; Rodríguez & Targa, 2004; Smith & Gihring, 2006), “there [have been] few comprehensive assessment frameworks used to assess and capture the benefits…created” (McIntosh, 2015). Any such value capture assessment framework is dependent on an
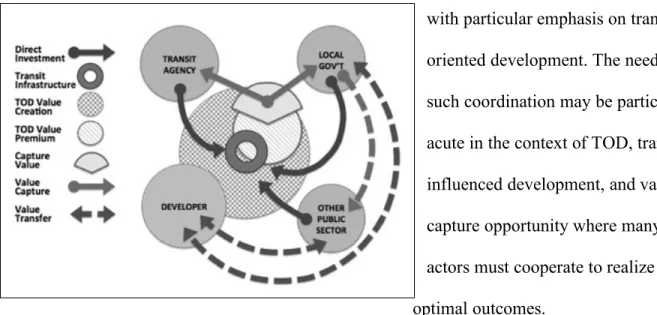
Extensive research has been conducted regarding institutional and inter-institutional factors such as the need for coordination between urban land use and transportation planning,
with particular emphasis on transit-oriented development. The need for such coordination may be particularly acute in the context of TOD, transit-influenced development, and value capture opportunity where many actors must cooperate to realize optimal outcomes.
Figure 2 illustrates the idea that once new direct investment in transit infrastructure is effected through a transit agency (or equivalent) private sector developers (and investors and speculators) may respond in a manner that creates or otherwise results in value creation surrounding that infrastructure. In many cases, some portion of that value creation can be construed as value premium in the sense that land or other real estate assets command higher prices (value) than would be the case in the absence of the infrastructure investment. Any such value premium creates opportunity for the public-sector investor(s) to capture some part of that value to provide a return on or a partial return of the public investment. So long as the extent of value capture does not exceed the infrastructure induced premium, such a revenue source (exaction) should not create a competitive disadvantage in the market.
Value capture might be used to return revenue to other public entities such as local government which may have invested (directly or indirectly) in transit supportive municipal infrastructure. Value capture benefits (revenue) realized by local government may be used both to invest in other public policy objectives (such as affordable or workforce housing for example)
and/or to provide additional value creating incentives to developers (infrastructure related impact fee credits or offsets for example).
Effective value capture strategy can buttress a virtuous cycle of value creation (Huxley, 2009; Levinson & Istrate, 2011). The potential for and extent of value creation within TOD may be dependent, in part, on the extent of cooperation and strategic engagement between transit agencies, local government, other public-sector agencies and interests, private landowners and developers, and other private sector interests, as depicted in Figure 21. Transit agencies seeking to benefit from value capture following direct investment in new transit infrastructure must rely on the cooperation and engagement of private developers and local government in providing additional investment and negotiating market appropriate value-optimizing entitlements. Developers and local governments may also cooperatively engage with other public-sector actors such as housing authorities to participate in additional value-creating investment. The engagement referred to here is not merely that which is often undertaken in the interest of balancing multiple interests toward the end of building consensus or acceptance (Kaza, 2006), but that which is required to align strategic interests in long-term value creation, particularly in the context of unknowable future economic and market conditions (Zapata & Kaza, 2011). The extent and complexity of cooperative and strategic engagement required of multiple public and private actors, each constrained by market forces and requirements of public or private finance, is illustrated in Figure 31.
Experience suggests that frequent institutional reluctance to engage in strategic partnership toward mutually beneficial TOD/TID value creation may result from cultural,
institutional, administrative, and legislative forces as well as divergent market and non-market incentives (Kaza, 2013). The institutions and parties that must cooperate in the interest of maximizing value creation often operate from within largely isolated silos of language, perspective, and vision.
Disinclination or reluctance to engage, cooperate, and plan and act together may result from failure to recognize mutual benefits, and from very different understanding of the meaning of plans themselves (Kaza, 2008). Overcoming such reluctance may require a more thorough understanding of the nature and scale of potential benefit to all parties resulting from both inter-institutional engagement, and in realization of significant incremental value creation through joint planning and joint or coordinated action. Transit agencies and other public-sector actors may benefit from a more thorough understanding of the tools and requirements necessary to achieve such value creation (Kaza & Hopkins, 2007). Transit agencies may forgo beneficial
strategic partnership and market engagement in favor of laissez-faire reliance on the presumption that market response to new or enhanced transit infrastructure investment and services will result in desired value creation. Real estate price premiums sometimes associated with TOD/TID are frequently generalized and
interpreted as proxy for value creation in the aggregate. Figure 3 illustrates the sort of strategic engagement and/or partnership required to maximize private-sector value creation in response to public-sector infrastructure investment.
Transit agencies, other public-sector agencies, and private-sector both invest directly in value creation and stand to benefit (participate) in such value creation either directly or through value capture. Strategic engagement, if not formal partnership, between these entities is required to maximize the value creation opportunity. The nature of such partnership or engagement is constrained by the requirements and peculiarities of the (dynamic) public or private finance environments in which they operate. Land owners, speculators, and investors, and other public-sector entities may benefit from value creation even if they do not invest in it. Notwithstanding this, significant benefit may result from strategic engagement between primary public and private sector actors and other stakeholders. Thorough understanding of the causes, requirements, nature, and extent of transit infrastructure-induced value creation is both currently inadequate and
desirable.
Quantifying effects of proximity to light rail transit stations on assessed
valuation over time
The tendency for people to congregate, and for commerce and other human activity to become concentrated, in centers or nodes of high activity where transportation has been facilitated (and where direct transportation - or commuting - costs have been minimized), and for land rents to increase with density and activity, is consistent with theories of urban spatial structure (Alonso, 1964; Muth, 1979). Both economic theory and many hedonic price models extant in the literature suggest that consumers who would benefit from living and/or working, shopping, or recreating in proximity to transit stations should be willing to pay for such proximity. Such willingness to pay for
accessibility should create economic opportunity for those who would provide (develop) residential, office, retail, and other real property improvements in proximity to transit, when and where the value of those (consumer preferential) price premiums exceed the cost(s) associated with supplying the amenities and specific bundles of goods demanded by consumers.
Although assessed valuation is a somewhat sluggish and imperfect measure of underlying market value in real time, it is a useful and important measure of value for purposes of implementing many value capture strategies and for considering related public policy objectives. Methodologies associated with value assessment for ad valorem tax purposes present several concerns (particularly with respect to assessed valuation as a real-time proxy for market value). These concerns are addressed under “Limitations” below. Assessed valuation reduces or eliminates other concerns, however, such as sample selection biases within price indices (Jud & Winkler, 1999), and provides a number of practical advantages.
This analysis quantifies differential annual rates of change in assessed value and folio density between areas of treatment (immediately proximate to stations) and surrounding areas
(control) for 229 light rail transit stations along 21 LRT lines in 14 U.S. transit systems between 2005 and 2015, and evaluates a number of station-specific, transit agency, and demographic characteristics in an effort to explain variation in differential value creation. Note that several of the subject transit systems include stations on more than one LRT line.
Effect of station-specific characteristics and transit agency initiatives on
variation in differential rates of light rail transit influenced value creation
Differential rates of value creation within transit (station) areas of influence vary significantly both between transit lines and markets as well as within the same transit line. This analysis seeks to identify the extent to which specific station characteristics are associated with variation in differential rates of value creation. Specific station characteristics include station design (e.g. elevated, at grade, open cut, underground, etc.), dominant station character (e.g. walk-and-ride or park-and-ride), the number of parking spaces provided at each station, and a range of station locational typologies (e.g. downtown – Central Business District (CBD), urban center, urban neighborhood, suburban town center, suburban neighborhood, campus,
entertainment, special).
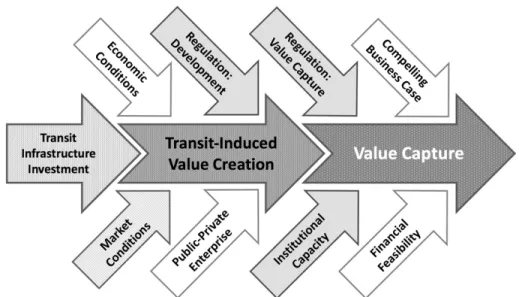
Value creation (and any potential for subsequent value capture) is influenced by other factors as well. Robust value creation is dependent on a number of requisites including:
real estate market vitality, accommodative zoning and land use entitlements; and development of project- and context-specific financial strategies that are feasible and incentivize and reinforce value creation; and institutional capacity on the part of transit agencies, local governments, developers, and other partners working together to
Economic conditions fluctuate significantly over time. Real estate market conditions vary from time to time and place to place. Market conditions specific to each metropolitan market are captured within Transit System designation. Responses to transit agency survey questions (described below) address 1) the extent of public-private engagement [represented as Public-Private
Enterprise arrow in Fig. 4], 2) institutional capacity, and 3) regulation regarding value capture to some degree. Although institutional capacity and regulation affect value capture potential more directly that value creation, they may inform the extent to which transit agencies are focused on maximizing value creation early and strategically.
Figure 4: Conditions precedent to value creation and capture, Adapted from Guide to Value Capture Financing for Public Transportation Projects
This analysis seeks to identify the extent to which specific transit agency objectives and initiatives are associated with variation in station-specific rates of differential value creation over time. Surveys were solicited from senior planners and managers from the 14 transit agencies
value capture, strategic engagement with entities outside the transit agency, and the relative
importance of various initiatives to achievement of transit (i.e. planning and investment) objectives.
Brief summary of findings
Differential rates of assessed value creation varied widely across transit systems and individual stations. Where treatment areas were defined such that there was no overlapping of adjoining treatment areas, Transit Areas of Influence (TAIs) in the top 20% of differential value creation experienced average annual growth rates 30.67% faster than that of control, whereas TAIs in the bottom quintile experienced negative average annual differential growth rates (1.25% less than those within control areas). Significantly positive differential value creation was concentrated within a small number of transit systems and within a relatively few number of stations along several of the lines studied.
Differential rates of assessed value creation are found to accrue disproportionately to improvements (and to folio density) rather than to land. In the aggregate, assessed
improvement(s) values grew 4.35% faster in treatment areas than in control areas, whereas assessed land values grew only 3.28% faster within treatment areas. The extent to which treatment explained variation in differential value creation was roughly twice that for assessed improvement(s) value and that for assessed land value (approximately 2% compared to
approximately 1%). Additionally, although the treatment-time interaction effects were significant over the entire period for assessed improvement values, the effect was not significant in any individual year for assessed land value.
census block-level), accounting for an additional 3% of variation; station design, accounting 2% of variation; transit agency perceptions of public-private value creation strategies as important 1) to the success of transit infrastructure investments and projects, and 2) to the success of transit-influenced or transit-oriented development, accounted for an additional 1% of variation each. Significantly positive differential value creation occurred predominantly near at-grade stations.
Of numerous demographic covariates evaluated, only per capita income and vehicles per household were significant, predicting 4% and 2%, respectively, of the variation in
differential rates of change over time (the interaction of covariate and time) between treatment and control groups.
Where treatment areas were defined such overlapping of adjoining treatment areas was allowed, differential rates of assessed value creation per acre were similarly highly varied across transit systems. Differences between compounded annual rates of value creation within treatment and control areas ranged from -1.16% to 7.82% (3.21% average across all stations, regardless of system).
Contribution to literature and practice
This study attempts to bridge some part of the gap between the generally accepted understanding of potential for transit price/value premium (i.e. some consumers willing to pay price premium to live/work in proximity to transit-oriented development, under certain
professionals, and other advocates of public transit in general and/or LRT, may be enticed by the notion that investment in new light rail transit capacity and stations can result in transit value premiums capitalized into real estate value. This premium (consumers’ willingness to pay, realized in some locations during some periods under certain circumstances) may become conflated with the aggregate value creation on which policy makers and financiers must rely in order to realize value capture as a viable source of infrastructure finance. The fact that specific markets or sub-markets may respond to new LRT stations with significant apparent price premiums may become misinterpreted as an indication that such market responses occur
spontaneously and/or more or less uniformly. This may devolve into a sense and expectation that “if we build it they will come,” setting up disappointment when value creation fails to materialize uniformly or robustly.
This study spans those years that were significantly and adversely impacted by the Great Recession. It appears that market forces and characteristics other than those captured within the covariates in this study influence differential value creation in proximity to new light rail transit systems to a significantly greater extent than the treatment (i.e. new
infrastructure/investment) itself. This underscores the importance of understanding and underwriting such market condition and factors before undertaking projections with respect to anticipated levels of value creation.
This study is intended to inform public policy and professional practice in the U.S. with respect to planning for and realizing value creation, particularly in the context of
CHAPTER 2: LITERATURE REVIEW
That growth in real property value in which policy makers and financiers of public transit infrastructure are interested occurs over long periods of time and must be stable and enduring. Its conditions precedent must be well understood. Policy makers, planners, and financial advisories and underwriters must be able to anticipate with some confidence when, where, and to what extent value will be created in response to new infrastructure investment.
Dominant themes in the literature suggest that although uneven, consumers are generally willing to pay some price premium for real estate proximate to light rail or other transit stations (including Bus Rapid Transit, or BRT) and/or within oriented or
transit-influenced development. Some studies have suggested that consumers’ revealed willingness to pay a price premium may be related as much to a specific range of urban and lifestyle amenities as to transit accessibility; whether or not those amenities are located near transit stations. Most of these studies have employed hedonic price models to disaggregate consumer preferences for various individual characteristics of highly heterogeneous properties; which characteristics are not traded individually in the marketplace. Some discussion of hedonic models follows within this literature review, as does review of literature addressing appropriateness of assessed valuation as a measure of value.
Rail by Measuring Home Appreciation: A First Look at New Jersey’s River Line, found that “the net impact of the line on the owned housing market is neutral to slightly negative. While lower-income census tracts and smaller houses seem to appreciate near the station, this may be a value transfer from farther-away properties not favored with access” (Chatman, Tulach, & Kim, 2012). A 1993 study of the impact of the Miami Metrorail system on residential property values
proximate to stations employed repeat-sales indices and hedonic regression methods and found that “residential values were, at most, only weakly impacted by the announcement of the new rail system.” (Gatzlaff & Smith, 1993) Other studies have found positive value impacts in proximity to stations, but offsetting negative value impacts near transit lines outside of station areas
(Armstrong & Rodriguez, 2006; Bowes & Ihlanfeldt, 2001).
The 2013 Mathur and Ferrell study concludes that “in general the empirical evidence suggests that proximity to the station and increase in overall transportation accessibility increase home prices.” Notwithstanding this, results of value creation and transit premium studies have been inconsistent and somewhat contradictory. This should not surprise. Anecdotal experience suggests that market response to new LRT station development has been robust in some
instances and underwhelming in others. The 2009 Mineta Transportation Institute Report on the Effect of Transit Oriented Developments (TOD) on Nearby Home Values, also written by
Mathur and Ferrell, “estimates the impact of four San Francisco Bay Area sub-urban [rail transit] TODs on single-family home sale prices. The study finds that the case study suburban TODs either had no impact or had a positive impact on the surrounding single-family home sale prices.” (Mathur & Ferrell, 2009).
other studies have employed matched-pair or repeat sales ratio analyses. All of these approaches attempt to control for characteristics other than proximity to transit in highly heterogeneous individual real estate properties. While there may be problems with any approach, hedonic models are commonly perceived to impose the most rigorous controls and are used most widely (Cervero & Aschauer, 1998).
The second section focuses on literature related to transit-oriented development (TOD) and value creation. The summary section reviews the literature in the context of the specific aims of this dissertation, and its three research objectives: 1) quantifying effects of proximity to LRT stations on assessed valuation, 2) consideration of station-specific characteristics and transit agency initiatives, and variation in differential rates of LRT-influenced value, and 3)
identification of background demographic characteristics predictive of variation in differential rates of LRT influenced value creation.
Light rail transit value creation and the value premium
Numerous studies have been undertaken over several decades regarding the
relationship between light rail transit and property values. Analyses have employed a wide range of methodologies and measures of value. An extensive body of literature estimates the effect of proximity to the rail station (Bajic, 1983; Benjamin, 1996; Cervero & Duncan, 2002c; Cervero & Landis, 1997; Chatman et al., 2012; Hess & Almeida, 2007; Lewis-Workman & Brod, 1997; Rodriguez & Mojica, 2008; Strand & Vågnes, 2001), transit lines (Dubé, Des Rosiers, Thériault, & Dib, 2011; Nelson, 1992), and the effect of transportation accessibility on property values (Armstrong & Rodriguez, 2006; Cervero, 2004; Gatzlaff & Smith, 1993; Mathur, 2008; Voith, 1993; Weinberger, 2000).
2014); Phoenix, Arizona (Golub et al., 2012); Minneapolis, Minnesota, Denver, Colorado, and Charlotte, North Carolina (Fogarty & Austin, 2011); Guangzhou (Canton), China (Tian, 2006); The Netherlands, (Debrezion, Pels, & Rietveld, 2011); Sunderland, UK (Du & Mulley, 2007); Atlanta, Georgia (Bowes & Ihlanfeldt, 2001; Nelson, 1992); Dallas, Texas (Weinstein, Clower, Means, Gage, Pharr, Pettibon, & Gillis, 2002); Miami, Florida (Gatzlaff & Smith, 1993); Queens, New York (Lewis-Workman & Brod, 1997); Philadelphia, Pennsylvania (Voith, 1993); Portland, Oregon (Al-Mosaind, Dueker, & Strathman, 1993; Chen, Hu, & Zhou, 2011; Dueker & Bianco, 1999); Sacramento, California (Landis et al., 1995); San Diego, California (Cervero & Duncan, 2002b; Landis et al., 1995); Los Angeles, California (Cervero & Duncan, 2002a); San Francisco, California (Landis et al., 1995; Lewis-Workman & Brod, 1997); San Jose, California (Cervero & Duncan, 2002c; Landis et al., 1995); Santa Clara County, California (Cervero & Duncan, 2001); St. Louis, Missouri (Garrett, 2004); Chicago, Illinois (McDonald & Osuji, 1995); and Sheffield, England (Henneberry, 1998).
In addition to value expressed exclusively in terms of market value, some of these studies focus on the nature, quality, and caliber or density of development that may be induced through investment in new transit infrastructure, and the value impact of specific characteristics of place. Many value studies have been cross-sectional in nature. Few of the longitudinal studies consider extended periods of time. Much of the existing literature employs or concerns the results of hedonic price models.
Hedonic price models
stations in this case) are paired for purposes of comparing effects of the single differentiating characteristic. The repeat sales method of measuring changes in real property values over time involves comparing transaction prices of those individual properties that have changed hands multiple times over the subject time period. Perhaps the best-known example of repeat sales analysis is the Case-Shiller Index which relies on that method.
The most common of these approaches is the hedonic price model. Many hedonic price models have been developed since the 1970s to isolate market price response to specific real property attributes such as proximity to LRT systems (Kittrell, 2012). These models estimate consumers’ marginal willingness to pay for some particular attribute, holding individual
characteristics and all other factors constant (Rosen, 1974). Hedonic price models employ multiple regression analyses to disaggregate and apportion real estate prices to individual explanatory variables, estimating the marginal contribution of each to total market price.
The literature comprised of hedonic price models estimates the market price effect of proximity to LRT or other transit stations such as those for BRT or proximity to TOD—or some subset of TOD amenities—on a single class of individual residential or non-residential properties as the unit of observation (Rodríguez & Targa, 2004). These studies have generally been cross-sectional or of limited duration (often comprising two time periods), sometimes spanning commencement of new transit service. In a paper by Cervero and Duncan, for example, select observations for commercial, office, and light industrial properties for 1998 and 1999 “were … felt to provide a sufficient time lapse for the benefits of proximity to light and commuter rail services [introduced in the early 1990s] to have taken [effect]” (Cervero & Duncan, 2001).
overlay zoning. Whereas predominantly park-and-ride communities experienced no
capitalization benefits for single-family houses and a discount for condos (Atkinson-Palombo, 2010).
A 2011 review of literature reporting hedonic price model estimates of TOD impacts on real estate values, “confirms that the market shift is, indeed, being capitalized into real estate prices and demonstrates that the amenity-based elements of transit-designed development play an important positive role in urban land markets, independent of the accessibility benefits provided by transit” (Bartholomew & Ewing, 2011).
Representative examples of such studies include those for markets such as: San Diego, California (Duncan, 2010); Phoenix, Arizona (Kittrell, 2012); Los Angeles County, California (Cervero & Duncan, 2002a);San Diego County, California (Cervero & Duncan, 2002b); Manchester, England (Forrest, Glen, & Ward, 1996); Multiple markets, California (Landis, Guhathakurta, & Zhang, 1994); Commercial properties (Weinberger, 2000); Santa Clara, California (Weinberger, 2001); Subway impacts, Toronto, Canada (Bajic, 1983; Dewees, 1976); Buffalo, New York (Hess & Almeida, 2007); Subway impacts, Seoul, Korea (Bae, Jun, & Park, 2003); Miami, Florida (Gatzlaff & Smith, 1993); Guangzhou, China (Tian, 2006); Portland, Oregon (Al-Mosaind et al., 1993; Chen, Rufolo, & Dueker, 1998); and Oslo, Norway (Strand & Vågnes, 2001).
price (only) effects may not be sufficient, however, to inform understanding of the extent of aggregate value creation within TOD or in proximity to new LRT stations and service. It is conceivable, for example, that higher unit prices could come at the expense of quantity or velocity of sales, or that relatively high residential density and price could displace office or retail space of higher value.
Hedonic price estimates do not translate simply and directly into estimates of
aggregate value creation within a transit area of influence, nor into comparison of that aggregate value to areas beyond transit influenced development. Consumers’ willingness to pay a premium for proximity to TOD or proximity to transit in some other form of transit-influenced
development may come at the cost of unit size and/or other amenities. Those willing to pay a market premium for proximity to transit (within the context of a hedonic price model) may elect to purchase or lease relatively small units at relatively modest levels of fit and finish in order to be able to afford the transit price premium. Knowledge of such consumers’ willingness to pay a transit premium is potentially useful for market niche-seeking developers, investors, lenders, and marketers, but less so for policy makers and transit financiers interested in aggregate value creation, prospectively in the interest of value capture.
Numerous hedonic price models have estimated the implicit value of proximity to transit stations, as well as that of TOD attributes and amenities. Such estimates are useful and informative with respect to disaggregating and estimating consumers’ marginal willingness to pay real estate price premiums for properties benefitting from proximate transit (and/or other) amenities. Such estimates may be insufficient, however, to inform decisions regarding
for and optimization of value capture opportunities. An “if we build it they will come – and create value” presumption on the part of transit planners and managers may discourage the very activism and early strategic engagement necessary to lay the ground work for value capture and the value creation on which it depends. Contributing to the potential opportunity cost of
incomplete knowledge with respect to value creation is limited understanding of the relative contributory value effects of TOD/TID typology, dominance of walk-and ride or park-and ride characteristics, and implementation of various value creation and value capture strategies. Existing literature reveals that the potential for LRT and TOD value creation and price
premiums, while generally positive, is highly inconsistent, as is also the case for other modes of transit such a BRT (Rodriguez & Mojica, 2008). Both the “magnitude and direction of property value impacts [can] vary” based on a number of characteristics (Mathur, 2014).
Hedonic price models estimate consumers’ willingness to pay a marginal price differential for a specific amenity or characteristic (of highly heterogeneous products or services such as housing) adjusted for many other characteristics. The hedonic model reveals otherwise ambiguous preference, but neither consumers’ ability to pay a particular price in total, nor the extent to which such preference might result in increased total price/value or value creation. The hedonic price model does not tell us when or where proximity to transit may result in additional realizable demand or development. Consumers within a specific demographic may have a very strong preference for travel via public transit and be willing to pay a premium to live in
(non-transit) preferences, and their willingness and ability to pay a total (aggregated) product price for a specific bundle of characteristics and amenities at a specific time in a specific location.
Some of those economically (or otherwise) dependent on inner-city bus service, for example, often pay what seem to be very high rents for very modest, even substandard or dilapidated, housing in proximity to bus lines and stops (Glaeser, Kahn, & Rappaport, 2008). A hedonic price model of such housing would likely reveal very high marginal willingness to pay for proximity to transit, controlling for other housing characteristics. Although the high relative value of proximity to transit may be reflected in apparently high rents for people of modest means, relative to housing of similar character and quality not well served by transit, these rents often fail to induce new development or value creation. On the contrary, in many cases, given absolute income constraints, high rents for poor properties may work to keep those properties in place and in service long after the point where they might otherwise be desirable. It is
conceivable that where consumers’ willingness to pay premium prices for proximity to transit in excellent market locations may lead to new development, redevelopment, value creations, and concerns such as gentrification, similar willingness to pay for proximity to transit in weak market locations make result in substandard properties remaining in service and contributing to blight.
For purposes of calculating historical value creation or estimating prospective value creation in response to new transit investment, the hedonic price model may embody systematic selection bias. Where transit lines include alignments through areas that are undeveloped, abandoned (as may be the case with previously industrial urban areas), or have otherwise suffered disinvestment, hedonic price models may imply an overstatement of the value creation potential of market response to new infrastructure investment, or model results may be
misinterpreted in this way. Hedonic price models do not disaggregate and estimate relative values of characteristics or amenities, say proximity to transit stations, of office, retail, or residential buildings that go unbuilt. Hedonic price analyses of buildings proximate to transit stations evaluate only those which are or were economically and financially viable. They do not analyze buildings that go unbuilt because they are or would be dis-economic. To measure value creation in the aggregate we must capture changes in value of assets where value creation was modest or negative as well as those which benefitted significantly from new infrastructure investment as a result of accommodative market conditions. It is possible that new transit
infrastructure investment (and, perhaps, the land speculation and regulation that often accompany it) may indirectly impede private sector value creation in some locations while spurring it in others.
Bus rapid transit (BRT) and other value impact studies
impacts of light rail transit, is literature estimating value creation and/or other impacts associated with bus rapid transit (BRT).
Extensive study has been undertaken with respect to Bogota’s TransMilenio,
considered by many to be the most state-of-the-art BRT system in the world. TransMilenio is an extensive system operating 125 stations (of iconic design) along eleven corridors and 112.9 km. Recent studies have included land use impacts (Rodriguez, Vergel-Tovar, & Camargo, 2016); value premiums as a function of walking distance (time) from stations (Munoz-Raskin, 2010; Rodríguez & Targa, 2004); capitalization of BRT network expansions effects (Rodríguez & Mojica, 2009); land value impacts of BRT (Rodriguez & Mojica, 2008); planning for development in accommodation of BRT (Gakenheimer, Rodríguez, & Vergel, 2011); the relationship between urban form and station boardings (Estupiñán & Rodriguez, 2008); examination of the reciprocal relationship between BRT and the built environment in Latin America (Vergel-Tovar, 2016); and public transport investments and urban economic development (Heres, Jack, & Salon, 2014).
Other BRT studies examining development patterns (Cervero & Landis, 1997; Fogarty & Austin, 2011); inducement of TOD, or as prospectively cost-effective alternatives to LRT include: planning for BRT as a modal alternative to “Light Rail Lite” (Hoffman, 2008); leveraging TOD with BRT investment (Cervero & Dai, 2014); BRT and urban development (Rodriguez & Vergel, 2013); BRT as a substitute for LRT (Sislak, 2000); comparison of BRT and LRT fixed guideway systems (Biehler, 1989); a review of BRT literature (Deng & Nelson, 2011); real estate impacts from fixed rail and BRT (Kannan, 2011); and impact of bus transit centers on values of nearby single-family residential land in Houston, Texas (Lewis & Goodwin, 2012).
Light rail transit and transit-oriented development (LRT and TOD)
amenity-rich and features proximity to transit. Many multimodal features are included in TOD, including pedestrian and bicycle improvements. Numerous studies have demonstrated that under certain circumstances, TOD can command higher sales prices and rents for a variety of property types. The opportunity for value creation and subsequent value capture will vary by transportation network and station characteristics. Unique characteristics of each transit line and station area will influence the potential for value creation and capture (Song, 2002).
This study addresses value creation in proximity to LRT stations without explicit distinction between TOD, other forms of transit-influenced development, or station areas in which there has been little discernable transit-induced value creation at all. TOD, the value it can create, and the price premiums it can command, have garnered a great deal of attention and inspired a great deal of academic and commercial study. Although this study does not focus on TOD per se, the subject commands some acknowledgment. In many cases, some significant part of that value capitalized into real estate prices in proximity to transit stations may derive as much or more from TOD or TOD-like urban amenities as from transit accessibility itself (Song & Knaap, 2003).
TOD involves:
creating attractive, memorable, human-scale environs with an accent on quality-of-life and civic spaces. Increasingly, projects built around up-and-coming transit nodes, like Dallas’s Mockingbird Station, Portland’s Pearl District, and Metropolitan Chicago’s Arlington Heights, are targeted at individuals, households, and businesses seeking locations that are vibrant and interesting; these places usually have an assortment of restaurants, entertainment venues, art shops, cultural offerings, public plazas, and civic spaces” (Cervero, 2004).
investment. TOD often requires significant up-front investment in infrastructure and common amenities (Carlton, 2009). Many of the requirements for successful value creation within TOD fall outside the control of developers and require engagement, collaboration, and partnership with transit agencies and local governments (Hale, 2008; Hale & Charles, 2007; Hale, 2013). A great deal of cooperative engagement and strategic partnership is required in both planning and execution. A paradigm shift is needed “from current practice of small scope—ad hoc, technical solution driven— planning approach towards a new practice that considers a broad network scope—strategy driven— planning approach” (p. 1, Arts, Hanekamp, and Dijkstra, 2014). These considerations underpin the survey questions posed to transit agency officials in the present study regarding strategic engagement, value creation strategies, and transit agency goals and objectives.
Numerous studies have estimated the impact of TOD and/or specific elements of TOD on various classes of real property values. Examples include measuring the impact of suburban TODs on single-family home values (Mathur & Ferrell, 2013); development density (Litman, 2014); economic development impacts (Litman, 2010); and effects of pedestrian elements of TOD (Bartholomew & Ewing, 2011). In general, these studies have identified positive value creation or increased consumer marginal willingness to pay (price effects) related to TOD and many of its common attributes or constituent parts (Clifton, Ewing, Knaap, & Song, 2008).
Quantifying effects of proximity to light rail transit stations on assessed
valuation