The Effect of Patent Expiration on
Pharmaceutical Firms’ Research and
Development Decisions
Zachary Edwards
Honors Thesis
Thesis Advisors: Dr. Andrés Hincapié & Dr. Luca Maini
Faculty Advisor: Dr. Jane Fruehwirth
Approved by:
Dr. Andrés Hincapié
Dr. Luca Maini
Acknowledgement
I would first like to thank my advisors, Dr. Andrés Hincapié and Dr. Luca Maini,
for all the help and guidance that they have provided throughout this process. They
always knew what to do when something went wrong and encouraged me to continue
pushing forward. I have learned so much from them and am extremely grateful for
this opportunity. This would not have been possible without them.
I would also like to thank Dr. Jane Fruehwirth for guiding me and the rest of the
class through this process. She kept me on track, was always willing to help, and
pushed me to continue improving each draft.
Lastly I would like to thank Alexa Augone, Parag Vyas, my family, and all of my
The Effect of Patent Expiration on Pharmaceutical
Firms’ Research and Development Decisions
Zachary Edwards
Advisors: Dr. Andrés Hincapié & Dr.Luca Maini
UNC at Chapel Hill, Economics Department
This Draft: May 1, 2020
Abstract
How does the expiration of a pharmaceutical firms’ drug patent affect the
firms’ R&D decisions? We attempt to answer this question by combining data
from the FDA Orange Book dataset on drug patents with firm-level data from
the Pharmaprojects database. We utilize a logistic probability model to
de-termine how patent expiration affects the chances that a firm will undertake
certain actions to mitigate the negative effects that patent expirations have
on revenue streams. In doing so, we find that firms that are nearing patent
expiration begin testing of new products and seek new licensing opportunities
for existing products, rather than discontinue existing products.
Keywords: Patent Expiration, R&D Investments, Drug Development,
1
Introduction
The process by which pharmaceutical firms develop new products is complex,
expensive, and sensitive to external influences. Given the high costs and risks
as-sociated with research and development (R&D), the ways in which pharmaceutical
firms craft their investment decisions are of utmost importance. This process has
resoundingly positive effects on society. For instance, when looking at improvements
in human health created between 1932 and 1982, Fuchs (1982)(2) finds that most
improvements stem from R&D’s ability to produce new drugs. More recent research
suggests that the overall gains to society from pharmaceutical R&D are large
(Licht-enberg, 2001, 2004, 2007)(7; 8; 10; 9). Moreover, due to the costs and risks associated
with pharmaceutical R&D, patent protections are critical in promoting new R&D
because they ensure firms the exclusive right to develop and sell a product (Sachs
2018)(11). However, it is imperative that patents do not provide too much
protec-tion, as this could result in a decrease in innovation by discouraging firms from taking
on risks associated with R&D. As such, there is a clear link between balancing the
incentives that patents provide to pharmaceutical firms and the benefits reaped from
innovation.
Thus, the present study seeks to measure the effect that patent expirations have
on R&D portfolios of pharmaceutical firms. We do this by utilizing a logistic
proba-bility model, regressing various actions that a pharmaceutical firm might take
(devel-oping a new product, launching a product in different countries, etc.) on a window
of time surrounding the expiration of one of the firms’ patents. We conduct these
obtained from the Pharmaprojects database.
Although firms know ahead of time when patents expire, we take patent
expi-rations to be exogenous since firms cannot control how long patents last and when
they expire, as patent laws are set by the Federal Government. Additionally, firms
are incentivized to file patents on new drugs as soon as possible to ensure that their
idea is protected by the exclusivity that a patent provides. Thus, since firms can
control when they apply for a patent, but not when it expires, and firms file patents
as soon as possible to protect their ideas, not to choose a specific expiration date,
we are able to take the date of patent expiration as an exogenous variable. This
allows us to extract a causal relationship between patent expiration and firms’ R&D
decisions. Unlike patent expiration, firms’ responses, however, are endogenous since
firms actively decide what actions to take and when to take them.
While numerous papers have explored how firms make R&D decisions, many have
focused on how these decisions are made in response to exogenous shocks, such as
policy decisions or the successes and failures of other drugs. For example, Krieger, Li,
and Thakor (2018)(4) find that FDA public health advisories drastically increase the
likelihood that firms acquire R&D from other firms, rather than conducting their
own in-house trials. Similarly, Krieger (2016)(Krieger) finds that pharmaceutical
firms often pare back their R&D investments in response to news of a competitor’s
failure. However, there has been little research into how other factors, such as patent
expiration, affect firms’ R&D decisions. Although patent expirations are similar to
the aforementioned shocks, there is a key difference between them. When firms file
measures to prevent negative outcomes associated with patent expirations, such as
the negative impact to revenue streams resulting from the loss of exclusivity. This
is not the case for shocks like Public Health Advisories, which are assumed to be a
surprise to firms.
Based on standard economic theory, if a firm realizes that they are going to lose
a profitable revenue stream to patent expiration, they will likely take measures to
either extend the patent, create new in-house R&D, or attempt to acquire profitable
R&D from an outside source. The specific strategy that a firm employs is highly
dependent on their previous experiences in the market. For example, a firm that had
previously unsuccessfully attempted to enter the market for cancer treatment drugs
may instead opt to develop a drug to treat diabetes, given their previous failure.
Furthermore, if a firm has a successful patent, they may try to gain more market
share by developing a new way to administer the drug, extending the duration of
the patent, and by acquiring complementary R&D from another firm. The timing
of a firm’s actions is also imperative. Since R&D is conducted over long periods
of time, a forward-looking firm that begins developing a strategy before nearing
patent expiration will likely be more successful than a myopic firm that only begins
innovating after their patent expires. The present study seeks to explore if patent
expiration affects the way that firms act and how this aligns with what we expect.
This paper explores the firms’ decision-making processes both before and after
the expiration of one of their patents. For example, if a pharmaceutical firm knows
that the patent for one of their major products is nearing expiration, does that
options to develop a completely new product, attempt to acquire R&D from another
firm, or do they do something completely different? In our analyses, we attempt
to leverage the stage of R&D, market targeted by R&D, geographical location of
the firm, and the type of patent to determine what actions different firms take in
response to the loss of patent exclusivity.
The paper proceeds as such: we provide a literature review in section 2. Then
section 3 details the data we use. Section 4 explains the empirical model. Section 5
provides results and section 6 concludes.
2
Literature Review
There has been significant research on internal capital markets that seeks to
dis-cover how shocks to firms’ products affect investment across different products (Stein,
1997; Lamont 1997; Shin and Stulz, 1998; Scharfstein and Stein, 2000; Bertrand and
Mullainathan, 2005)(Stein; 13; 12; 1). For example, Lamont (1997)(6) finds that
when oil prices fall, oil companies significantly decrease their investment in their
non-oil subsidiaries. This suggests that the negative shock, a decrease in oil prices,
affects the firm in ways that perhaps were not expected.
While this paper is related to existing research on internal capital markets, it
dif-fers in that much of this existing research is related to industries, such as energy and
transportation, that require significant physical capital. In contrast, pharmaceutical
firms do not rely as heavily on physical capital, and instead face significant
capital and heightened uncertainty may result in pharmaceutical firms taking vastly
different actions when faced with a shock. For example, if demand for a
pharmaceu-tical firm’s primary drug suddenly falls, they may decide to quickly pivot and alter
their drug portfolio by acquiring the rights to market a different drug, whereas an
energy firm may not be able to make such a pivot given the high cost of physical
capital in this industry.
Additionally, pharmaceutical firms make decisions not only between different
products, but also along the whole development period of individual products (Krieger
et al., 2018)(4), unlike decisions made in the internal capital markets literature. This
can be seen through the long, arduous process of drug approval, which requires a
se-ries of three human trails, each of which is more stringent than the last. Throughout
this process, the pharmaceutical firm must make decisions about an individual drug
that can ultimately determine whether it gets approved to be marketed. For these
reasons, Krieger et al. find that while research in capital markets suggests that firms
pare back investment after shocks, pharmaceutical firms increase R&D when faced
with uncertainty.
Krieger et al. (2018)(4) utilize FDA Public Health Advisories (PHAs) as a shock
to pharmaceutical firms’ pipelines, and then examine how the firms change their drug
portfolios in response. Using a difference-in-difference approach, they find that firms
that experience a PHA respond quickly, with a 21% increase of R&D expenditure,
often in the form of R&D acquisition from other firms. We complement research
conducted by Krieger et al. by examining the effect of patent expiration on R&D
Other research related to the current paper includes Krieger (2017)(3) in which
he analyzes the effect that failure of firms in the pharmaceutical industry has on the
decision of competitors to discontinue similar R&D. He uses a difference-in-difference
approach to find that firms are most sensitive to the failure of other firms that are
in the same market and technology area.
Furthermore, Krieger suggests that firms often overreact to failures reported by
very closely related firms. Krieger’s research addresses these spillover effects and
allows for differences in the ways in which firms interpret the failure of a competitor.
He finds that firms do, in fact, use news of a competitor’s failure to influence their
own investment decisions, specifically when the competitor is situated in the same
market and technology space. He also finds that information shocks from a firm’s
closest competitor do, in fact, result in the overreaction of a firm by means of paring
back their own R&D.
Although this is related to the current paper in that it analyzes the effects of
an unexpected shock (failure of a competitor’s drug) on a firm, it differs in that the
shock and subsequent reaction are experienced by two different firms. Instead of
examining spillover effects that a failure of a drug has on other firms, we specifically
look at how a firm reacts to the expiration of one of its own drug patents, rather
3
Data
3.1
FDA Orange Book
The data for this study comes from two different sources, the first of which is
the FDA’s Orange Book database. The Orange Book is a list of United States
patents for drugs that have been tested and approved for use in United States the by
the FDA. The patent data that we use from this dataset ranges from 1990-2014. In
addition to patent number and the edition(s) of the Orange Book in which patents are
included, the dataset also includes patent expiration dates for each patent number,
and indicator variables to denote whether the patent has a drug substance (DS)
claim, a drug product (DP) claim, or both.
If DS is 1, then the patent was a drug substance claim, if DP is 1, then it is a
drug product claim, and vice versa. These two types of patents are fundamentally
different, but not mutually exclusive, meaning that a drug can have both a DS and
DP claim. While a DS claim protects the active ingredient of a drug, a DP claim
protects the delivery method of the substance. For example, a patent on a drug that
treats diabetes may have a DS claim on gliclazide, the active ingredient, and also a
DP claim on the tablet form that it comes in. Therefore, the type of patent may
have an effect on how pharmaceutical firms react to its expiration.
3.2
Pharmaprojects
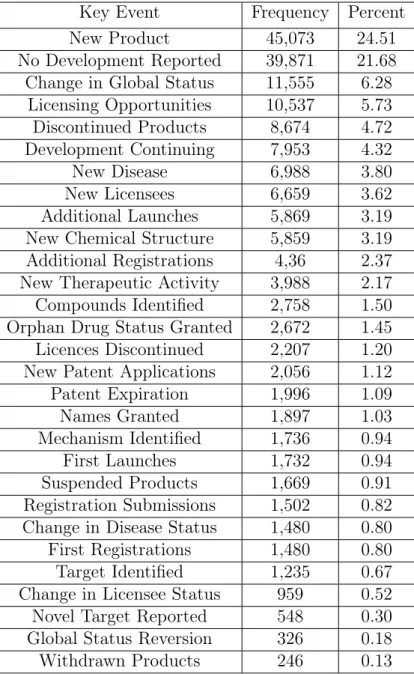
Our firm-level data comes from the Pharmaprojects database, which includes
events” for specific drugs. These key events are actions that firms may take in
response to patent expiration. For example, one event that a firm may undertake
is "new product", meaning that the firm has a product that is starting to undergo
clinical trials. Since these events are not mutually exclusive, and firms may have
multiple drugs in their portfolio, a single firm may undertake several of these actions
at once or over a period of time. The full list of key events and their relative
Table 1: Key Events with Relative Frequencies
Key Event Frequency Percent
New Product 45,073 24.51
No Development Reported 39,871 21.68
Change in Global Status 11,555 6.28
Licensing Opportunities 10,537 5.73
Discontinued Products 8,674 4.72
Development Continuing 7,953 4.32
New Disease 6,988 3.80
New Licensees 6,659 3.62
Additional Launches 5,869 3.19
New Chemical Structure 5,859 3.19
Additional Registrations 4,36 2.37
New Therapeutic Activity 3,988 2.17
Compounds Identified 2,758 1.50
Orphan Drug Status Granted 2,672 1.45
Licences Discontinued 2,207 1.20
New Patent Applications 2,056 1.12
Patent Expiration 1,996 1.09
Names Granted 1,897 1.03
Mechanism Identified 1,736 0.94
First Launches 1,732 0.94
Suspended Products 1,669 0.91
Registration Submissions 1,502 0.82
Change in Disease Status 1,480 0.80
First Registrations 1,480 0.80
Target Identified 1,235 0.67
Change in Licensee Status 959 0.52
Novel Target Reported 548 0.30
Global Status Reversion 326 0.18
We use these as the outcome variables in our analyses to find what actions firms
are taking near the time of patent expiration. Of the events listed above, we choose
to run our regressions on 10 of the most frequent, namely, new product, additional
launches, new patent application, first launches, change in global status, licensing
opportunity, new licensees, orphan drug status granted, product discontinued, and
licenses discontinued. By exploring which of these events firms undertake near the
time of patent expiration, we can get a sense of what types of actions firms take to
mitigate the negative effects of patent expiration.
We utilize Pharmaprojects data from 1990 through 2015. The variables that we
use in our analyses include the name of the pharmaceutical firm, the name of their
drug(s), the diseases that the drug is used to treat, information about the firm’s
location, and a list of key events that the firm has undertaken on corresponding "key
event dates".
3.3
Summary Statistics
The data is organized by year and by quarter within each year. We use quarterly
data from 1990 through 2014. We include figures detailing the change in number of
several of the most frequent and salient, as they relate to our analyses, key events
over time. These include new product, licensing opportunities, and discontinued
400
600
800
1000
Number of New Products
1990 1995 2000 2005 2010 2015 Year
Change in New Products over Time
Figure 1
Figure 1 shows the change in number of new products over time. Although the
number of new products seems to fluctuate from year to year, we note that it never
falls below 400. This suggests that while the number of new products that a firm
develops may vary from year to year, developing new products seems to be one
main way in which firms attempt to grow their drug portfolios and their revenues.
In addition, Figure 2 shows the number of licensing opportunities the firms in our
sample possess over time. Similarly to new products, licensing opportunities appear
to fluctuate throughout our sample period. Nevertheless, they remain one of the
0
50
100
150
200
250
Number of Licensing Opportunities
1990 1995 2000 2005 2010 2015
Year
Change in Number of Licensing Opportunities over Time
Figure 2
In addition to new products and licensing opportunities, we also include Figure
3, which gives a sense of how the number of discontinued products changes over
our sample period. We note that the number of discontinued products dramatically
decreases from 1990 through 2015. While the changes between 1990 and 2010 may
just be the result of changes in firm behavior, the decline in new products, licensing
opportunities, and discontinued products after 2010 may be related to Figure 4, which
shows the change in the number of firms in our sample. This figure suggests that the
number of firms in our sample each year fluctuates, and decreases significantly after
fewer actions being taken in these years.
100
200
300
400
Number of Discontinued Products
1990 1995 2000 2005 2010 2015
Year
Change in Number of Discontinued Products over Time
1500
2000
2500
3000
3500
4000
Number of Firms
1990 1995 2000 2005 2010 2015
Year
Change in Number of Firms over Time
Figure 4
We next document the number of patent expirations per year in addition to
sum-mary statistics for the number of patent expirations per firm over the whole sample.
The average number of expirations per firm is 8.717, with a standard deviation of
15.432. Since we only included firms with at least one patent expiration in our
sam-ple, the minimum is 1 and the maximum is 93. The large standard deviation in
patent expirations makes sense since some larger firms will have larger drug
portfo-lios, more patents, and more patent expirations. The large increase in the number
of patent expirations over time in Figure 5 is likely related to two things, namely,
having multiple patents for different aspects of the same product.
Variable Mean Std. Dev. Min Max
Patent Expirations 8.717 15.432 1 93
0
50
100
150
Number of Patent Expirations
1990 1995 2000 2005 2010 2015
Year
Change in Number of Patent Expirations over Time
Figure 5
3.4
Background
After a pharmaceutical firm’s patent expires, and they lose exclusivity, the drug
becomes part of public domain, and the market for the drug generally becomes
all firms in the market. Determining the length of this period of exclusivity, however,
is a difficult task. Lawmakers must grant enough exclusivity to promote innovation
of novel drugs by pharmaceutical firms, while not granting so much exclusivity that
the firm no longer has an incentive to produce new innovations. The current state
of patent expiration laws dictate that the majority of patent types expire 20 years
after the application for the patent is filed. However, there are ways to extend an
existing drug patent, such as making developments on the existing drug.
While the opportunity to extend an existing patent may encourage some
phar-maceutical firms to continue developing newer and better version of their drugs,
this can also be taken advantage of. For example, a firm can change the delivery
method of the drug from an injection to a capsule, and be granted an extension of
their exclusivity over the drug. The existing system of issuing 20 year patents with
opportunities for exclusivity extensions may encourage innovation, or it may stifle
innovation by allowing firms to simply make small changes to existing drugs. Given
that a goal of the system is to promote innovation of novel drugs, and that the effects
of patents and their expiration on the whole are hard to measure, it is important that
we analyze how these firms act when nearing the end of one of their drug patents.
4
Empirical Model
To identify the impact that patent expiration has on a firms’ R&D decisions, the
current study builds upon the empirical model in Krieger et al(4). While Krieger
Advisories affect various outcome variables including R&D, earnings, cash, and debt,
we employ a logistic probability model with time and firm fixed effects that allows
us to predict how patent expiration affects the probability that a firm will undertake
some of the most frequent key events listed in section 3.2 in order to mitigate losses
associated with patent expiration. Also, we only include firms that have experienced
at least one patent expiration in our sample. By excluding firms that have no patent
expirations, but may have undertaken events, we reduce the bias of our estimators in
order to obtain a more causal relationship between patent expiration and our event
variable.
Of the 29 events in the original dataset, we run regressions on new product,
additional launches, new patent application, first launches, product discontinued,
licenses discontinued, change in global status, licensing opportunity, new licensees,
and orphan status granted. We selected these based on how frequently they occur as
well as how salient they are in addressing the question of how patent expiration affects
a firms’ actions. For example, we choose to omit names granted and withdrawn
products, since names granted does not indicate a change on the part of the firm and
withdrawn products occurs only 246 times.
We utilize the model:
Eventi,t =α+βExpi,t−3tot+.5+γControlsi,t+µi+λt+i,t (1)
Where Event takes a value of 1 if firmi undertook the specific action in time t and 0
otherwise. Likewise, βExpi,t−3tot+.5 takes a value of 1 if firmi experienced a patent
window of three years prior to and six months after patent expiration, which allows
us to identify which actions a firm is taking in response to a specific patent expiration.
Additionally, we add firm and time fixed effects, µ and λ. We include these fixed
effects because we expect that there are some variables that we are not able to control
for, like firm size, that could bias our estimators. For example, larger firms may take
more actions, meaning that, without controlling for firm size, we may overestimate
the effect that patent expiration has on firms’ actions. Thus, these fixed effects are
useful in controlling for heterogeneity between firms and trends that affect the R&D
of all firms over time.
In addition to analyzing the behavior of firms throughout the entire window, we
also utilize a second model by which we regress each of the 10 events on three, two,
and one year(s) before and six months after after patent expiration to determine if
firms take action in a specific year near patent expiration, or if their activity is more
continuous throughout the entire window. In doing so, we utilize an equation similar
to equation (1), but with separate terms for each year:
Eventi,t =α+β1Expi,t−3 +β2Expi,t−2+β3Expi,t−1+β4Expi,t+.5+γControlsi,t +µi+λt+i,t
(2)
In order to analyze the effect of public health advisories on their output variables
of choice, Krieger et al. (2018)(4) utilize a window of t-3 to t years before the
public health advisory was issued. Similarly, our model examines the effect of patent
expiration on firm’s R&D decisions. Since utility patents generally last for 20 years
analyze firms’ actions within the window of time three years before and six months
after a patent expires. This allows us to capture the effects of patent expiration
both before and after the expiration occurs. We do not want to make the window
too wide, for fear of capturing actions being taken by a firm that are unrelated to
the expiration of one of their patents. This could result in biased estimators, which
would take away from the predictive power of our estimates. Additionally, since the
probability that a firm is taking actions regarding their drug portfolio decreases as
we move further out from the date of expiration, we expect that there will be a large
number of years when no key events are reported, and some years (closer to the date
of the patent expiration) when the firms may undertake several actions.
5
Results
Our analyses employ a logistic probability model to predict the effect that a
patent expiration has on pharmaceutical firms’ R&D decisions. We regress each of the
actions outlined in section 4 on both our entire window, and the window broken down
by year, as in equations (1) and (2). This allows us to discern how the knowledge
of a patent expiration changes the probability that a firm will undergo each of the
actions. The tables below group the actions into three categories based on when in
the drug development process they most often occur: initiation, intermediate, and
termination. To fit each event into a category, we sort our data by firm, drug, and
date, then count the number of times that each event appears at the beginning,
sort the events into each of the categories based on how frequently each occurs at
each point in the development process. In doing so, we find that new product,
new patent application, and first launches are initiation events. Change in global
status, licensing opportunities, new licensees, additional launches, and orphan drug
status granted are intermediate events. While discontinued product and discontinued
licenses are termination events. This allows us to to split up the presentation of our
results into 3 sections, one for each category.
The tables below contain 5 columns. The first 4 are the results from equation (2)
in section 4, where we regress each event on 3, 2, and 1 year before patent expiration
and 6 months after patent expiration. Column 5 comes from equation (1) in section
4, and shows the effect of patent expiration throughout the entire window on each
event. The estimates in all of the tables are marginal effects, and as such can be
interpreted as how much more or less likely a firm is to undergo each of the actions,
5.1
Initiation Events
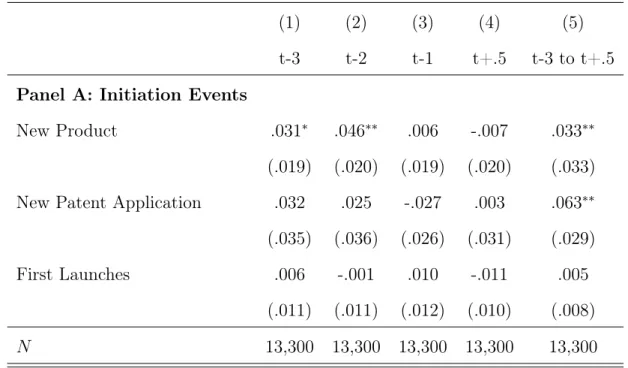
Table 2: Logit Model for Effect of Patent Expiration on Various Initiation Events
(1) (2) (3) (4) (5)
t-3 t-2 t-1 t+.5 t-3 to t+.5
Panel A: Initiation Events
New Product .031∗ .046∗∗ .006 -.007 .033∗∗
(.019) (.020) (.019) (.020) (.033)
New Patent Application .032 .025 -.027 .003 .063∗∗
(.035) (.036) (.026) (.031) (.029)
First Launches .006 -.001 .010 -.011 .005
(.011) (.011) (.012) (.010) (.008)
N 13,300 13,300 13,300 13,300 13,300
Standard errors in parentheses
∗ p <0.10,∗∗ p <0.05,∗∗∗ p <0.01
First, we examine the effect of patent expiration on 3 initiation events. We find
that, throughout the entire window extending three years before to six months after
patent expiration, firms are slightly more likely to undertake an initiation action given
the knowledge that one of their patents is expiring. For example, firms are .5% more
likely to attempt first launches, and 3.3% more likely to have a new product enter
the testing phase, which is statistically significant at the 95% level. Additionally,
firms are 6.3% more likely to submit a new patent application during this window,
4, we find that two years before patent expiration is the period in which a firm is
most likely to have a new product enter testing.
The statistically significant, positive coefficients on new product and new patent
application are somewhat surprising. A product that has recently entered testing is
roughly a decade away from its release to the public, and the issuance of a new patent
application represents a drug that is likely even further from release. This means
that the new products that the firm is creating and the patent applications that
the firm is submitting will not result in a source of revenue by the time their patent
expires. Given the limitations associated with the length of our window, as discussed
in section 4, we only observe actions up to three years before patent expiration. As
such, we do not expect these to be the primary ways in which firms mitigate the
loss of revenue associated with patent expiration in the window of time we examine.
Instead, these are longer-term solutions that may yield payoffs in the years following
patent expiration.
Instead of releasing new products to testing and submitting new patent
applica-tions, we expect that the initiation event that a firm experiencing impending patent
expiration is most likely to implement is the first launch of a drug that has been
approved to be released by the FDA. Our results, however, indicate otherwise. We
find that first launches are not an avenue that firms seem to be utilizing in order
to make up for revenues lost by patent expiration. While the coefficient on first
launches in column 5 is positive, it is small and statistically insignificant. This, too
is surprising, since launching a new product is a potential way to quickly create new
A possible explanation for these results are that firms are simply taking initiation
actions later than we expected, suggesting that they do not act in this way to quickly
make up for revenues that they lose from patent expiration. Instead, they may take
a mixture of initiation and intermediate actions that both mitigate the short-term
losses in revenue associated with patent expiration, in addition to building their
drug portfolio in the long-run. Alternatively, these findings may also be linked to
limitations of our window selection. In this way, we could be detecting actions in
year t that a firm undertakes to mitigate losses of revenue associated with a patent
expiration in yeart+10, for example. However, the former explanation is preferable
since we take patent expiration to be exogenous. Since firms are profit maximizing
and tend to prioritize current profits over future profits, we argue that, firms likely
do not decide when to file a patent based on the date that it will expire, but instead
file it as soon as they can to protect their intellectual property. In addition, once
a patent is filed, patent laws, not firms, decide when patents expire. Thus, we take
patent expirations to be exogenous, suggesting that firms undertake a mix of short
and long-term solutions to solve the problem of patent expiration.
5.2
Intermediate Events
In addition to analyzing the effect that patent expiration has on the probability
of a firm undertaking an initiation event, we also examine the effect that it has on
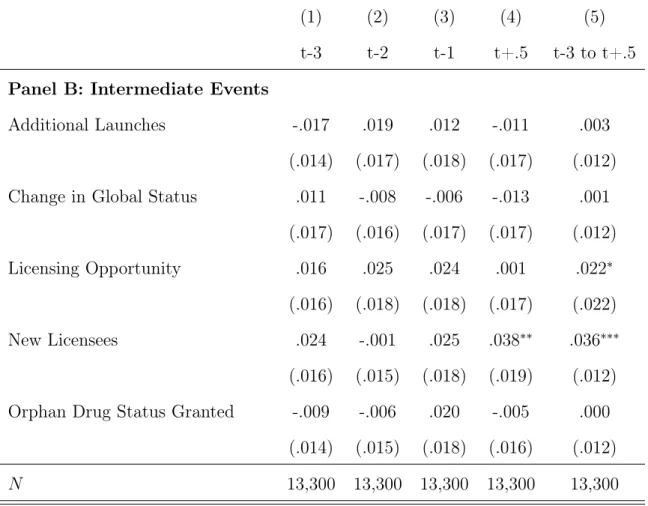
Table 3: Logit Model for Effect of Patent Expiration on Various Intermediate Events
(1) (2) (3) (4) (5)
t-3 t-2 t-1 t+.5 t-3 to t+.5
Panel B: Intermediate Events
Additional Launches -.017 .019 .012 -.011 .003
(.014) (.017) (.018) (.017) (.012)
Change in Global Status .011 -.008 -.006 -.013 .001
(.017) (.016) (.017) (.017) (.012)
Licensing Opportunity .016 .025 .024 .001 .022∗
(.016) (.018) (.018) (.017) (.022)
New Licensees .024 -.001 .025 .038∗∗ .036∗∗∗
(.016) (.015) (.018) (.019) (.012)
Orphan Drug Status Granted -.009 -.006 .020 -.005 .000
(.014) (.015) (.018) (.016) (.012)
N 13,300 13,300 13,300 13,300 13,300
Standard errors in parentheses
The above table displays regression results from five different intermediate
ac-tions, with columns 1 through 4 again representing equation (2) and column 5
repre-senting equation (1). One striking result is that fromt-3 tot+1, firms that experience
patent expiration are 3.6% more likely to find new licensees, which is significant at
the 99% level, and 2.2% more likely to seek licensing opportunities, which is
signif-icant at the 90% level. The positive signs on these values may suggest that some
firms attempt to license their drugs to other distributors in order to attract a wider
audience and market their drug to more people. Thus, a pharmaceutical company
may seek to replace lost revenue streams associated with patent expiration by
seek-ing new licensees to promote existseek-ing drugs, rather than by attemptseek-ing additional
launches or marketing these drugs globally.
This finding is in line with observations from the initiation events results. What
we see is that firms are more likely to undertake actions that will have payoffs long
after patent expiration, in addition to undertaking actions that have more
immedi-ate payoffs. The long-term actions, as discussed above, are new product and new
patent application, while the short-term actions are licensing opportunities and new
licensees. So, what we see is that firms that have patents expiring are more likely to
attempt to mitigate losses in revenue in the short-term by licensing existing products,
while at the same time developing new drugs that can later replace the product for
5.3
Discontinuation Events
Lastly, we analyze the effect that patent expiration has on the discontinuation
of products and licenses. Similarly to our other two analyses, columns 1 through 4
represent results from equation (2) of section 4, whereas column 5 represents results
from equation (1) of section 4.
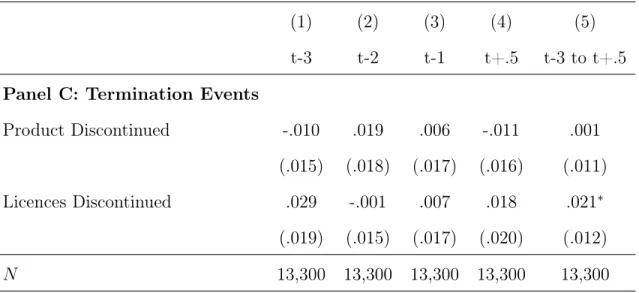
Table 4: Logit Model for Effect of Patent Expiration on Various Termination Events
(1) (2) (3) (4) (5)
t-3 t-2 t-1 t+.5 t-3 to t+.5
Panel C: Termination Events
Product Discontinued -.010 .019 .006 -.011 .001
(.015) (.018) (.017) (.016) (.011)
Licences Discontinued .029 -.001 .007 .018 .021∗
(.019) (.015) (.017) (.020) (.012)
N 13,300 13,300 13,300 13,300 13,300
Standard errors in parentheses
∗ p <0.10,∗∗ p <0.05,∗∗∗ p <0.01
We find that three, two, and one year prior to patent expiration, six months
after patent expiration, and throughout the entirety of this window, firms largely do
not seem to react to patent expiration by discontinuing existing products. This is
somewhat surprising, since discontinuing a product should reduce a firm’s revenue,
product discontinued to be negative, since this would suggest that firms are less
likely to discontinue a product in the years leading up to patent expiration, and
would instead attempt to find additional sources of revenue. However, we find that
firms do not seem to react along this dimension.
There is, however, a sizeable effect on discontinuing licenses that is statistically
significant at the 90% level. Firms that experience patent expiration are 2.9% more
likely to discontinue a license three years before patent expiration and 2.1% more
likely to do so throughout the entirety of the window. This is surprising, since in
Table 3 we see that firms are more likely to seek and obtain new licenses. This
may signal that near patent expiration, firms both discontinue licenses for drugs
that are near patent expiration while simultaneously searching for new licenses on
existing drugs to make up for this loss of revenue. This, as we discussed before,
might mean that firms take multiple actions to mitigate negative effects of patent
expiration by, for example, releasing a new product to testing, finding new licensees
for existing products, and discontinuing licenses for old products. Aside from these
estimators, however, many of the individual year estimators have relatively small and
insignificant values, meaning that we cannot confidently say that they are different
from zero.
5.4
Robustness
For robustness, we change both the length of the window around patent expiration
that we use in our regression as well as the range of dates that we utilize in our model.
check to see if three years prior to and six months after patent expiration is sufficient
to examine actions taken by firms. Although the results do not materially change
when expanding the window by one or two years, there is a risk that by expanding the
window any more, some firms will always be included as "facing patent expiration",
which could skew results. For example, by extending the window to include ten years
before patent expiration and six months after, nearly all of the events gain a positive
coefficient that is statistically significant, in most cases, at the 90% level or higher.
By extending the window to ten years prior to patent expiration, the majority of years
become "patent expiration" years, meaning that almost every action that firms take
is attributed to a patent expiration. Thus, by utilizing the window of three years
before to 6 months after patent expiration, we may be underestimating the effect
of patent expiration on firms’ R&D decisions. In addition to adjusting the window,
we also restrict the range of dates that we use in our analyses, which results in
largely the same results. Lastly, we also utilize a linear probability model to test the
robustness of the logistic probability model and find that results do not materially
change when employing the linear probability model. Overall, the main results hold
after extending the event window to four and five years prior to expiration in addition
to changing the range of included dates.
6
Conclusion
This paper evaluates the effect that patent expiration has on pharmaceutical
and private firm-level data from the Pharmaprojects database, we analyze what
ac-tions these firms take when facing the negative effects of patent expiration. We find
that in the window of time three years prior to and six months after patent
expira-tion, pharmaceutical firms that face patent expiration seem to be more likely to start
trials on new products, submit new patent applications, seek new licensing
opportu-nities, and discontinue old licenses. This evidence is somewhat consistent with our
expectations, with two main exceptions. First, in addition to taking actions to
im-mediately increase revenues, firms also undertake longer-term actions that have the
possibility of yielding revenue after patent expiration. Second, firms that experience
patent expiration are not less likely to discontinue products in the years leading up
to the expiration. Overall, our findings support anecdotal evidence that finds that
firm managers often take whatever actions they find necessary to make up for the
revenue lost when a patent expires, which sometimes includes both initiation and
intermediate events.
These findings are relevant to prior literature on internal capital markets in
ad-dition to related research on how pharmaceutical firms react to negative shocks,
including Public Health Advisories and the failure of adjacent firms. Much of this
past literature finds that these negative shocks are linked to an increase of R&D
ex-penditure by pharmaceutical firms, something that the current study corroborates.
We also conduct robustness checks in the form of changing the window of time around
patent expiration that we use in our regressions as well as shortening the range of
dates we include. Overall, these changes yield results similar to our main analyses.
this research is also relevant to the formation of patent laws in the United States.
Since one goal of the patent system is to maximize innovation, it is crucial that we
evaluate how the current system achieves this goal. For example, we find that the
negative effects of a patent expiration spur firms to file new patent applications and
seek new licensing opportunities. As such, this may suggest that the current system
motivates firms to innovate and produce novel drugs. While this finding may be
relevant to policy makers insofar that it may be used to motivate future changes to
the current US patent system, there is still a large gap in the literature on how patent
expirations affect pharmaceutical firms’ R&D decisions that should be bridged before
References
[1] Bertrand, M., Chugh, D., and Mullainathan, S. (2005). Implicit discrimination.
American Economic Review, 95(2):94–98.
[2] Fuchs, V. (1980). Time Preference and Health: An Exploratory Study. Number
w0539.
[3] Krieger, J., Li, D., and Papanikolaou, D. (2017). Developing novel drugs. SSRN
Electronic Journal.
[4] Krieger, J., Li, X., and Thakor, R. T. (2018). Find and replace: Ramp;d
invest-ment following the erosion of existing products. SSRN Electronic Journal.
[Krieger] Krieger, J. L. Trials and terminations: Learning from competitors’ rd
failures. page 85.
[6] LAMONT, O. (1997). Cash flow and investment: Evidence from internal capital
markets. The Journal of Finance, 52(1):83–109.
[7] Lichtenberg, F. R. (2001). Are the benefits of newer drugs worth their cost?
evidence from the 1996 meps. Health Affairs (Project Hope), 20(5):241–251.
[8] Lichtenberg, F. R. (2004a). Sources of u.s. longevity increase, 1960–2001. The
Quarterly Review of Economics and Finance, 44(3):369–389.
[9] Lichtenberg, F. R. (2007). Benefits and costs of newer drugs: an update.
[10] Lichtenberg, J. (2004b). Experience and inference: how far will science carry
us? Journal of Analytical Psychology, 49(2):133–142.
[11] Sachs, R. E. (2018). The uneasy case for patent law. Michigan Law Review,
117(3):499–545.
[12] Scharfstein, D. S. and Stein, J. C. (2000). The dark side of internal capital
mar-kets: Divisional rent-seeking and inefficient investment. The Journal of Finance,
55(6):2537–2564.
[13] Shin, H.-H. and Stulz, R. M. (1998). Are internal capital markets efficient? The
Quarterly Journal of Economics, 113(2):531–552.
[Stein] Stein, J. Internal capital markets and the competition for corporate resources
7
Appendix
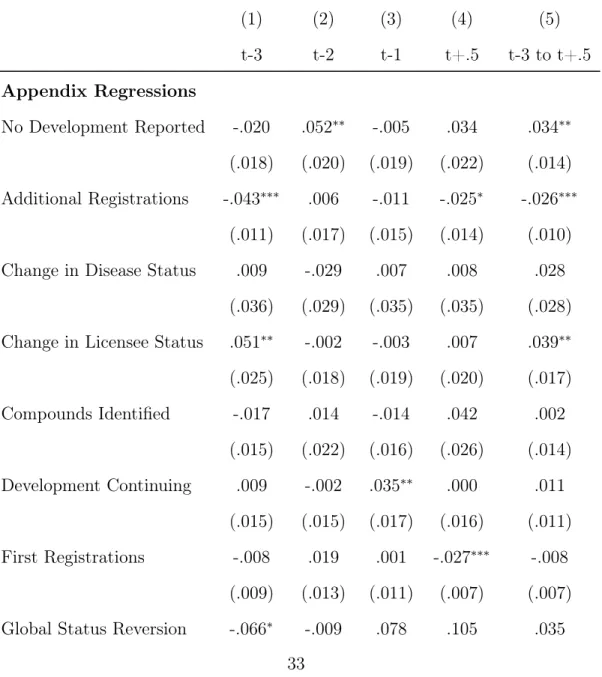
Below is a table showing the effect of patent expiration on the key events we did
not include in the main analyses.
Table 5: Logit Model for Effect of Patent Expiration on Various Events Not Included in Main Analyses
(1) (2) (3) (4) (5)
t-3 t-2 t-1 t+.5 t-3 to t+.5
Appendix Regressions
No Development Reported -.020 .052∗∗ -.005 .034 .034∗∗
(.018) (.020) (.019) (.022) (.014)
Additional Registrations -.043∗∗∗ .006 -.011 -.025∗ -.026∗∗∗
(.011) (.017) (.015) (.014) (.010)
Change in Disease Status .009 -.029 .007 .008 .028
(.036) (.029) (.035) (.035) (.028)
Change in Licensee Status .051∗∗ -.002 -.003 .007 .039∗∗
(.025) (.018) (.019) (.020) (.017)
Compounds Identified -.017 .014 -.014 .042 .002
(.015) (.022) (.016) (.026) (.014)
Development Continuing .009 -.002 .035∗∗ .000 .011
(.015) (.015) (.017) (.016) (.011)
First Registrations -.008 .019 .001 -.027∗∗∗ -.008
(.009) (.013) (.011) (.007) (.007)
(.035) (.051) (.079) (.110) (.043)
Mechanism Identified .007 .029 .010 -.001 .029
(.025) (.027) (.025) (.028) (.020)
Names Granted .007 .043 -.001 .017 .023
(.022) (.027) (.023) (.026) (.017)
New Chemical Structure .002 .068∗∗∗ .001 -.004 .026∗∗
(.017) (.020) (.018) (.018) (.013)
New Disease .014 .000 -.001 .021 .017
(.018) (.018) (.018) (.020) (.017)
New Therapeutic Activity .014 .008 .001 .031 .023∗
(.017) (.016) (.016) (.019) (.012)
Novel Target Reported -.049 -.001 .057 .069 .021
(.064) (.080) (.083) (.088) (.070)
Registration Submission -.017∗∗ .009 .029∗∗ .017 .010
(.008) (.012) (.014) (.014) (.008)
Suspended Product .047 .027 .019 .017 .010
(.032) (.029) (.028) (.030) (.016)
Withdrawn Product .001 .034 -.023 .043 .001
(.041) (.051) (.041) (.060) (.033)
N 13,300 13,300 13,300 13,300 13,300
95% confidence intervals in brackets
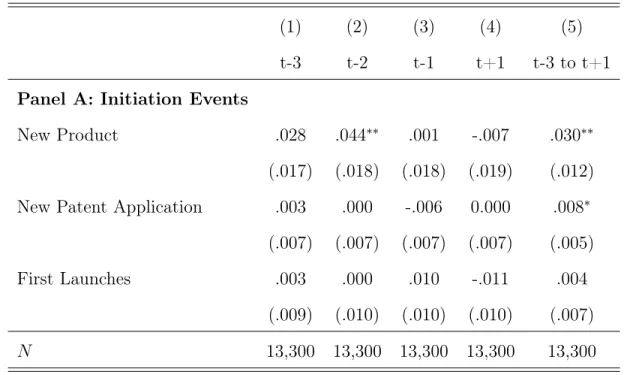
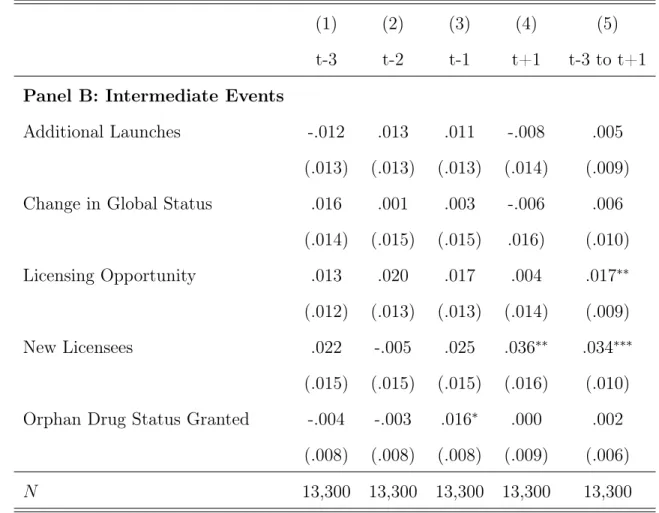
For robustness, we also include the same analyses we run in the main results
section, but utilizing a linear probability model instead of a logistic probability model.
The outcomes are very similar to the main analyses, suggesting that our results are
robust to different types of probability models. The results of the linear probability
model are included below.
Table 7: Linear Probability Model for Effect of Patent Expiration on Various Initi-ation Events
(1) (2) (3) (4) (5)
t-3 t-2 t-1 t+1 t-3 to t+1
Panel A: Initiation Events
New Product .028 .044∗∗ .001 -.007 .030∗∗
(.017) (.018) (.018) (.019) (.012)
New Patent Application .003 .000 -.006 0.000 .008∗
(.007) (.007) (.007) (.007) (.005)
First Launches .003 .000 .010 -.011 .004
(.009) (.010) (.010) (.010) (.007)
N 13,300 13,300 13,300 13,300 13,300
Standard errors in parentheses
Table 8: Linear Probability Model for Effect of Patent Expiration on Various Inter-mediate Events
(1) (2) (3) (4) (5)
t-3 t-2 t-1 t+1 t-3 to t+1
Panel B: Intermediate Events
Additional Launches -.012 .013 .011 -.008 .005
(.013) (.013) (.013) (.014) (.009)
Change in Global Status .016 .001 .003 -.006 .006
(.014) (.015) (.015) .016) (.010)
Licensing Opportunity .013 .020 .017 .004 .017∗∗
(.012) (.013) (.013) (.014) (.009)
New Licensees .022 -.005 .025 .036∗∗ .034∗∗∗
(.015) (.015) (.015) (.016) (.010)
Orphan Drug Status Granted -.004 -.003 .016∗ .000 .002
(.008) (.008) (.008) (.009) (.006)
N 13,300 13,300 13,300 13,300 13,300
Standard errors in parentheses
Table 9: Linear Probability Model for Effect of Patent Expiration on Various Ter-mination Events
(1) (2) (3) (4) (5)
t-3 t-2 t-1 t+1 t-3 to t+1
Panel C: Termination Events
Product Discontinued -.005 .015 .006 -.006 .004
(.012) (.012) (.013) (.013) (.009)
Licences Discontinued .019∗∗ -.002 .006 .009 .015∗∗
(.009) (.010) (.010) (.010) (.007)
N 13,300 13,300 13,300 13,300 13,300
Standard errors in parentheses