ANOMALOUS PROTEIN AGGREGATION ON
NANOTUBULAR TITANIUM DIOXIDE
Jacob Hershel Forstater
A dissertation submitted to the faculty of the University of North Carolina at Chapel Hill in partial fulfillment of the requirements for the degree of Doctor of Philosophy in the Department of Physics and Astronomy
Chapel Hill 2013
Approved by:
Yue Wu
Max Berkowitz
Reyco Henning
Alfred Kleinhammes
Amy Oldenburg
c
2013
ABSTRACT
JACOB FORSTATER: Anomalous Protein Aggregation on Nanotubular Titanium Dioxide (Under the direction of Yue Wu)
Immobilized enzymes are widely used as catalysts in industrial chemical production,
diagnostic devices, and biosensors. Immobilization improves an enzyme’s stability and
cre-ates an insoluble enzyme-based material that is easier to manipulate and recover. This is
typically achieved by either covalently immobilizing enzymes to the surface of an
inor-ganic carrier or by confining them within an inorinor-ganic scaffold. Both of these strategies
are problematic – surface adsorption limits immobilization to a monolayer, while
confine-ment prevents access to the enzymatically active site. The desired approach would be to
assemble enzymes, without chemical modification, into solid enzyme-based materials with
an accessible microstructure.
In this dissertation, I detail the discovery and development of an inorganic nanomaterial,
titania nanotubes, that can initiate and template the non-covalent, self-assembly of enzymes
into stable, micron-sized, enzyme-based superstructures which retain their native enzymatic
activity.
On the basis of quantitative adsorption measurements, dynamic light scattering, and
microcalorimetry, I demonstrate that this process occurs in two stages – at low enzyme
concentrations, enzyme multilayers form around the nanotube; above a critical enzyme
con-centration the enzyme-coated nanomaterial and any additional free enzyme self-assemble
into micron-sized ellipsoidal structures. The resulting enzyme-based material has enhanced
enzymatic activity and contains more than 99.9%enzyme by weight.
thermogravimetric analysis (TGA), I investigate the interfacial properties of the nanotube
and similar materials and I show that this phenomenon is uniquely associated with the
active anatase-(001) like surface of titania nanotubes, which contain a high density of stable,
coordinatively undersaturated Ti sites on its surface.
These findings present a nanotechnology-enabled mechanism for creating stable
protein-based materials and present a new route for creating such materials without covalent
modi-fication. In this dissertation I detail the assembly of these structures, the role of the
nano-material’s surface chemistry, and the design rules suggested by these findings for creating
To Sarah
and
In memory of my grandparents Sidney Forstater,!ל"!ז הנחו קחZי Nב אקלומש, and Louise Fradkin,!ל"!ז הכלמ הרשו שרעה תב האל, who instilled in me both a love of learning and a
ACKNOWLEDGEMENTS
“If I have ever made any valuable discoveries, it has been owing more to
patient attention, than to any other talent.”
— Isaac Newton
Over the past six years, I have received support and encouragement from many
indi-viduals. I am indebted to my advisor, Prof. Yue Wu, for the independence and intellectual
freedom he allotted me, for expecting more from me than I knew I was capable, and for
patiently teaching me the value of seeing the forest for the trees. I would like to thank
the different members of my preliminary oral exam and dissertation committees – Profs.
Max Berkowitz, Reyco Henning, Alfred Kleinhammes, Amy Oldenburg, Gary Pielak, and
Rich Superfine – for challenging me to be a better scientist and for their support and advice
as I moved from an idea to a completed study. Drs. Pabitra Sen and Tim O’Brien
pro-vided critical intellectual feedback, mentorship, and support and I am very grateful for their
contributions.
I am particularly thankful of Dr. Alfred Kleinhammes’s feedback, collaboration, and
mentorship during my graduate career. His sense of humor, friendship, and appreciation of
good coffee have been invaluable. Thank you to Maggie Sandor who, in addition to enjoying
hundreds, maybe thousands, of cups of coffee with me, has always been a supportive friend
and coworker. Her dedication, tireless efforts, and perseverance have always inspired me.
I performed many measurements for this dissertation using equipment in the laboratories
of Profs. Joe DeSimone and Rich Superfine, and I am especially grateful to them for opening
up their labs and to their students and colleagues who graciously assisted and accommodated
me. I’m very thankful to Kellie Machlus and Jeff Damrauer, who in addition to being good
thank Amar Kumbhar and Wallace Ambrose of CHANL for performing much of the TEM
imaging.
I would like to acknowledge TA Instruments, which generously lent me the
microcalorime-try and thermal analysis instrumentation for this research; in particular, I’m grateful to Neil
Demarse for making the arrangements and for introducing me to microcalorimetry.
Many wonderful graduate students and postdocs passed through Prof. Wu’s lab during
my time, I grateful for their contributions and feedback. In particular, I greatly benefited from
the advice and expertise of Qiang Chen, Shaun Gidcumb, Greg Mogilevsky, and Haijing
Wang.
I am especially grateful to my family and friends – you know who you are. Your love,
encouragement, and occasional harassment have sustained me.
And of course, to my wife Sarah, words cannot express my thanks. This work is a
TABLE OF CONTENTS
List of Tables . . . xiv
List of Figures . . . xv
List of Abbreviations and Symbols . . . xxiv
1 Introduction . . . 1
1.1 Introduction . . . 1
1.2 Protein Adsorption and Interactions at an Interface . . . 3
1.3 Driving Forces for Adsorption . . . 4
1.3.1 Solution Conditions . . . 5
1.3.2 Protein Structure . . . 6
1.3.3 Substrate Properties . . . 6
1.3.3.1 Morphology . . . 7
1.3.3.2 Surface Coordination, Polarity, and Interfacial Properties 8 1.4 Parameter Space . . . 9
1.5 Overview of Dissertation and Organization of Chapters . . . 12
2 Titania Nanomaterials - Structure, Synthesis, and Surface Chemistry . . . . 15
2.1 Introduction . . . 15
2.2 Materials and Methods . . . 16
2.2.1 Chemicals . . . 16
2.2.2 Nanomaterial Synthesis and Processing . . . 16
2.2.2.2 Shortened Nanotube Production . . . 17
2.2.2.3 Cryomilled Nanotube Production . . . 17
2.2.2.4 Anatase Nanotiles Synthesis . . . 18
2.2.3 Experimental Measurements . . . 18
2.2.3.1 Dynamic Light Scattering and Zeta Potential Measurements 18 2.2.3.2 Electron Microscopy . . . 19
2.2.3.3 Thermogravimetric Analysis . . . 19
2.2.3.4 X-Ray Diffraction . . . 20
2.2.3.5 Solid-State NMR . . . 20
2.3 Titanium Dioxide . . . 22
2.4 Structure of Titania Nanotubes . . . 22
2.5 Controlling the morphology and dispersion of Titania Nanotubes . . . 27
2.5.1 Shortened Titania Nanotubes . . . 27
2.5.2 Cryomilling . . . 29
2.6 ζ-Potential and Origin of Surface Charge on Titania Nanotubes . . . 32
2.7 Pickering Emulsions of Cryomilled Nanotubes . . . 36
2.8 Other Anatase Nanomaterials . . . 39
2.8.1 Anatase Nanoparticles . . . 39
2.8.2 Anatase Nanotiles . . . 40
2.9 Surface Chemistry and Hydration of Anatase Nanomaterials . . . 41
2.9.1 Thermogravimetric Analysis . . . 44
2.9.2 Solid State NMR . . . 45
2.9.2.1 MAS Spinner Background Contribution . . . 48
2.9.2.2 Titania Nanotubes . . . 50
2.9.2.3 Anatase Nanoparticles . . . 53
2.9.2.4 Anatase Nanotiles . . . 55
2.10 Conclusions . . . 58
3 Globular Protein Adsorption on Titania Nanotubes . . . 61
3.1 Introduction . . . 61
3.2 Experimental . . . 62
3.2.1 Production of Titania Nanotubes . . . 62
3.2.2 Quantitative Adsorption Measurements . . . 62
3.2.3 Dynamic Light Scattering and Zeta Potential Measurements . . . . 64
3.3 Results and Discussion . . . 65
3.3.1 Ribonuclease A Adsorption . . . 65
3.3.1.1 Adsorption Isotherm . . . 65
3.3.1.2 Concentric Multilayer Model . . . 68
3.3.2 Adsorption of Other Model Proteins . . . 70
3.3.3 Effect of Ionic Strength . . . 73
3.3.4 Hypothesis for Adsorption Isotherm . . . 76
3.4 Conclusions . . . 78
4 Self Assembly of Globular Proteins with Titania Nanotubes . . . 81
4.1 Introduction . . . 81
4.2 Experimental . . . 82
4.2.1 Preparation of Proteins and Related Solutions . . . 82
4.2.2 Dynamic Light Scattering and Zeta Potential Measurements . . . . 82
4.2.3 TEM/SEM Imaging . . . 83
4.3 Results and Discussion . . . 84
4.3.1 Growth of Protein-TiNT Aggregates . . . 84
4.3.1.1 Hydrodynamic Diameter of Protein-TiNT Clusters . . . . 84
4.3.1.2 Evidence of Lysozyme-TiNT Aggregate Growth . . . 87
4.3.3 TEM/SEM Imaging . . . 90
4.3.4 Thermodynamics of Self Assembly of RNaseA-TiNT Structures . . 92
4.3.5 Model of RNaseA-TiNT Aggregate Formation and Growth . . . 96
4.4 Examining the Interaction of RNaseA With Other Anatase Nanomaterials . 97 4.5 Conclusions . . . 100
5 Biophysical Characterization of Protein-Nanotube Conjugates . . . 103
5.1 Introduction . . . 103
5.2 Materials and Methods . . . 104
5.2.1 Denaturing Gel Electrophoresis . . . 104
5.2.2 Enzymatic Activity Assay . . . 105
5.2.3 Cytotoxicity Assay . . . 106
5.3 Results and Discussion . . . 107
5.3.1 Denaturing Gel Electrophoresis . . . 107
5.3.2 Assay of Enzymatic Activity of RNaseA Associated With TiNT . . 109
5.3.2.1 Relative Enzymatic Activity . . . 109
5.3.2.2 Nuclease Contamination Not Evident . . . 111
5.3.2.3 Enzyme Kinetics and Assembly Microstructure . . . 113
5.3.3 Cytoxicity . . . 116
5.4 Conclusions . . . 117
6 Differential Scanning Calorimetry . . . 119
6.1 Introduction . . . 119
6.2 DSC Instrumentation . . . 120
6.3 Thermodynamics of Protein Unfolding . . . 125
6.3.1 Equilibrium Two-State Transition . . . 125
6.3.2 Thermodynamics of Protein Stability . . . 127
6.3.3.1 Partition Function of a Monomeric Protein Unfolding . . 131
6.3.4 Partition Function Analysis of Thermotropic Denaturation . . . 133
6.3.5 Simulation and Analysis of Two-State Thermotropic Transition . . 135
6.3.5.1 Excess Enthalpy . . . 135
6.3.5.2 Evaluating DSC Measurements . . . 137
6.3.6 Analyzing DSC Experiments . . . 138
6.3.7 Deconvolution Analysis of DSC Thermograms . . . 139
6.4 Conclusions . . . 141
7 Microcalorimetric Studies of Ribonuclease A-TiNT Structure and Formation 142 7.1 Introduction . . . 142
7.2 Experiments . . . 144
7.2.1 Differential Scanning Calorimetry . . . 145
7.3 Results and Discussion . . . 146
7.3.1 EndothermTmShifts Withξ . . . 148
7.3.1.1 Relationship Between∆Tmand Surface Coverage . . . . 150
7.3.2 Size of the Cooperatively Unfolding Domain . . . 152
7.3.3 Deconvolution Analysis . . . 155
7.3.4 Relative Populations of Bound and Free Protein . . . 158
7.3.4.1 Relative Enthalpic Contributions . . . 159
7.3.5 Effect of Protein and Nanotube Volume Fraction . . . 162
7.3.5.1 Effect on Unfolding Temperature . . . 162
7.3.5.2 Heat Capacity Change . . . 164
7.3.5.3 Enthalpy of Complex Formation . . . 168
7.4 Conclusions . . . 169
8 Conclusions . . . 171
Appendix B Dynamic Light Scattering . . . 182
B.1 Apparent diffusion coefficient . . . 183
B.2 Correlation function for monodisperse rods . . . 184
B.2.1 Optical anisotropy . . . 184
B.2.2 Effect of geometric anisotropy . . . 188
B.3 Analyzing DLS data . . . 191
Appendix C Protein Unfolding Coupled to Ligand Binding . . . 194
LIST OF TABLES
3.1 Various physical properties of Ribonuclease A , Lysozyme, and Ubiquitin . 71
5.1 Results of non-linear least squares fit of enzymatic activity time course, shown in figure 5.5, to equation (5.1), for differentξ. . . 114
5.2 Results of 2-Way ANOVA examining whether the choice of nanomaterial
LIST OF FIGURES
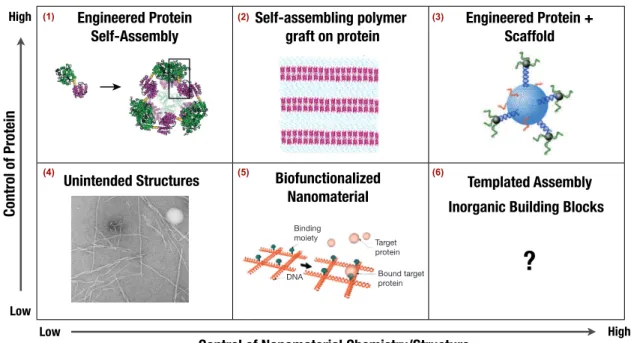
1.1 Examples of self-assembled and templated protein structures and the level of control or customization needed of either the material interface or the protein. . . 10
2.1 Anatase bulk structure and Wulff construction. . . 23
2.2 Structure of bulk anatase and delaminated anatase vacuum slab used in
simulations. . . 24
2.3 Structure of delaminated anatase unit cell and construction of nanotube.
(A) DA unit cell is (B) curved around the anatase [010] axis, resulting in a loss of registry between adjacent layers, as indicated by the dashed lines which show the distortion of the crystal planes parallel to the nanotube axis. The glide shift between layers is 78◦. (C) The exposed surface contains both 2-fold and 3-fold coordinated oxygen on the surface. . . 25
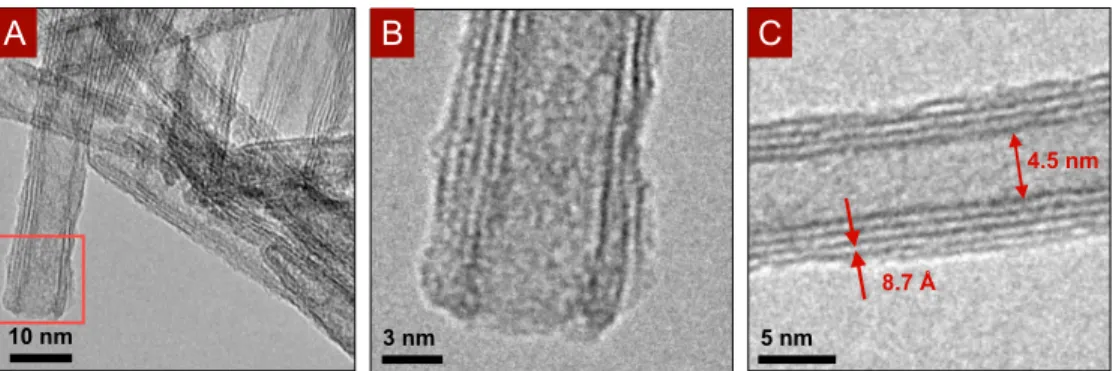
2.4 TEM imaging of long nanotubes. (A) the open end of nanotube is outlined
in red and shown in (B) Measurements of the interlayer spacing and inner diameter are shown in (C). . . 25
2.5 XRD of titania nanotubes. Simulated XRD pattern of delaminated anatase
structure, and nanotube made out of delaminated anatase. The experimental XRD of the nanotube is shown at the bottom. The large peak centered around 60◦ is a result of the amorphous silicon sample holder used in diffractometer. The corresponding crystal planes based on the structural model are indicated at the top. . . 26
2.6 TEM imaging of shortened titania nanotubes. . . 28
2.7 SEM imaging of short nanotubes. The yellow box in (A) indicates the
approximate region shown in (B) . . . 29
2.8 XRD of shortened titania nanotubes. The XRD spectrum of the shortened
2.9 Dynamic light scattering of shortened nanotubes after ball milling (orange) and after filtering the suspension through a 0.2 µm PES filter. (Inset) Picture of filtered shortened nanotube dispersion after sitting untouched for over 6 months. . . 31
2.10 Images of the solution formed by traditional shortening (grinding) versus improved cryomilling process. . . 31
2.11 TEM imaging of cryomilled nanotubes. Box in (E) shows region examined in (F). . . 32
2.12 Zeta potential of two different batches of shortened titania nanotubes as a function of pH. The isoelectric point (pI) is approximately pH 2.7 to 2.8. (Left) Measurements over entire range of pH values examined (Right) Plot of the same data over a narrower pH region. . . 34
2.13 Histogram of different published isoelectric points for anatase (N=72). The
average pI was 6.0±0.7. Published values were accumulated from[1]. . . 35
2.14 Zeta potential of two different cryomilled batches (filled circles) shown with shortened nanotubes (open circle) as a function of pH. Figure high-lights similar behavior and isoelectric point occuring at approximately pH 2.7-2.9. . . 35
2.15 Photographs of the cryomilled nanotubes, at identical volume fractions, and different pH. . . 36
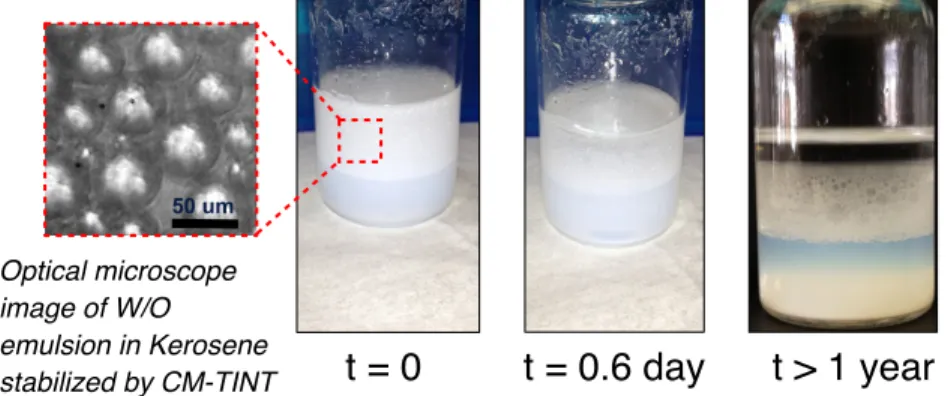
2.16 Illustration of sample composition used in investigations of oil-water in-terfacial aggregates. . . 37
2.17 The adsorption of cryomilled nanotubes at the oil-water interface forms a highly stable water-in-oil emulsion. Shown at right, the emulsion is still intact after sitting for over 1 year. . . 37
2.18 (Left) Illustration of a TiNT-stabilized water-in-oil Pickering emulsion. (Right) Illustration of a particle of radius R, at the oil-water interface. La-bels refer to interfacial tension,γ, between the p(article), o(il), and w(ater) phases. . . 37
2.19 pH stability of water/kerosene pickering emulsions formed with cryomilled nanotubes. (Top) prior to agitation (bottom) 1 hour after agitation. . . 39
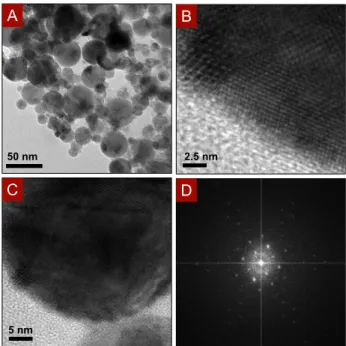
2.21 TEM imaging of anatase nanoparticles. The region shown in (C) was used to obtain the electron diffraction pattern shown in (D). . . 40
2.22 XRD of anatase nanoparticles and nanotiles. The corresponding crystal plane assignment based on the structural model is indicated at the top. Assignments based on Horn et. al[2]. . . 41
2.23 TEM images of nanotiles at different magnifications. Arrows drawn in (C) show the lattice spacing, 2.34 Å, which corresponds to the spacing between different (001) planes in the anatase crystal. . . 42
2.24 Illustration of the different mechanisms by which water can interact with a metal oxide surface. . . 42
2.25 TGA of different anatase nanomaterials which were equilibrated under ambient conditions. (Left) Nanotubes, nanotiles (Black), and nanoparticles (Green) (Right) Plot of the TGA curves of the nanotiles and nanoparticles only. . . 44
2.26 (Left) TGA (top) and DTA (bottom) curves of different anatase nanoma-terials which were equilibrated under ambient conditions. (Right) DTA Curves of nanotiles and nanoparticles. . . 45
2.27 The Torlon drive tip, spacer, and cap used on the MAS spinner significantly overlaps with the signal from the nanotube. (A) Stacked spectra of (from top) empty spinner containing fluoropolymer (Kel-F) parts, same spinner containing polyimide (Torlon) parts, spinner containing Torlon and nan-otube sample, spinner containing Kel-F and nannan-otube sample. (B) Same spectra shown overlayed. . . 49
2.28 Proton NMR of titania nanotubes. 1H solid-state NMR of TiNT
2.29 Proton NMR of nanotubes and nanoparticles.1H solid-state NMR spectra (solid lines) and deconvolution (dashed) of (A) TiNT equilibrated under ambient conditions (TiNT As Rcv’d), hydrated for 24 hours in a water-vapor saturated atmosphere (TiNT Hydrated) and dried for 16 hours in a desiccator (TiNT Dried). (B) TiNP equilibrated under ambient condi-tions (TiNT As Rcv’d), hydrated for 24 hours in a water-vapor saturated atmosphere (TiNT Hydrated) and dried for 24 hours in a desiccator (TiNT Dried). All samples were acquired under identical conditions at an MAS speed of 26 kHz. . . 51
2.30 Proton NMR of titania nanotubes. Deconvoluted peak of 1H solid-state
NMR TiNT equilibrated under ambient conditions (TiNT As Rcv’d), hy-drated for 24 hours in a water-vapor saturated atmosphere (TiNT Hyhy-drated) and then dried for 15.63 hr. All samples were acquired under identical con-ditions at an MAS speed of 26 kHz. The spectra were fit to two peaks defined by the Voigt function (Lorentzian-Gaussian combination), the peak resulting from the signal is shown above, the other resulted from the MAS spinner background. . . 52
2.31 Proton NMR of titania nanoparticles. A closer examination of the TiNP sample after 24 hours drying shows two individual peaks, a broad peak at 8.8 ppm and a narrow peak at 0.88 ppm. Spectra were deconvoluted into 3 separate Gaussian peaks. The spinner background is at 7.24 ppm. . . 55
2.32 Proton NMR of nanotiles. Examination of the surface hydroxyl groups on Batch 4 Nanotiles using solid-state1H NMR. (A) From top to bottom the spectra are - nanotiles equilibrated in saturated water vapor atmosphere for 24 hours (blue), dried for 24 hours in desiccator (orange), and nanotiles dried for 1 month in dessicator (black). The intensity of the hydrated (blue) peak has been scaled by 0.5. (B) Zoomed in view showing only the 24 hour dried and 1 month dried spectra. Arrows drawn to indicate the peak due to the Torlon background and the peak due to sample. . . 56
2.33 Examination of the surface hydroxyl groups on nanotiles using solid-state
1H NMR. Spectra were deconvoluted into two components - one
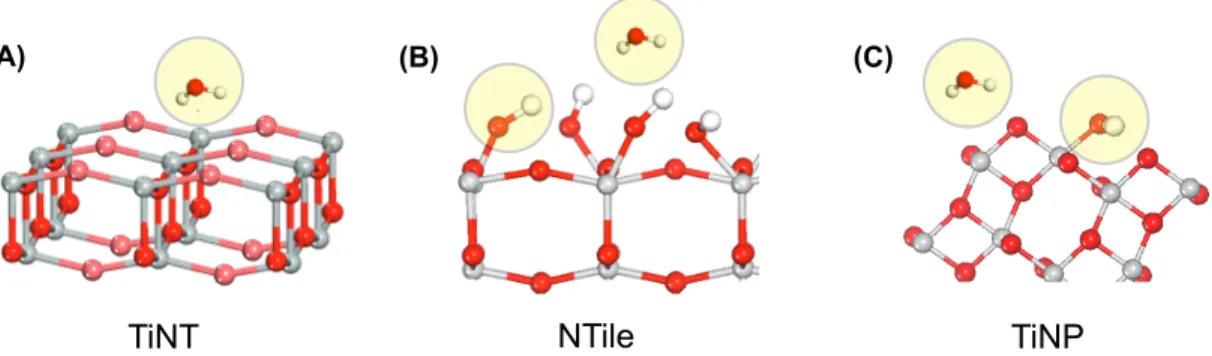
2.34 llustration of the possible identities of the proton moieties (circled in yel-low). observed in the NMR and TGA of nanomaterial. (A) Titania nan-otube contains primarily bulk and interfacial water. (B) Nanotile contains strongly bound surface hydroxyl groups and bulk/interfacial water. (C) Nanoparticle contains bulk/interfacial water, shown is one possible model by which adsorb. . . 58
3.1 Overview of adsorption experiments . . . 63
3.2 Illustration showing how sample composition was varied among trials in
adsorption experiments . . . 64
3.3 Equilibrium adsorption isotherm of RNaseA adsorption on TiNT . . . 66
3.4 Isometric illustration of monolayer and multilayer coated nanotubes. The
protein is colored yellow and nanotube is colored blue. . . 69
3.5 Theoretical number of concentric RNaseA layers versus the surface
cover-age from my model. Blue dots highlight the surface covercover-ages measured in my experiment and theoretical number of concentric multilayers coverage would correspond to. Error bars correspond to coverage uncertainty based on replicate measurements and propagation of systematic uncertainty. . . . 71
3.6 Calculated net charge on Ribonuclease A, Lysozyme, and Ubiquitin as a
function of pH . . . 73
3.7 Equilibrium adsorption isotherms of Ribonuclease A, Lysozyme, and
Ubiq-uitin adsorption on titania nanotubes . . . 74
3.8 Increasing ionic strength increases mean aggregate size. All samples had
identical amounts of TiNT and RNaseA and were incubated in 25 mM
HEPES Buffer (pH 7.2) with different concentrations of NaCl. The ap-parent mean hydrodynamic size was determined by DLS, using equa-tion (B.23). Results are mean ± s.e.m., n=3. Asterisk indicates p<0.05 as determined by analysis of variance (ANOVA). . . 74
4.1 Semi-log plot of mean hydrodynamic size of RNaseA-TiNT and
Ubiquitin-TiNT as a function increasing molar ratio . . . 85
4.2 Semi-log plot of mean hydrodynamic size of Lysozyme-TiNT samples as
a function increasing molar ratio . . . 87
4.3 Photograph of sample containing lysozyme and TiNT after 3 days of
4.4 Dynamic light scattering and Adsorption isotherm of RNaseA-TiNT ag-gregate formation as a function ofξ . . . 89
4.5 (A) TEM image of RNaseA-TiNT atξ=0.06 shows a 6 nm to 8 nm thick
protein layer surrounding the nanotube. Yellow lines are drawn to indicate the outer diameter of nanotube. (B) SEM image atξ < ξ∗shows individual nanotubes coated with 6 nm to 8 nm of protein, indicating two to three layers of adsorbed protein. (C) TEM image at ξ > ξ∗ shows multiple nanotubes embedded in a large plaque suggesting the formation of large aggregates of multiple nanotubes. Arrows are drawn to point out nanotubes. (D) SEM image atξ > ξ∗ shows a large aggregate containing multiple protein-coated nanotubes. . . 90
4.6 (A-C) Additional SEM imaging of RNaseA-TiNT aggregates (A-C) and
(D) multilayer coated nanotubes. Yellow box in (A) indicates the approxi-mate region where (A) was taken. . . 91
4.7 Similarly to RNaseA, Lysozyme also forms self-assembled aggregates
with TiNT. TEM imagingin reveals a similar microstructure consisting of (A) multiple TiNT surrounded by a larger protein plaque (B) which form micron-sized aggregates. . . 92
4.8 Illustration showing proposed process of multilayer adsorption and self
assembly of RNaseA onto TiNT for a fixed TiNT concentration. . . 97
4.9 SEM images of different TiO2 nanomaterials (top half) and structures
formed after interacting with RNaseA (bottom half). Shown are anatase nanoparticles (TiNP) with a 32 nm average particle size, anatase (001) nanotiles, and titania nanotubes (TiNT). The assembly of larger aggregates formation only occurred with the nanotubes. Bottom samples were sputter coated with 2.5 nm Au/Pd prior to imaging to reduce charging. . . 98
5.1 SDS-PAGE of RNaseA adsorbed on TiNT. All trials had the same TiNT
concentration. . . 108
5.2 SDS-PAGE of the free supernatant (free ubiquitin) and nanotube-bound
5.3 Bar plot of enzymatic activity of RNaseA-TiNT samples normalized by the activity of the RNaseA control, red line drawn at 100%. Error bars show S.E; asterisks indicate statistical significance of relative enzymatic activities as compared to RNaseA control (*, p<0.05; ***, p<0.005; ****, p<0.0001). . . 111
5.4 Relative fluorescence time-course of the nanotube only and buffer only
controls. . . 112
5.5 (Left)Fluorescently modified RNA was incubated for 1 hour with
RNaseA-TiNT conjugates formed at different molar ratios RNaseA-to-TiO2. The resulting fluorescent intensity is directly proportional to the number of fluorescently modified RNA cleaved by the RNaseA in solution. The sam-ples were incubated for 1 hour at 37◦C with measurements taken every minute. The resulting measurements with fit to a first order kinetic model, as described in the text. . . 113
5.6 Enzymatic degradation reaction time constant,τ. Error bars show S.E.M;
asterisks indicate statistical significance of relative enzymatic activities as compared to RNaseA control (*, p<0.05; ****, p<0.0001) S.E.M(n=3). Red line drawn at mean time constant of RNaseA only control (19.4 min). . 115
5.7 Cytotoxicity of titania nanotubes (Blue/Filled) and titania nanoparticles (unfilled) to HeLa cells as a function of dosage, nmol per cell. Error bars are S.E.M (n=3). . . 116
6.1 Schematic of non-adiabatic DSC. (A) Resistive heater for sample cell. (B) Resistive heater for reference cell. (C) Thermoelectric sensor to detect tem-perature difference between cells. (D) Thermal Shield. (E) Peltier elements (F) Peltier elements. (G) Sample inlet tubes and wound capillary cells at bottom. (H) Top of manifold containing manostat and pressure sensors. (I) Thermal shunt. Schematic drawn after Privalov[3, 4]. . . 123
6.2 Schematic illustrating the two state transition of a protein in the native state (N) to an unfolded state (U), occurring with equilibrium constant K. . . . 125
6.3 Simulation of the free energy of a two-state protein,∆G(T) defined in equation (6.14), for three different unfolding enthalpies. Parameters for simulation were:∆H = 400 kJ mol−1, 500 kJ mol−1, or 600 kJ mol−1;∆C
p
= 10 kJ K−1mol−1, and Tm = 60◦C, which is indicated in the figure. . . 129
6.4 Simulation of progress curve for thermal denaturation of a protein, calcu-lated from equation (6.22), with parameters ∆H = 400 kJ mol−1,∆Cp = 10 kJ K−1mol−1, and Tm= 60◦C. The progress curve indicates the fraction
6.5 Raw and baseline subtracted thermograms of RNaseA thermal denatura-tion, labeled to highlight features discussed in text. . . 134
6.6 (A) Simulation of the temperature dependence of the excess enthalpy with
parameters ∆H = 400 kJ mol−1,∆C
p = 10 kJ K−1mol−1, and Tm = 60◦C
and (B) Baseline contribution to heat capacity: PU ∂∂T∆H
, simulated with the same parameters. . . 136
6.7 Simulations of DSC endotherm, baseline, and heat capacity change due to
thermotropic unfolding of a protein. . . 138
7.1 Repeatability of NanoDSC baseline . . . 145
7.2 DSC of RNaseA-TiNT conjugates . . . 147
7.3 Relative shift of unfolding temperature associated with RNaseA-TiNT
in-teraction . . . 149
7.4 Comparison of relative Tmshift and adsorption as a function of
RNaseA-to-TiO2molar ratio and fixed nanotube concentration . . . 151
7.5 Illustration of differences between calorimetric and van’t Hoff enthalpies for single domain unfolding, two-domain unfolding, and dimer unfolding . 154
7.6 Ratio of van’t Hoff and calorimetric enthalpies and relative temperature
shift as a function ofξ∗ . . . 155
7.7 Plots of the best fit Tmvalues obtained by deconvoluting the RNaseA-TiNT
thermograms into two independent, overlapping two-state transitions, using equation (6.35). In (A) all fitting parameters were free. In (B) the higher temperature, Tm2 was fixed to the approximate Tm of the free protein, 61.1◦C, and all other fitting parameters were free. The dashed line indi-cates CAC, and the shaded region indiindi-cates region whereξ > ξ∗. Fitting parameter error bars represent the 95% confidence interval, which were determined using Monte Carlo simulations of fitting (n=100). . . 157
7.8 The difference between Tm2 and Tm1 for both the free and constrained
fitting models versusξ. Line drawn to guide the eyes. . . 158
7.9 Comparison of the fitted values ofTm1 when Tm2 was allowed to vary (◦) and when it was fixed at the free protein Tm (). The percentage of the
7.10 Comparison of the relative enthalpic contributions of the (Top) Tm1 and (Bottom) Tm2 transitions, determined by the deconvolution analysis de-scribed in the text, to the calorimetric enthalpy when Tm2 was free and when it was constrained to 61.1◦C. The percentage of the protein which was (Top) adsorbed or (Bottom) unadsorbed at a givenξ, determined from quantitative adsorption experiments detailed in chapter 3, is shown on the right axis . . . 161
7.11 Examining the effect of doubling the protein and nanotube concentration
at three differentξ. Shown are raw thermograms of RNaseA-TiNT
sam-ples’ heat capacity (buffer and nanotube contribution subtracted) at three different values ofξ . . . 162
7.12 Examining the effect of doubling the nanotube concentration from 18.8 µM
to 37.6 µMTiO2 on the resulting thermogram. The endotherms are labeled with the corresponding molar ratio of protein to nanotube,ξ. All curves have been shifted to Cp=0 at T=30◦C to enable comparison. . . 163
7.13 Examining the effect of doubling the nanotube volume fraction on the relative shift of Tm. Here the relative change in temperature of
RNaseA-TiNT samples is plotted versus the molar ratio of RNaseA:TiO2for samples containing either 18.8 µMTiO2(blue) 37.6 µM TiO2 (grey) . . . 164
7.14 Excess molar heat capacity of Ribonuclease A control and fit to equa-tion (6.25). . . 165
7.15 Examining the effect of the nanotube volume fraction on the change in molar heat capacity associated with unfolding the protein.∆∆Cp is the difference between the apparent molar excess heat capacity change associ-ated with denaturing the protein in the presence of the TiNT,∆CComplex
p ,
and the apparent molar excess heat capacity change associated with dena-turing the protein by itself,∆CRN aseA
p .∆∆Cp is plotted versus the molar
ratio of RNaseA:TiO2 for samples containing either 18.8 µMTiO2 (blue) 37.6 µM TiO2 (grey). The error bars on ∆∆Cp represent the propagated uncertainty in the extrapolated values of∆Cp. . . 167
LIST OF ABBREVIATIONS AND SYMBOLS
h∆Hi Average excess enthalpy
Pi Population of ith state
α Symbol for a generic measurable property
∆Gi Gibb’s free energy of state i
∆Hcal Change in calorimetric enthalpy
∆HV H Change in van’t Hoff enthalpy
κ−1 Debye Length
h∆CN→U
p i Heat capacity difference between native and unfolded
protein
h∆Cptransi Heat capacity due to thermal transition
hCpi Average heat capacity
hCpi1/2 Heat capacity at midpoint of thermal unfolding curve,
relative to pre-transition baseline
h∆Gi Average excess Gibb’s free energy
h∆Si Average excess entropy
φp Porosity
τ Characteristic timescale of enzymatic reaction
θ Surface coverage
Aw Scaling factor for two-state unfolding model
Cp,n Heat capacity of native protein
Cp,u Heat capacity of unfolded protein
De Effective diffusivity
KL,U Binding affinity of of unfolded protein for ligand
T Tortuosity
Tm Unfolding temperature
AA Antibiotic-antimitotic solution
CM-TiNT Cryomilled Titania Nanotubes
CU Cooperativity unit
DLS Dynamic Light Scattering
DPBS Dulbecco’s Phosphate Buffered Saline
DSC Differential scanning (micro)calorimetry
FBS Fetal bovine serum
Hexcess Excess enthalpy
HEPES 2-[4-(2-hydroxyethyl)piperazin-1-yl]ethanesulfonic
acid
HWHM Half Width at Half Max
kb Boltzmann’s constant
Keq Equilibrium constant
MAS Magic-angle spinning
MD Molecular dynamics
N Native state of protein
NMR Nuclear magnetic resonance
NTile Anatase Nanotile
PES Polyethersulfone
pI Isoelectric point
PID Proportional, integral, derivative
R Gas constant
RFU Relative fluorescence units
RH Relative humidity
RNaseA Bovine pancreatic ribonuclease a
SAED Selected Area Electron Diffraction
SEM Scanning Electron Microscopy
T Temperature
Tm1/2 Midpoint of thermogram
TEM Transmission Electron Microscopy
TGA Thermogravimetric Analysis
TiNP Titania Nanoparticle
TiNT Titania Nanotube
U Unfolded state of protein
CHAPTER 1
INTRODUCTION
1.1
Introduction
Many proteins have evolved to self-assemble into stable, large, and remarkably complex
hierarchical materials which are structurally robust, functional, and biocompatible[5, 6].
For example, in eukaryotic cells, most enzymes, which are catalytic proteins, are either
spatially confined within subcellular organelles or co-localized into larger complexes with
enzymes that function in tandem[7–11]. Many biochemical processes require a series of
different enzymes that perform a cascade of consecutive reactions. Assembling them into
larger structures has two major benefits - it improves the reaction efficiency by minimizing
the diffusion of intermediate reaction products amongst the different enzymes and allows
potentially toxic intermediates to be confined with the complex[11–13].
Although this strategy is useful in nature, it has been very hard to replicate. Naturally
existing protein assemblies result from either confinement in a larger structure, such as the
subcellular organelles, or by programmed assembly, resulting from specific structural motifs
which have evolved over billions of years[14]. So far we have only been able to create
struc-tural assemblies containing proteins with specially engineered proteins[14], or by
chemi-cally crosslinking proteins with polymers that self-assemble[15] or polymerize[12, 16]. It
has remained a key challenge to assemble large, stable, and functional protein structures
without relying on chemical modification.
in-troducing specific ligands. For example, proteins can form larger aggregates or assemble
at elevated salt concentrations[17], under macromolecular crowding conditions[18, 19], or
in the presence of a small molecule or ligand which alters the protein’s self-association
properties[20–23].
Given the variety of different conditions and environments in which protein assemblies
might be utilized, the desired approach would be to assemble solid protein-only materials
with an accessible microstructure by utilizing specific ligands or by exploiting interfacial
interactions between the protein and a engineered substrate. In fact, in recent years there
has been incredible interest in understanding how material interfaces can direct protein
assembly and in developing insoluble protein-based materials[24]. Such materials offer
novel opportunities as biocatalysts[25], biomaterials[26], and for stabilizing and delivering
biopharmaceuticals[27].
For instance, the creation of insoluble, stable, enzyme-based materials is a promising
strategy for creating robust and highly selective biocatalysts[28]. Current strategies either
immobilize enzymes as surface adsorbates on inorganic carriers or confine them within
an inorganic scaffold. However, adsorption gives rise to very low enzyme loading
capaci-ties, limited by the monolayer coverage[29], and requires structurally modifying covalent
linkages to prevent desorption[16, 30–36], while confinement often makes the enzyme
inac-cessible to the external molecules it is supposed to react with[12, 15, 16, 37–39]. Thus far,
it has proven exceptionally difficult to assemble enzyme-based materials while preserving
1.2
Protein Adsorption and Interactions at an Interface
Protein adsorption at solid, liquid, and air interfaces is ubiquitous in nature[31, 40–
44] and has widespread implications in a wide variety of areas including
biopharma-ceutical production, biocatalysis[38], and medicine, including diseases linked to
protein-aggregation[36, 45–48]. It is the first step in many biological processes such as
transmem-brane signaling and is responsible for initiating the blood coagulation cascade[31, 49, 50]. It
also plays a critical role in many modern biomedical applications, such as ensuring adequate
vascularization of artificial tissue scaffolds[40].
However, despite its ubiquity, protein adsorption is a far more complicated process than
typically encountered with rigid small molecules. A variety of differences exist between
proteins and small molecules. For instance, proteins have a complicated and delicately
balanced structural arrangement, with varying degrees of freedom, which is largely held
together by non-covalent bonds[31]. Owing to multiple amphoteric surface groups they
have an external charge distribution. Proteins do not simply adsorb to an interface, rather
structural rearrangements can occur, which in turn, can alter surface affinities, induce surface
aggregation, and alter the adsorption behavior over time[31, 40, 51].
However, experimentalists and theorists alike can take comfort that the delicate
bal-ance of interactions that occur during protein adsorption can also lead to a rich variety of
undiscovered novel phenomena. This notion is appropriately exemplified by one prominent
researcher[52], who referred to protein adsorption as: “. . . a common but very complicated
phenomenon.”
In this dissertation I examine globular proteins, which are an important class of widely
prevalent structural and functional proteins that are ellipsoidal-shaped and typically quite
compact. Examples include insulin[53], hemoglobin[54], immonoglobulins[31], and
by burying the the majority of hydrophobic (apolar) residues within the folded protein and
exposing the hydrophilic (polar) residues on the external hydrated surface[31, 56, 57]. This
makes them highly soluble in aqueous environments, but the dense packing decreases the
conformational entropy.
Globular proteins typically have a highly ordered secondary structure. Frequently the
secondary structure is dominated byα-helix andβ-sheet structures, which are stabilized by
significant intramolecular hydrogen bonding between peptide units within the polypeptide
backbone[31, 57]. The significant hydrogen bonding restricts the rotational mobility of the
bonds in the polypeptide chains and further reduces the conformational entropy.
Hydration of apolar residues is both enthalpically and entropically unfavorable[4, 43, 58,
59]; this energetic barrier makes it particularly favorable for the protein to assume a structure
which limits the hydrophobic residue exposure to water. However, approximately 40%of
the hydrophobic residues will still be located on the external surface of the protein[60–62].
Thus there is a spatially dependent structure of hydrophobic and hydrophilic patches on
the external surface of a protein and the interaction of a protein with a solid sorbent will
critically depend on the hydrophobicity of the interface it comes into contact with[63].
1.3
Driving Forces for Adsorption
Typically, protein adsorption to a solid interface involves three primary phases - the
transport of protein from the bulk solution to the interface[31], initial contact of the protein
to the surface[44], and conformational changes and structural relaxation at the interface[61].
Strong protein-surface interactions can dramatically influence protein stability[64],
moreover, it is possible for the protein to unfold into either a non-equilibrium or meta-stable
There are numerous driving forces for protein adsorption at a solid-liquid interface.
For spontaneous adsorption to occur, the Gibb’s free energy of the protein-sorbent system
must be reduced by adsorption. The enthalpic contributions are primarily due to
hydrogen-bonding[63] and electrostatic interactions[31], while entropic increases will arise from the
release or rearrangement of interfacial water and counterions[58] as well as conformational
changes to the adsorbed protein.
Before proceeding, it is useful to examine the basic fundamentals of how a protein might
interact with a material interface and to explore the parameter space available to control or
modify these interactions.
1.3.1
Solution Conditions
Proteins contain amphoteric groups on the surface with different pKa values. Thus
changing the pH will alter the protein charge distribution and net charge; in turn, the proteins
electrostatic attraction to or repulsion from the substrate will vary with pH[65, 66].
Along these lines, the ionic strength of the solution will tune the effective length scale
of electrostatic interactions. With increasing ionic strength the charge on the protein and
substrate are increasingly screened[31, 55, 67]. This typically increases the adsorption of
proteins to similarly charged substrates and decreases the adsorption to oppositely charged
interfaces[31]. Additionally, increased ionic strength will reduce the lateral repulsion
be-tween adjacent adsorbed proteins. This increases the packing density of proteins on the
interface[43, 68]. For example, lysozyme adsorption on SiO2 nanoparticles is decreased as
the pH is lowered[40, 69, 70].
The specific ion will also affect the interaction. Chaotropic ions will destabilize the
kos-motropic ions will typically stabilize the protein but can produce protein aggregates[40, 41].
However these trends are but guidelines; experiments show that the specific ion effects does
not always follow the Hoffmeister series[40].
1.3.2
Protein Structure
Generally speaking, the protein’s composition, structure, and size broadly impact its
adsorption properties. If hydrophobic residues are exposed on the protein surface, there is an
energetic driving force to dehydrate these residues or prevent their exposure[57]. The exact
structural motifs and cohesive structure will determine its stability and thus propensity to
unfold on an interface[56]. In particular, proteins with extensive disulfide bonds will undergo
less conformational change at an interface and the extent of hydrophobic dehydration will
be reduced. Because hydrophobic dehydration is one of the primary driving forces for
adsorption, adsorption is typically reduced for proteins containing disulfide bonds[71].
Similarly, the protein’s exact composition and structure determines which amino acids
are exposed on the surface, the hydrophobicity, and the charge on the surface[17]. Larger
proteins typically are more strongly adsorbed to an interface due to the increase contact
area between the protein and interface[30, 31, 64].
1.3.3
Substrate Properties
The interaction between proteins and nanoparticles has been widely studied[33, 45, 72–
76], and protein monolayers have been previously immobilized or adsorbed on
nanoma-terials such as carbon nanotubes[39], gold nanoparticles[38, 77, 78], and on metal oxide
nanomaterials such as SiO2[30, 79], TiO2[80, 81], and ZnO[82, 83]. Here I review some
some important trends observed in recent studies.
1.3.3.1 Morphology
The size[34], curvature[32], rigidity[84], shape[31, 61], and roughness[64] of a material
will impact protein adsorption. These properties are largely coupled for non-planar
inter-faces and isolating their individual effects is difficult. For instance, increasing the size of a
spherical microparticle will decrease the surface curvature, making the surface appear more
planar to an adsorbing protein. The amount of protein adsorbed per unit area is frequently
increased on high-curvature surfaces, due to the reduced steric repulsion between charged,
adsorbed proteins[30, 34, 85, 86].
However increasing the curvature can alter the adhesion properties of a polymer,
surfactant, or protein at an interface. For example, in theoretical studies[87] of
poly(3-hexylthiophene) adsorption on rutile (110), which is electrostatically attracted[88] to the
interface, the polymer’s adhesion strength was significantly reduced on highly curved
sur-faces.
Changing the curvature can also alter the morphology of the adsorbed layers.
Investi-gations of phosphatidylcholine lipid adsorption on SiO2 particles showed that on highly
curved surfaces, lipids will form bilayers with widely separated outer polar heads, which
then interdigitate to compensate for the increased outer head group spacing and high free
volume[89].
The roughness of the substrate is particularly important for utilizing materials as
biomed-ical scaffolds. Studies of collagen, which can self-assemble in solution, showed that the
morphology of the adsorbed protein, but not total coverage, depends on the roughness of
substrate[90]. On smooth surfaces the collagen formed supermolecular assemblies, while
Deposition of nanometer-sized grains of hydroxyapatite on titanium orthopedic implants
improved the adhesion of bone-forming cells (osteoblasts) and osseointegration[91].
There are differing opinions and contrasting results as to the the effect of curvature
on protein stability. For instance, the native structure of lysozyme[34] and human
car-bonic anhydrase[32] was more retained when adsorbed to SiO2 nanoparticles with higher
curvatures (smaller particles). However, Ribonuclease A was found to be destabilized on
high curvature surfaces and the extent of unfolding was observed to increase with surface
curvature[30].
1.3.3.2 Surface Coordination, Polarity, and Interfacial Properties
Recent studies also highlight the effect of size and curvature on nanomaterial surface
chemistry and exposed functional groups. As an illustration, as the size of TiO2 anatase
nanoparticles was progressively increased from 6 nm to 104 nm the isoelectric point (pI)
progressively decreased from pH 6.0 to pH 3.0[92]. As will be discussed later, the change
in the surface acidity results from changes in surface coordination resulting from defects
or structural changes[93]. It is well known that increasing the presence of surface defects
or undercoordinated ions, or dangling bonds can have cytotoxic effects[94, 95]. Molecular
water or hydroxyl groups (resulting from dissociative adsorption) will generally replace
sites where structural ligands have been lost or surface atoms removed due to defects or
undercoordination[96]. These changes drastically alter the effective biological identity of
the interface[10, 72].
Changes to surface hydrophobicity will impact protein affinity and interactions at the
interface[31, 33, 47, 66, 71, 97–100]. Proteins typically adsorb to highly polar interfaces
and studies suggest that this may facilitate protein conformational changes that increase
and membrane proteins are extensively adsorbed on hydrophilic surfaces, as hydrophilic
objects prefer to be oriented in a polar or ionic environment[44, 61, 84]. Significant protein
unfolding typically occurs at hydrophilic interfaces. In addition to the entropic gain, this
improves the ability of the protein to form ion pairs with oppositely charged surface groups
at the interface and is enthalpically favored[43].
Recent work has suggested that undercoordinated transition metal ions could modify
protein-protein interactions and promote protein self assembly[101–103]. This is a topic I
will return to shortly.
1.4
Parameter Space
There are many possible ways to customize either a (nanomaterial) interface or protein
to assemble into larger structures. In figure 1.1, I broadly classify techniques to achieve
supramolecular or hierarchical structures of proteins either on their own, or by including
a nanomaterial interface. Although a variety of techniques exist to assemble hierarchical
protein structures, they remain limited in their scope, stability, and specificity. Moreover,
techniques which rely on protein-engineering or modification are extremely limited[14] and
frequently alter the structure and function of the protein of interest[12].
Clearly the least laborious and powerful route is to utilize an engineered material
tem-plate or interface which can promote assembly by a gentle, non-covalent mechanism.
Al-though non-covalent mechanisms are known[5, 77, 104], they have so far not been utilized to
create large hierarchical protein-structures which are functional and in the case of enzymes,
retain their catalytic activity and accessibility.
It is clear that there are a vast number of properties which one can explore. Nanomaterials
High
Low
Low High
Control of Protein
Control of Nanomaterial Chemistry/Structure thecomponents,thetwooligomerstobegeneticallyfused
canbealignedatanaxisofsymmetrythattheybothshare. Insuchascenario,therewillbetwo(ormore)polypeptide linkersinsteadofonerunningbetweenadjacent oligo-mers.Therequirementforarigida-helicallinkercould thenberemoved,withthenecessaryorientationalcontrol resultinginsteadfromthemultiplechainconnections. Thissymmetry-matchingfusionproteinstrategy success-fullygeneratedalinearfilamentand2Darrays.Anotable successrateof40%wasachievedwhenconstructing2D arrays,andoneofthearraysexhibitedexceptionallygood long-rangeorder.Thedesignof3Dcrystalsbasedonthis strategyledtolargesolidaggregateshavingcrystal-like morphology,butthelong-rangeorderrequiredfor crystal-lographicanalysishasnotbeenreportedyet.
Intheory,thesharedsymmetryaxismethodcanbeused tocreate2Dand3Darraysobeyingavarietyofdifferent symmetries,thefullrangeofwhichhasnotbeen articu-latedyet.However,anunavoidableconstraintofthe meth-odisthatonlyextendedmaterials(e.g.,2Darraysand3D crystals)canbegenerated,butnotfinitestructuressuchas molecularcages.
Interfacedesign
Computerprogramsfordesigningprotein–protein inter-actionsarebecomingincreasinglypowerful[23–25], mak-ingitpossibletodesignsequencemutationsthatdrive specificmodesofsymmetricself-association.Thishas openedupmoredirectstrategiesfordesigninglarge pro-teinassembliesandextendedmaterials.Themost conser-vativeapproachesfordesigningsuchlargeassemblies, includingmostofthesuccessfulexperimentsreportedso far,relyonanatural(ornative-like)oligomerization
motiftoprovideoneofthemodesofself-association, andcomputeralgorithmsarethenusedtointroducean additionalinterface(orinterfaces)(Box1).Thisapproach minimizesthenumberofnovelinterfacesthatmustbe successfullydesignedcomputationally.Strategiesthat combineanaturaloligomericinterfacewiththe computa-tionaldesignofanadditionalinteractionwerepresagedin experiments[26]inwhichassembliessuchasdouble-ring structuresweregeneratedbyintroducingrelatively sim-pleinterfacialfeaturessuchasahydrophobicpatchinto simpler,single-ring,naturalproteinassemblies.The suc-cessrateofthatstrategywashigherwhenthestarting structurescontainedmoresubunits(forexample,C4 com-paredtoC2),presumablyowingtothehighermultiplicity ofthenewlyintroducedinteractionsites.Inaddition,the observedassembliestypicallyshowedsubstantial devia-tionsfromtheintendedstructures,presumablyreflecting thelimitedgeometricprecisionprovidedbythesequence designstrategy.
Numeroussequencedesignstrategiesforpromoting self-associationhavebeendemonstrated,withstrategies thatdeliverthehighestgeometricspecificityplacingthe greatest demand on the sequence design process (Figure1b–e).Atoneendofthespectrum,asimple se-quenceelementsuchastwohistidinesatpositionsiand i+4ontheexposedsurfaceofana-helixhasprovedtobea straightforwardapproachfordrivingprotein self-associa-tioninthepresenceofmetals[27–29].However,the spe-cificgeometriesofthoseassociationshavebeenhardto predict[30].Higherlevelsofgeometricspecificityhave beendemonstratedinthedesignofself-associating inter-actionsinvolvinganexposedb-strandinonecase[31],and a-helicalbundlesinseveralotherstudies[32,33].Atthe
(a) (e)
(b) (c) (d)
TRENDS in Cell Biology
Figure1.Strategiesforintroducinganewoligomerizationinterface.(a)Oligomericfusionstrategy.Twodifferentoligomericproteinscanbefusedtogethertogeneratetwo oligomerizationinterfaceswithinasingleproteinsubunit,therebydrivingtheassemblyofcomplexstructures[16].Asingleproteinchainwithinthecomplexisshownin theblackrectangle.Intheexampleshown,thegreendomainderivesfromanaturaltrimerandthemagentadomainderivesfromanaturaldimer.Linkingresiduesare yellow.(b)Newinterfacesgeneratedthroughmetal-binding.Multiplehistidineresiduesincorporatedintothesideofanexposeda-helixcanconstituteanewdimeric interface[30].Twodifferentchainsareshowningreenandyellow,histidineresiduesareshowninblacklines,andmetalionsareshownasorangespheres.(c)a -Helix-basedoligomerization.a-Helicescanbedesignedtoformdifferentoligomerizationstatesbasedonwell-studiedcoiled-coilmotifs[32].Differentchainsareshownin differentcolors.(d)b-Sheet-basedoligomerization.Theopenedgeofab-sheetcanbeusedasasitefordesigningadimericinteraction[31].Twodifferentchainsare coloredingreenandcyan.(e)Denovodesignofanewinterface.Anewinterfacecanbeintroducedintoanaturaloligomerofrelativelylowinitialsymmetrytogenerate higher-orderassemblies[34].Inthecaseillustrated,multiplecopiesofanaturaltrimerareshownindifferentcolors.Onetrimer,showningreen,isliftedfromitsassembled position.Thedenovodesignedinteractionpatchesareshowninred.Thedesignedinteractionsbetweenthegreensubunitandothersubunitsareindicatedbythinlines.
Review TrendsinCellBiologyxxxxxxx,Vol.xxx,No.x
TICB-900;No.ofPages9
4
Engineered Protein Self-Assembly
782 NATURE MATERIALS | VOL 8 | OCTOBER 2009 | www.nature.com/naturematerials
REVIEW ARTICLE
NATURE MATERIALSDOI: 10.1038/NMAT2496three-dimensional architectures are enveloped in a continuous inorganic coating under near-equilibrium conditions to produce discrete core–shell hybrid nano particles23. This approach is related to templating strategies (see below), but is differentiated by the con-tinuous nature of the inorganic component and general absence of surface patterning. Sol–gel reactions, particularly those involving the hydrolysis and condensation of silica precursors, seem to be very compatible with high-fidelity wrapping. For example, organo-gel nanostructures have been successfully transcribed into silicified hybrids with cylindrical24 or helical morphology25, and similar pro-cedures have been used to prepare silica-coated porphyrin-based nanotapes26,27 and collagen fibrils28.
Increasing attention is being placed on maintaining the func-tionality of the organic architectures after silica-shell wrapping to produce core–shell hybrids with integrated properties. Ideally, the organic functionality should be retained after assimilation of the inorganic component, and remain accessible to external stimuli such as changes in pH or optical excitation27. In practice, these
triggers are transmitted to the embedded organic nanostructure through nanopores in the ultrathin silica envelope, thereby enabling collective functions to operate within a single hybrid nano-object. Significantly, these experimental protocols have been extended to the silica/organoclay wrapping of single molecules of polysaccha-rides29,30, proteins30–32, enzymes31,33 and DNA32 (Fig. 2d). In each case, the wrapped biomolecules remain structurally intact and maintain their functionality even under adverse conditions.
Nanostructure templating. A wide range of self-assembled organic
architectures have been used as supramolecular templates for the construction of original hybrid nano-objects under equilibrium conditions. In general, slow reaction rates — aided by, for exam-ple, low levels of supersaturation and reactant concentrations — are used to facilitate favourable inter actions specifically at the organic surface so that nanoscale inorganic deposition occurs preferen-tially along the accessible surfaces of the template (Fig. 2e). This site selectivity is improved in many cases by sequential exposure of the preorganized organic nanostructure to the individual inorganic reactants34. In practice, this often involves the substoichiometric binding of metal cations to the template surface, followed by adding ions/molecules that trigger inorganic deposition or crystallization. These procedures are particularly effective for the templating of metal or semiconductor nano particles within spherical objects such as dendrimer nano particles35, or on the surface of highly anisotropic biological nanostructures such as DNA36 and self-assembled micro-tubules37. Similarly, arrays of Au, Ag or Pt nanoparticles have been prepared by in situ deposition on the external or internal surface of rod-shaped tobacco mosaic virus particles34,38,39. As these hybrids are uniform in length and width, mechanically robust and accessible to physical manipulation, they may have important technological uses as components of digital memory devices39 or as electrically conducting nanowires40.
A diverse range of synthetic organic molecules has been used to prepare anisotropic nanostructures (such as filaments, tubes, helicoids and so on) that promote the template-directed assembly of integrated hybrid nanoscale objects under equilibrium condi-tions. Some representative examples include chiral lipids41,42, pep-tide-based surfactants43,44, block copolymers45,46, dendron rod–coil triblocks47,48 and T-shaped dendro-calixarene amphiphiles49 (Fig. 3). Self-assembling peptides with sequences programmed to have appropriate polar or charged surface amino acid residues50,51 that induce β-sheet (amyloid) formation52,53, or initiate coiled-coil inter-molecular interactions54, have also been investigated. In many cases, these molecules self-assemble in water into nanostructured objects by enthalpic and entropic processes, and adopt highly anisotropic architectures because of the intricacies of molecular shape and size, and specificity of the intermolecular interactions.
In general, the above amphiphiles and peptides show certain key characteristics that are designed into the molecular structure to facilitate their use as effective templates for nanoscale inorganic b
a c
e d
50 nm
80 nm 30 nm
20 nm
a b c d e f
Figure 1 | Present approaches to the construction and organization of discrete hybrid nano-objects under equilibrium conditions.a–d, Integrative assembly. Nanoscale incarceration by confinement of inorganic reactions within preformed supramolecular organic containers (a), or by self-assembly of organic subunits around preformed inorganic nanoparticles (b). Wrapping of supramolecular organic nano-objects with ultrathin inorganic shells (c). Site-directed templating of inorganic components on organic nanostructures (d). e,f, Higher-order assembly of unitary nano-object constructs by programmed aggregation (e), and extended nanostructures by multicomponent reconstitution (f).
Figure 2 | Transmission electron microscopy (TEM) images of hybrid nano-objects produced by integrative self-assembly.a, Nanoscale incarceration of a single preformed gold particle by self-assembly of viral coat proteins20. b,c, Incarceration of SiO
2 within nanoparticles of ordered
lyotropic surfactant mesophases showing interiors with concentric lamellae (b)21, and a modulated hexagonal structure (c)22, viewed
side-on. d, Supramolecular wrapping of a single-plasmid DNA molecule in a continuous ultrathin shell of condensed organoclay oligomers32.
e, Template-directed deposition of gold nanoparticles on the surface of a nanostructured tobacco mosaic virus rod-like particle to produce metallized biostructures with high shape anisotropy34. Figures reproduced
with permission: a, © 2006 ACS; b, © 1999 NPG; c, © 2002 Wiley-VCH; d, © 2007 ACS; e, © 2008 RSC.
)''0DXZd`ccXeGlYc`j_\ijC`d`k\[%8cci`^_kji\j\im\[
Engineered Protein + Scaffold
Unintended Structures
previously described: following the polystyrene colloid assem-bly, the size of the particles was tailored by shrinking via exposure to an O2/N2plasma for selected etching times. The reduction of the particle diameter by an order of magnitude, from approximately 2000 to 200 nm, allowed the investigators to reduce the size and increase the separation of the patterned features. More recently, Malmstro¨met al.103used the colloids as a mask during a SiO2deposition procedure on a gold-coated surface. After removal of the colloids, the exposed gold areas were selectively functionalized with thiols.
4.413.2.2.2. Block copolymer micelle nanolithography The ability to create nanoscale arrays of ordered nanoparticles on surfaces is useful in diverse fields, including electronics, optics, and materials development.104,105Block copolymer micelle nanolithography is a straightforward strategy to create such ordered nanoparticle structures. This strategy uses mi-celles of self-assembled block copolymers with a large solubil-ity difference between their hydrophilic and hydrophobic
segments.106,107In aqueous conditions, the block copolymers assemble into nanoscale double-layered micelles, with a hydrophilic core segregated from the bulk solution by a hydro-phobic region. These hydrophilic cores can be loaded with salt precursors (e.g., metal salts or oxides), after which the vesicles are allowed to self-assemble in hexagonally close-packed patterns on surfaces. Once assembled, the salt precursors reduce and yield the desired nanoparticles embedded in the micelle block copolymer matrix. The last step of the process consists of the removal of the block copolymers by means of a hydrogen, oxygen, or argon plasma treatment in order to obtain gold dot patterns on the desired surface. The main advantage of this technology is that the distance between the resulting nanoparticles on the surface can be finely tuned just by varying the molecular weight of the block copolymers. This strategy has been used to create gold108and silver109 nanodot arrays, as well as binary mixtures of gold and iron oxide nanoparticles.110,111Applications of self-assembling bio-molecules are also discussed inChapter 2.207, Extracellular Matrix: Inspired Biomaterials.
4.413.2.2.3. Block copolymers
Block copolymers consist of at least two chemically different polymers covalently bonded at one end.112The engaging char-acteristic of block copolymers is their intrinsic tendency to self-assemble into ordered domains at the nanoscale (Figure 7(b)), which would otherwise require both extreme effort and cost to be recreated by alternative (top-down) techniques.113These complex structures are the result of both the interaction energy between the blocks and chain stretching. Chemically different blocks favor phase separation, while the connectivity of the copolymer chains prevents this from happening, leading to spontaneous formation of well-defined structures, limited by the dimensions of the copolymer chain to around 5–50 nm,113,114without phase separation at the macroscopic level.115 The morphology of the resulting nanopatterns depends on the relative volume fraction of each component polymer114and their molecular weights. Typically, spherical, cylindrical, or lamellar shapes are observed113and known to be thermodynamically stable.116
Both the individual blocks and the resulting domains of the copolymers can be modified at will. The size, shape, and arrangement of the nanopattern domains are chemically tun-able,117while the physical, chemical, electric, and magnetic properties of each block can be additionally tailored via the incorporation of metals, ceramics, and semiconductors, thus equipping the assembled material with additional function-alities. The latter includes biological activity, conductivity, re-activity, or degradability.112 For all these reasons, block copolymer technology has been extensively used for fabrica-tion of nanomaterials.
4.413.2.2.4. DNA templating
Immobilizing proteins with controlled spacing and precision at the nanometer scale, using a DNA template, offers the oppor-tunity to mimic nature’s own biomolecular recognition pro-cesses and assembly machinery. Thus, this technique presents a unique way to further study, understand, and exploit fundamen-tal biomolecular interactions, providing vifundamen-tal insights into the field of proteomics, medicine diagnosis, and tissue engineering.
Bottom-up techniques Colloid self-assembly Deposition Colloidal stripping (a) Polymer deposition and self-assembly Protein attachment only on tailored polymer (b) Binding moiety Target protein Bound target protein DNA (c)
Figure 7 Bottom-up patterning approaches. (a) Colloidal lithography. This method is based on the use of colloidal particles (orange) dispersed in a solution, which self-assemble in hexagonally close-packed patterns on a surface, acting as a temporary mask. The subsequent deposition of a substance of interest (yellow), followed by the removal of the colloids, forms the nanopattern. (b) Block copolymers. Two chemically different polymers (represented in red and blue) covalently bonded at one end self-assemble into ordered structures (represented in Step 2). Their function can include biological activity, represented by the interaction with a biomolecule (pink) in the scheme. (c) DNA templating. DNA-functionalized surfaces (orange) are designed to exhibit binding moieties (green) at intervals of choice, which then bind target proteins from solution to form a protein pattern (pink).
190 Surface Engineering
Biofunctionalized
Nanomaterial Templated Assembly Self-assembling polymer
graft on protein
Inorganic Building Blocks
?
(1) (2) (3)
(4) (5) (6)
Figure 1.1: Examples of self-assembled or templated structures that can be achieved and the level of control or customization needed of either the material interface or the
protein. (1)Proteins can be engineered with specific structural motifs and programmed to
self-assemble[14](2) Proteins are chemically grafted with block copolymers which will self-assemble into a globular protein-diblock copolymer, upon solvent evaporation[15](3) Engineered gold nanoparticles and synthesized DNA linkers can be used to create compli-cated structures based on sequence specific interactions and annealing[105](4) Amyloid fibrils ofβ2-microglobulin peptides induced by polymer nanoparticles[106] (5)A target protein can be captured onto an interface by chemical grafting of its binding partner (for instance Avidin-Biotin) onto a material interface[84] (6) Idealization of what is needed, maximum control of nanomaterial, minimum customization of the protein needed.Portions of illustration excerpted from sources indicated above[14, 15, 84, 105, 106]
varied hydrophilicity, porosity, unique surface chemistries, and electrical properties[77, 95,
105, 107, 108]. Furthermore, they can be easily integrated into electrical devices which
exploit their chemical, optical, or electrical properties for biosensing or other detection
applications[34, 80, 109].
Recent work has suggested that undercoordinated transition metal ions could modify
protein-protein interactions and promote protein self assembly[101–103]. A material with a
high density of undercoordinated transition metal ions could be useful for enzyme
in the synthesis of nanomaterials with unique structures and morphologies[110] which
ex-pose and stabilize undercoordinated transition metals on the surface[107, 111–113]. These
surfaces could provide a high surface area and high density of undercoordinated transition
metal sites needed for such applications.
In this dissertation I report the first successful non-covalent assembly of enzymes into
an insoluble solid that contains over 99%enzymes by weight and has enhanced catalytic
activity. This is achieved by a novel enzyme assembly mechanism enabled by the unique,
undercoordinated, surface chemistry of the TiO2 anatase (001) surface. After introducing
an extremely low concentration of TiO2nanotubes, which have an active anatase-(001)-like
surface, into an enzyme solution, I first observe the growth of multilayer enzyme coatings on
the nanotubes, followed by assembly of such enzyme-coated objects into large micron-sized
structures. I demonstrate that the nanotube’s stable undercoordinated Ti sites are required
for this phenomenon. Evidence indicates that an enzyme monolayer adsorbs to the nanotube
surface, interacting with the undercoordinated Ti sites of the anatase (001) surface. This
monolayer acts as a seed for the further adsorption, with coverages equivalent to more
than 50 layers of enzyme. Finally these enzyme-coated nanotubes reach a critical size, and
self-assemble along with additional free enzyme, forming larger micron-sized structures.
This, I believe, is the first report of non-covalent immobilization of extensive protein
multilayers on a nanomaterial and the first report of the emergence of a self-assembled
mesophase of protein-nanotube conjugates. These findings present a
nanotechnology-enabled mechanism of biomaterial growth and open a new route for creating stable