FEASABILITY OF NEW METHODS FOR NURSERY GROUND IDENTIFICATION
FOR THE JUVENILE BLACKTIP SHARK (CARCHARHINUS LIMBATUS) USING
DRONE TECHNOLOGY - SAN CRISTOBAL ISLAND, GALAPAGOS
Lauren Shantel Goodman
A thesis submitted to the University of North Carolina at Chapel Hill in partial fulfillment of the requirements for the degree of Master of Science in the Department
of Environment, Ecology, and Energy in the College of Arts and Sciences.
Chapel Hill 2020
Approved by:
Jaye Cable
Alex Hearn
Adrian Marchetti
© 2020
ABSTRACT
Lauren Shantel Goodman: Feasibility of New Methods for Nursery Ground Identification for The Juvenile Blacktip Shark (Carcharhinus Limbatus) Using Drone
Technology - San Cristobal Island, Galapagos (Under the direction of Jaye Cable and Alex Hearn)
Understanding abundance patterns of megafauna critical to conservation
planning and nursery designation in the marine environment. Traditionally,
abundance of juvenile sharks around San Cristobal, Ecuador has been measured
through gill-net. New methods utilizing can contribute and expand upon the process
of defining nursery habitat through deployment as a tool following Heupel, Carlson &
Simpfendorfer’s (2007) definition stating necessity of higher density, residency, and
fidelity. Monthly drone flights were performed in conjunction with gill-net surveys to
compare efficacy of each method with ranked counts comparable across all sites (R
= 0.54, p < 0.001) and disparities between methods indicating higher captured drone
abundances. Preliminary models specify a correlation between captured drone
abundances and environmental parameters, thus providing an indication of when
and where we expect to find juvenile sharks. This new method has far-reaching
conservation implications for the GMR, as we better capture population trends of an
ACKNOWLEDGEMENTS
I want to thank everyone who helped make this thesis possible. First, I would
like to thank my co-advisors Dr. Alex Hearn (USFQ Ecuador) and Dr. Jaye Cable (UNC
Chapel Hill) for creating this great opportunity in the Galapagos and for assisting in
the finance of this study. I especially thank Dr. Hearn (USFQ Ecuador) for giving me
a great environment to work in, trusting my instinct and expertise, and giving thoughtful
feedback. This project would not have evolved the way it has without his comments,
feedback, and shark expertise.
I would also like to thank my other committee members, Dr. Adrian Marchetti
(UNC Chapel Hill) and Dr. Joel Fodrie (UNC Chapel Hill) for their insightful contribution
into my research. Special thanks to all the staff at the Galapagos Science Center
(GSC), especially Yasuní Chiriboga and Sylvia Sotamba. Yasuní provided all help and
support for gill-net surveying while Sylvia made sure all permitting was done in a timely
manner.
Thank you to Manolo, our boat driver and an integral part of the team, who
knows more about the waters around the Galapagos than I could ever wish to know.
Without his help, efficient monthly surveying would have been impossible. Lastly, I
want to express my deepest gratitude to my family and significant other. Without their
This study was conducted at the Galapagos Science Center in cooperation with the National
Park Galapagos (PNG), San Cristobal
Funds for this research were provided by those listed below:
TABLE OF CONTENTS
LIST OF FIGURES ... viii
LIST OF TABLES ... x
LIST OF ABBREVIATIONS ... xi
CHAPTER 1: INTRODUCTION ... 1
1.1 Abundance studies – importance ... 1
1.2 Blacktip Sharks – juveniles in the Galapagos ... 6
1.3 UAVs – use and capabilities... 9
1.4 Statement of problem ... 12
CHAPTER 2: RESEARCH ... 14
2.1 Study area ... 14
2.2 Materials & methods – Field ... 25
2.3 Materials & methods – Lab: ... 31
2.4 Materials & Methods – Statistical Analysis ... 35
2.5 Results ... 45
2.6 Discussion ... 60
CHAPTER 3: SUMMARY ... 70
3.1 Conclusion ... 70
APPENDIX: TABLES OF DATA FINDINGS ... 72
LIST OF FIGURES
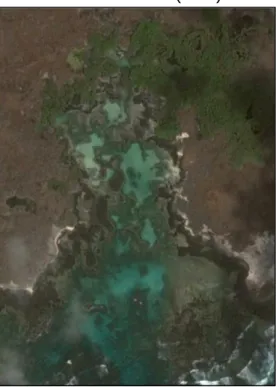
Fig. 1: Map of the lower Galapagos Archipelago ... 16
Fig. 2: Rosa Blanca 1 study site ... 17
Fig. 3: Rosa Blanca 2 study site ... 17
Fig. 4: La Tortuga study site ... 18
Fig. 5: Cerro Brujo study site ... 19
Fig. 6: Puerto Grande study site ... 19
Fig. 7: La Seca study site ... 20
Fig. 8: Manglecito study site ... 21
Fig. 9: Puerto Chino random study site ... 22
Fig. 10: Montones de Arena random study site ... 22
Fig. 11: Rosa Blanca Tourist random study site ... 23
Fig. 12: Posas de Sal random study site ... 23
Fig. 13: Galapaguera random study site... 24
Fig. 14: Silbido del Diablo random study site ... 24
Fig. 15: Playa Ochoa random study site ... 25
Fig. 16: Drone and accessories for surveys ... 27
Fig. 17: Drone still from 7 monthly sites... 29
Fig. 18: Juvenile blacktip shark aggregation ... 32
Fig. 19: Drone imagery of encountered species ... 35
Fig. 20: Methods comparison of abundance sampling ... 47
Fig. 21: Occurrence, concentration, and delta density ... 49
Fig. 22: Bayesian model effects of method ... 50
Fig. 23: Site specific juvenile blacktip shark abundance ... 51
Fig. 25: Marginal plots of influential parameters ... 58
LIST OF TABLES
Table 1: Account of nursery definitions in literature ... 5
Table 2: Zero-inflated model parameters... 39
Table 3: Spatial variation of environmental variables ... 41
Table 4: Environmental model parameters ... 44
Table 5: Site locations and survey values ... 45
Table 6: Descriptive statistics... 48
Table 7: Summary statistics Bayesian model ... 52
Table 8: Best performing models ... 54
Table 9: Averaged model parameters ... 55
Table 10: Juvenile habitat categorization ... 63
Table 11: Total drone shark abundance ... 72
Table 12: Shark abundance summary ... 73
Table 13: Raw survey data ... 73
Table 14: Shark species abundance ... 75
Table 15: Gill-net field survey table... 76
LIST OF ABBREVIATIONS
ACF: Availability correction factor
AICc Corrected Akaike Information Criterion
BIC Bayesian Information Criterion
CB: Cerro Brujo
CMAR: Eastern Tropical Pacific Marine Corridor
CPUE: Catch per unit effort
CTD: Conductivity, temperature, and depth
ENSO El Niño Southern Oscillation
GLM: General linearized model
GMR: Galapagos Marine Reserve
GPS: Global positioning system
GSC: Galapagos Science Center
LS: La Seca
LT: La Tortuga
MC: Manglecito
PG: Puerto Grande
PNG: Galapagos National Park
PSU Practical Salinity Units
RB1: Rosa Blanca 1
RB2: Rosa Blanca 2
RC: Remote control
RVI: Relative variable importance
SE: Standard error
UAV: Unoccupied aerial vehicle
CHAPTER 1: INTRODUCTION
Recently, the use of commercially available unoccupied aerial vehicles
(UAVs), also known as drones, has become a popular tool for abundance studies in
conservation ecology. UAVs have proven highly useful as a research tool across
many environments previously too remote or too dangerous to reliably survey (Joyce
et al., 2018). Due to these benefits, UAVs have expanded to marine environment studies for a multitude of species. In the Galapagos Archipelago, temporally
inundated mangrove fringed bays and other protected shallow coastal systems have
been identified as important areas for juvenile sharks. While specific sites have been
defined as nursery areas, others currently have insufficient data to classify them as
having any recorded importance. While the use of UAVs in the Galapagos is not
entirely new, no study has been published evaluating their efficacy in the marine
environment nor researching juvenile shark densities. Thus, the potential for UAVs to
capture these habitats without boat disturbance is high, leading to a more accurate
depiction of juvenile shark abundance around the archipelago.
1.1 Abundance studies – importance
The relative representation of species within an environment, also known as
relative abundance, has long been investigated in ecology. Abundance studies of
fauna are a common part of marine wildlife research and the ability to estimate
population sizes has significant policy, zoning and management implications in
defining essential habitats within ecosystems (Lancia et al., 2005; Heithaus, 2007). Additionally, understanding environmental drivers influencing abundance patterns of
certain species is integral to conservation planning (Espinoza et al., 2014). And while some environmental variables, such as mangrove coverage and seasonality, are
likely influential across a broad range of nursery grounds others are study site and
species dependent (Manson et al., 2005; DeAngelis et al., 2008; Oh et al,. 2017). Traditionally, abundance studies often relied upon species counts through
crewed flights, capture, mark, recapture studies, or counts data from other human
managed surveys (Hodgson, Kelly & Peel, 2013; McMahon et al., 2014; Fiori et al., 2017; Aniceto et al., 2018; Colefax, Butcher & Kelaher, 2018). More recently, the use of satellite data has become a popular alternative for estimating abundance of
certain species (McMahon et al., 2014; Seymour et al., 2017; Arona et al., 2018). However, while these studies have been integral in dictating conservation
management and understanding abundance and density patterns of fauna, more
recent methods may prove better suited for certain habitats.
Many of these traditional surveying methods are often expensive, dangerous,
labor intensive, or too low in spatial and temporal resolution to accurately capture
abundance of certain species (Gonzalez et al., 2016). These problems are
particularly prevalent when assessing species in a marine environment. For smaller
monitoring areas, occupied aerial surveys are cost prohibitive and thus must rely
upon human surveying efforts (Seymour et al., 2017; Joyce et al., 2018). Additionally, human led surveys may not produce an accurate account of
abundance. This may be due to the fact that capture, mark, recapture and other
diver dependent surveys are disruptive, likely offsetting the normal patterns of
Boat facilitated eyesight may simply overlook some of the target population
without substantial counting manpower. This method of surveying may also cause a
disturbance within the environment commonly known as the research boat presence
bias (Guerra et al., 2014). Remotely sensed surveys with low spatial and temporal resolution may not be able to correctly enumerate smaller species and satellite data
may be hindered by weather interference (Seymour et al., 2017; Arona et al. 2018). While these research tactics have considerably benefited conservation efforts and
abundance surveys, there are multiple drawbacks with each that may deem them
unsuitable for certain survey areas or timescales.
Abundance sampling becomes particularly important when attempting to
define discrete nursery habitats for juvenile marine species such as the shark.
Mangrove bays and shallow nearshore environments have long been studied and
recognized as potential nursery zones for a variety of marine species (Beck et al., 2001; Manson et al., 2005; Knip, Heupel, & Simpfendorfer, 2010; Sheaves et al., 2017). Generally, this is because teleosts and invertebrates occur in these habitats
at higher densities than many other surrounding locations. Additionally, spatial
partitioning of juvenile and adult populations is common across many marine species
utilizing these areas (Gillanders et al., 2003). These environments are often
considered exceedingly important for juveniles due to their higher contribution to the
adult cohort regardless of area of coverage and thus could potentially
disproportionately contribute to that population (Dahlgren et al., 2006; Nagelkerken
et al., 2015). While it is not completely understood exactly how each species benefits from these coastal environments, it is believed that juvenile site fidelity is linked to
abundance, and habitat complexity (Springer, 1967; Heupel & Hueter, 2002;
Dahlgren et al., 2006; Heupel, Carlson & Simpfendorfer, 2007; Nagelkerken, 2009). Historically, abundance has played a large role in shaping how we define
nursery areas in the marine environment. Broad scale characterizations of nursery
habitat have become more specific and testable for both conservation and
community ecology purposes while simultaneously reiterating the importance of
abundance sampling within the methodology (Table 1). Consequently, how we
define a nursery area is dependent upon the definition employed and the method for
which juvenile abundance is sampled may influence what we deem as nursery
habitat (Heupel, Carlson & Simpfendorfer, 2007). Furthermore, many genera may
also utilize juvenile habitats that are not classified as nursery areas (Gillanders et al., 2003).
However, for shark species that do utilize these habitats, a standardized
definition was previously defined to establish an area as a nursery. It states that in
order to identify a nursery habitat, it must fulfill three criteria: i) sharks must be found
within the area more than others, ii) sharks either remain in the range or return to the
same area over long periods of time, and iii) the habitat is repeatedly used over
multiple years (Heupel, Carlson & Simpfendorfer, 2007). Additionally, it is often
assumed that growth is likely enhanced or mortality reduced, though not explicitly
measured for defining an area as a nursery (Heupel, Carlson & Simpfendorfer,
2007). While multiple nursery definitions have been proposed over the years (Table
1), this specific definition was chosen due to its ease of understanding and emphasis
on nursery function. Furthermore, the nursery definition proposed by Heupel,
management on a small budget and timeframe compared to a more recent definition
promoting a seascape mosaic pattern of juvenile habitat (Nagelkerken et al. 2015).
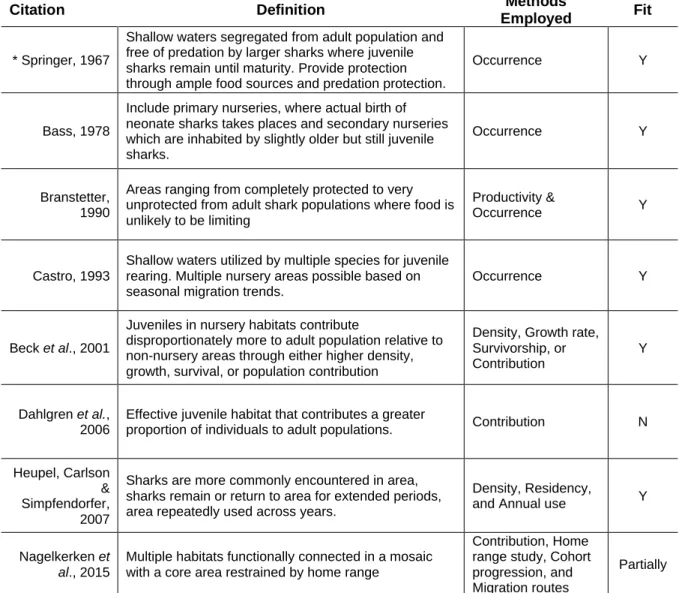
Table 1: Account of shark specific nursery definitions throughout literature, methods employed to measure area as nursery habitat, and relevant fit to research described in this paper. All definitions proceeding Springer, 1967 are created in conjunction with the original definition.
Citation Definition Methods
Employed Fit
* Springer, 1967
Shallow waters segregated from adult population and free of predation by larger sharks where juvenile sharks remain until maturity. Provide protection through ample food sources and predation protection.
Occurrence Y
Bass, 1978
Include primary nurseries, where actual birth of neonate sharks takes places and secondary nurseries which are inhabited by slightly older but still juvenile sharks.
Occurrence Y
Branstetter, 1990
Areas ranging from completely protected to very unprotected from adult shark populations where food is unlikely to be limiting
Productivity &
Occurrence Y
Castro, 1993
Shallow waters utilized by multiple species for juvenile rearing. Multiple nursery areas possible based on seasonal migration trends.
Occurrence Y
Beck et al., 2001
Juveniles in nursery habitats contribute
disproportionately more to adult population relative to non-nursery areas through either higher density, growth, survival, or population contribution
Density, Growth rate, Survivorship, or Contribution
Y
Dahlgren et al., 2006
Effective juvenile habitat that contributes a greater
proportion of individuals to adult populations. Contribution N
Heupel, Carlson & Simpfendorfer, 2007
Sharks are more commonly encountered in area, sharks remain or return to area for extended periods, area repeatedly used across years.
Density, Residency,
and Annual use Y
Nagelkerken et al., 2015
Multiple habitats functionally connected in a mosaic with a core area restrained by home range
Contribution, Home range study, Cohort progression, and Migration routes
Partially
* All following definitions build off Springer 1967 definition
While previous research has begun the process of nursery defining and
abundance measurements, very few studies have been published on the juvenile
abundance of any type of juvenile shark in the Galapagos Marine Reserve (GMR)
and all studies that have been conducted either utilized gill net survey techniques or
Thus, a more extensive mapping of juvenile blacktip abundance around a singular
island within the Galápagos would contribute greatly to future management plans.
1.2 Blacktip Sharks – juveniles in the Galapagos
This study attempts to assess the distribution, abundance, and density of
juvenile blacktip shark, Carcharhinus limbatus, within potential nursery areas surrounding San Cristobal Island, Galapagos. We have chosen to focus on this
particular species due to the availability of previous abundance survey information in
scientific literature around the archipelago, though this is likely not the only species
of juvenile sharks utilizing these areas as nursery grounds. This allows for
comparison with previous works (Llerena et al., 2015). By understanding the abundance of blacktip sharks in the GMR, population status and areas of
importance, including nursery areas, for the targeted species can be established.
This information is particularly important to the National Park Directorate, as they
have an interest in monitoring essential shark habitats within the GMR (Llerena et al., 2015).
Blacktip sharks are commonly found in tropical and subtropical waters around
the world. While easily available studies of the blacktip shark can be found back to
the early 1940s, intensive study off the east coast of the U.S. began with published
research meant to understand age structure and growth estimates during the early
1980s and 90s (Compagno, 1984; Branstetter, 1987; Castro & Beach, 1993; Castro,
1996).
The blacktip shark is characterized by a long-pointed snout, large pectoral
fins, and a large first dorsal fin, followed by a smaller second dorsal fin. Most fins
usually have black tips for both juveniles and adults (Compagno, 1984). Found both
surface, especially during the juvenile life stage near the coast (Castro, 1996).
Blacktips enjoy high salinity waters and are rarely found at depths greater than 30
meters. They maintain a diet of small boney fish and sometimes the juveniles of
other larger shark species (Compagno, 1984; Castro, 1996). Additionally, this shark
is a common fisheries species – used for their hides, meat, or oils – although not
legally fished in the Galapagos as they are a protected species (Compagno, 1984;
Castro, 1996).
Like all elasmobranchs, the blacktip shark is a relatively slow growth species
(Killam & Parsons, 1989). The species is viviparous, often giving birth every two
years. Females have a gestation period of approximately 12 months and generally
give birth to a brood between 1 and 10 pups (Compagno, 1984; Capapé et al., 2004). Juveniles are considered to be neonate for approximately 1 month (Castro,
1996). The blacktip shark reaches full maturity between 5 and 8 years, with males
maturing earlier (Compagno, 1984). Furthermore, this species is philopatric, as
females commonly return to original nursery areas to give birth (Keeney et al., 2003, 2005).
The mortality rate of juvenile blacktip sharks was recorded off the eastern
coast of the United States at 61% within their shallow nursery areas, though this rate
is likely not indicative for the species as a whole (Heupel & Simpfendorfer, 2005;
Mourier & Planes, 2013). Maximum size, age of maturity, and lengths at birth vary
regionally for the blacktip shark and are thus not comparable across regions
(Compagno, 1984; Branstetter, 1987; Castro, 1996).
The blacktip shark is known to use shallow coastal bays and mangrove
species richness moving closer towards the equator at shallow depths less than 200
meters (Espinoza et al. 2014). Other areas frequented by the blacktip shark include estuary mouths and high turbidity coastal habitats like those found near salt
marshes.
Previously, Llerena, Murillo & Espinoza (2010) found that coastal mangroves
surrounding San Cristobal Island in the Galápagos Archipelago were serving as
putative nurseries for juvenile Carcharhinus limbatus. In particular, areas
characterized by the presence of red mangrove forests (Rhizophoa mangle) located around the island are likely used by many juvenile sharks and multiple other species
as nursery areas. The red mangrove is particularly important due to the species
being most commonly associated with an extensive prop root matrix within the water
column. This analysis was later expanded to multiple islands within the Galápagos
through a combination of seasonal systematic, continuous, and random monitoring
programs (Llerena et al., 2015). Zones were determined as either nursery areas or potential nursery areas as defined by Heupel, Carlson & Simpfendorfer (2007).
These areas are particularly important as blacktip shark habitats because the
combined effects of multiple diverse juvenile habitats through environmental and
habitat heterogeneity may increase the resilience of adult populations through
portfolio effect (Yates et al. 2012). This effect states that ecosystem diversification will minimize the outcomes of environmental stochasticity on a particular population.
It is also possible that areas of high juvenile density contribute disproportionately per
unit-area to the adult populations of blacktip sharks in the GMR (Beck et al., 2001). While previous data of sites around San Cristóbal Island indicated the presence of
juvenile blacktip sharks, Simpfendorfer & Milward (1993) specified that in general,
(Paredes-Chiriboga, 2018). This has significant implications for other shark species in the
GMR, such as the endangered scalloped hammerhead (Sphyrna lewini), whose juveniles may also be utilizing these areas (Acuña-Marrero et al. 2018).
1.3 UAVs – use and capabilities
Recently, abundance studies have advanced through the use of UAVs, more
commonly known as drones. In this paper, both terms will be used interchangeably.
While historically UAVs have been associated with militarized activity, the expansion
of the consumer drone market has allowed for increased use in conservation science
(Fiori et al., 2017). Additionally, the growing availability of multirotor, fixed-wing, and transitional vertical take-off and landing (VTOL) UAVs has expanded the potential for
both large- and small-scale terrestrial and marine wildlife studies (Rees et al., 2018). Multirotor drones are particularly useful for small area marine surveys, as they
can be launched and landed from small spaces such as a boat (Colefax, Butcher &
Kelaher, 2018; Johnston, 2019). Generally speaking, small scale surveys
encompass a short range of less than 1.5 km and are often dominated by the
multirotor drone market (Rees et al., 2018). Additionally, they are more stable than fixed-wing drones, allowing for better capture and quality of video and picture with
smaller pixel sizes (Fiori et al., 2017; Colefax, Butcher & Kelaher, 2018; Joyce et al., 2018). These drones increasingly come with high resolution cameras and
multispectral or thermal sensors (Seymour et al., 2017; Johnston, 2019). High resolution images at a near vertical angle of a survey area can also effectively
eliminate the need for perception bias correctors, which have often been necessary
in traditional methods of abundance surveying (Sykora-Bodie et al., 2017). Due to the relatively low cost of UAV equipment for smaller studies, this
previously associated with population, abundance, and density studies of wildlife
(Hodgson et al., 2016; Aniceto et al., 2018; Colefax, Butcher & Kelaher, 2018; Joyce
et al., 2018). For this reason, marine megafauna surveys and conservation planning using drone technology has amplified within the past decade (Goebel et al., 2015; Linchant et al., 2015; J. C. Hodgson et al., 2016; Arona et al. 2018)
UAVs have become particularly useful in coastal habitats where waters are
oligotrophic and the seafloor is shallow, though they are still prone to limitations
caused by sea state conditions (Aniceto et al., 2018). Drones are believed to be relatively unobtrusive and less disruptive compared to more traditional methods,
especially when studying primarily marine species (Kiszka et al., 2016; Fiori et al., 2017; Aniceto et al., 2018). Because UAV flights are spatially explicit, surveys are easily replicable and provide photographic evidence of species presence (Bicknell et al., 2016; Aniceto et al., 2018; Joyce et al., 2018). This cannot be said about many of the previous measures of population survey work. Furthermore, this technology has
been useful in areas where weather patterns are often unpredictable, allowing for
greater flexibility of study duration and timing than traditional methods (Joyce et al., 2018; Johnston, 2019).
UAVs have now been used in a wide range of marine studies from dugongs
(Hodgson, Kelly & Peel, 2013) and turtles (Rees et al., 2018) to multiple different species of whales (Durban et al., 2015, 2016; Christiansen et al., 2016, 2018). The use of UAV technology to asses marine megafauna in small coastal areas has also
expanded to multiple species of sharks (Kessel et al., 2013; Kiszka et al., 2016; Rieucau et al., 2018). Many of these studies have shown potential for the use of UAVs in abundance studies over traditional options, though few have explicitly
& Kelaher, 2018). As the UAV market continues to grow and technology advances,
the use of drones for repeatable scientific surveys of marine fauna will likely become
a preferred method of study for a multitude of marine environments.
The presence of these potential coastal nursery zones around San Cristobal
Island, Galapagos makes these areas a prime region for preliminary UAV
abundance studies of juvenile blacktip sharks and marine megafauna. Coastal
waters around the island are often non-turbid and mangrove habitats are buffered
from wave action within semi-enclosed bays. These areas can potentially be labeled
as essential fish habitats,, which are defined as zones used for breeding, spawning,
feeding, or growth (Heithaus, 2007). Abundance within these coastal habitats have
significant implications, as very few studies have attempted to describe shark
densities in these areas (Acuña-Marrero et al., 2018). Additionally, shark abundance within specific coastal zones has important implications for marine park zoning in
general (Espinoza et al., 2014).
Recently, an increase in global shark tourism has necessitated larger focus on
their conservation and management (Acuña-Marrero et al., 2018). Because 65% of the Galápagos tourism industry is dependent on marine tourism (Epler, 2007) it is in
the best interest of the National Park Directorate to more effectively monitor and
protect these zones (Taylor, Hardner & Stewart, 2009). Moreover, the Galápagos
has instated full legal protection of sharks within the GMR (Zárate, 2002). The use of
drone surveys for abundance measurements may better capture areas that need
additional attention and more thoroughly investigate current coastal nursery areas
within the GMR compared to traditional techniques such as capture, mark, recapture
1.4 Statement of problem
Although the use of drones for conservation studies on marine megafauna
has steadily increased, its relevance and effect has yet to be tested within the
confines of the GMR. Little is known about the ability of drones to detect marine
megafauna in the coastal waters of San Cristobal Island, and more specifically
detect juvenile blacktip sharks. Additionally, very little research has been conducted
comparing traditional abundance surveying methods to the use of UAVs (Johnston et al., 2017; Colefax, Butcher & Kelaher, 2018). It is likely that multiple factors affect the accurate estimate of coastal juvenile shark habitat and nursery grounds, though
these factors have not been adequately tested. While the use of drones in other
studies has proven useful for studying coastal habitats of many marine animals
(Hodgson, Kelly & Peel, 2013; Durban et al., 2015; Kiszka et al., 2016; Rieucau et al., 2018), their practicality needs to be tested within the Galápagos as a potential tool for long-term coastal habitat survey use. Additionally, research on the
disturbance potential of drone related surveys is lacking and was not tested in this
research, especially for underwater species, though it is thought to be likely
negligible for species underwater (Mulero-Pázmány et al., 2017; Arona et al., 2018). This research includes two objectives addressing the use of drones and
juvenile shark abundance, which can then be broken down into 4 testable questions:
Assess the methodological factors that control accurate abundance estimates
of coastal juvenile shark habitat and nursery grounds
1. Can the use of consumer grade drones adequately capture possible shark
nursery areas in comparison to conventional methods of abundance
2. Can we begin to delimit putative nursery areas that conform to Heupel,
Carlson & Simpfendorfer’s (2007) first and second criteria? - sharks must be
found within the target area more than other areas and they tend to remain or
return for extended periods.
3. How do abundance trends in reference to nursery ground classification from
this research compare to previous attempts to define nursery areas?
Determine environmental factors influencing juvenile shark abundance between
and within targeted sites.
4. What environmental parameters are most important to increased perceived
shark abundance around San Cristobal Island, Galapagos in preliminary
studies?
The use of drones for marine megafauna surveying in the GMR has great
potential to create a relatively inexpensive way to more frequently study certain
coastal areas. Drone surveys thus have the potential to track multiyear abundance of
juvenile blacktip sharks (Carcharhinus limbatus) and aid in defining certain coastal areas around San Cristobal Island as potential nursery grounds as defined by
Heupel, Carlson & Simpfendorfer (2007) in addition to decreasing bias in abundance
sampling. The blacktip shark has been chosen because of previous work indicating
the presence of potential nursery areas around San Cristóbal Island (Llerena, Murillo
& Espinoza, 2010; Llerena et al., 2015; Prades-Chiriboga, 2018). By contributing to regular monthly surveys, specific coastal areas with higher juvenile blacktip shark
densities could possibly be defined as nursery areas and/or established as essential
CHAPTER 2: RESEARCH
2.1 Study area
The Galápagos Archipelago, under the jurisdiction of the Ecuadorian
government, consists of 13 islands and multiple islets (Miller et al., 2010). These islands straddle the equator in the Eastern Tropical Pacific and are encompassed by
the GMR – an area of protected water approximately 133,000 sq. kilometers in size.
The archipelago is considered part of the Eastern Tropical Pacific Marine
Corridor (CMAR), connecting Ecuador and the Galápagos Islands with multiple
different islands, including Cocos off the coast of Costa Rica and Central America
(Bessudo et al., 2011). The GMR records a large number of highly migratory marine
species within its waters at all times. Protected zones within the marine reserve
include limited artisanal fishing management zones, tourism zones, and “no-take”
conservation zones.
The islands are located in an area of high volcanic activity, situated on the
Galápagos mantle plume (Hoernie et al., 2000). The older easternmost islands are no longer active while only 2 of the islands in the western archipelago are
volcanically active. This activity has created an aridity gradient on the islands with
the least arid islands located within the easternmost part of the archipelago.
The climate is broken into two separate periods; a warm season from
December to May (air temperatures from 27 – 32 C) and a cool season from June
to November (air temperatures from 21 – 27 C). The water temperature consistently
current, a Cromwell counter-current, and the Equatorial Front. The Cromwell current
is particularly important in the Galapagos because it causes upwelling along the
western margins of some of the islands (in particular the western region), which is
not commonly seen in the equatorial Pacific. Because of this geographic variability,
there are multiple different coastal and pelagic habitats that have allowed for a
diverse number of shark species in the GMR (Acuña-Marrero et al., 2018).
Furthermore, this area is heavily affected by El Niño Southern Oscillation (ENSO)
cycles (Vinueza et al., 2006).
Many of the islands have mangrove fringed coastal bays or other shallow
coastal environments. These areas are highly productive and may provide safety for
juvenile sharks from predators (Llerena et al., 2015; Yates et al., 2015).
San Cristobal has a calm northwestern side with many alcoves and mangrove
lined coasts while the easternmost exposed side experiences cool and rough waters
with a rockier shoreline. While mangrove forests are present on the eastern side of
the island, they are found in fewer locations. Coastal mangrove forests around this
island have been estimated to cover between 10.5 and 118.1 hectares (Rivas-Torres
et al., 2018; Moity, Delgado, & Salinas-de-Leon, 2019). The tidal cycle around the island typically ranges 2 meters.
Seven sites around the island of San Cristobal were chosen as survey areas
for monitoring on a monthly basis, with special emphasis on 4 sites that had
previously seen higher numbers of juvenile sharks in 2017 (Paredes-Chiriboga,
2018). Five sites were located on the western side of San Cristobal, leaving 2 survey
sites for the rougher eastern side. Of the 7 proposed sites, 3 have previously been
labeled as nursery grounds or potential nursery grounds (Llerena, Murillo &
site chosen exhibited the exact same characteristics, though all sites either included
mangrove forest or were within partially protected bays around the island. All sites
were situated within zones classified for extractive use by the Galapagos National
Park (Llerena et al., 2015).
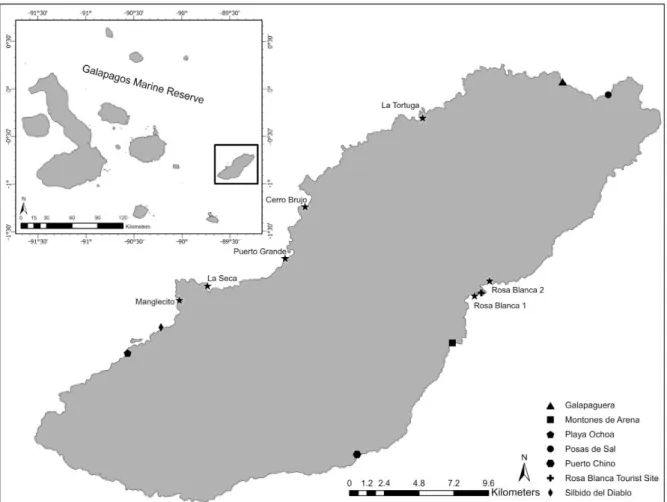
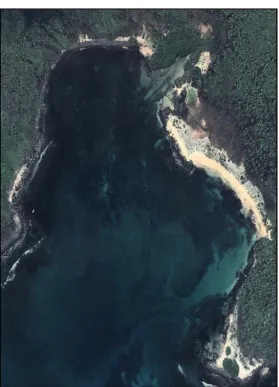
Rosa Blanca 1 (RB1) is a
mangrove-fringed bay consisting primarily of a silty sand
bottom. This site is located centrally on the
eastern side of San Cristobal Island
(-0.827966667, -89.35628333).
Fig. 2: Google Earth image of Rosa Blanca 1 study site with visible mangrove forest and small sandy beach. Image taken 24/11/2014 by digitalGlobe.
While this particular site is not specifically
visited by tourists, it is located near one of the
more popular snorkeling sites around the island. On the southern edge of this bay is
a small sandy beach and directly across sits approximately 200 meters of red
mangrove forest that is partially inundated during mid- and hightide. A small rocky
center is found at the entrance into the bay. The study area includes all coastline
starting from the entrance into the bay with particular focus on the 200-meter strip of
mangrove forest.
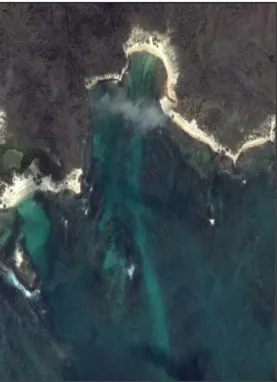
Rosa Blanca 2 (RB2) is a site similar to RB1 with a more characteristically
rocky bottom substrate. Like RB1, this site is
located centrally on the eastern coast of San
Cristobal Island (-0.8186917, -89.34694).
Fig. 3: Google Earth Image of Rosa Blanca 2 sites with visible mangrove forest and rocky coastline. Image taken 24/11/2014 by digitalGlobe.
The red mangrove forest in this area is smaller
than RB1, but a mangrove lagoon is tucked
observer. The small mangrove lagoon is characterized by a siltier sand bottom
matrix in comparison to the rest of the bay. The mangrove forest is partially
inundated. Very little sandy coastline is present at this site, instead being
characterized by rocky shores in areas not covered by red mangrove. This site is
located within sight of a landing beach used by tourist companies on the island,
though it is not frequented by tourist. A small camping site can be found on land
within a small crater that is utilized by local artisanal fishermen.
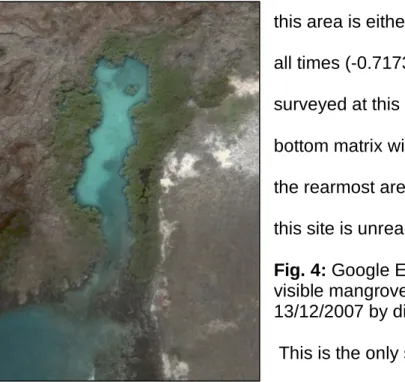
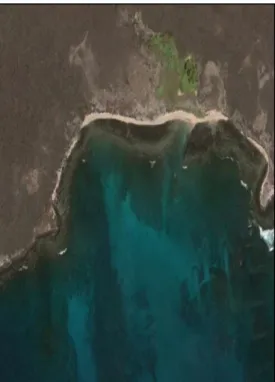
La Tortuga (LT) is a small inlet within a rocky bay that consists of both white
and red mangrove forest. Located on the northwestern side of San Cristobal Island,
this area is either fully or partially inundated at
all times (-0.717383333, -89.3884). The area
surveyed at this site consists primarily of rocky
bottom matrix with a section of sandy matrix at
the rearmost area of the inlet. During low tide,
this site is unreachable by boat.
Fig. 4: Google Earth image of La Tortuga with visible mangrove forest. Image taken
13/12/2007 by digitalGlobe.
This is the only survey site consisting solely of
fringed mangrove coastline. This site is near another bay characterized by less
mangrove forest where occasionally, juvenile blacktip sharks have been spotted. It is
likely that there is movement between this inlet and the other bay, though how much
is unknown. This site is the smallest monthly surveyed area and often home to
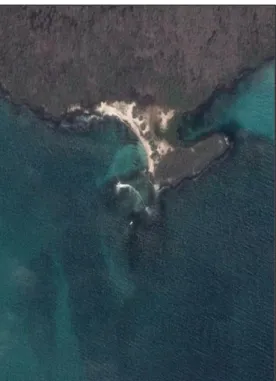
Fig. 5: Google Earth image of Cerro Brujo site. Rocky coastline evident throughout large portion of lagoon. Image taken 30/03/2018 by CNES/Airbus
Cerro Brujo (CB) isa small lagoon
located within a larger bay, much like LT. CB is
located on the northwestern side of San
Cristóbal Island, slightly south of the
compacted volcanic ash hill named “Cerro
Brujo” (-0.7726, -89.4613). This site, while
characterized by a small amount of red
mangrove forest, has a larger amount of volcanic rock shoreline than any other site.
The mangrove forest at CB is never inundated or only partially inundated for short
periods of time each day. Despite large amounts of rocky shore, the bottom matrix is
generally silty sand, with small volcanic rock deposits scattered within the lagoon.
Water depth within the lagoon is almost always low, often cutting off access to this
area and drying out another lagoon system behind it during low tide. Water at this
sight tends to be extremely oligotrophic, with
visibility to the bottom matrix during any tidal
stage. This site was chosen as a control.
Puerto Grande (PG) is by far the largest
survey site, encompassing a rock fringed bay,
large silty sand beach, and two small lagoons
surrounded by red mangrove forest.
This site is located centrally on the western side of San Cristobal Island
(-0.804716667, -89.47366667). Near the beach, the bottom matrix consists of
primarily silty sand and leftover silt in areas where red mangrove previously stood
but was washed out during a tsunami event. Entrances to the two small lagoons
have a bottom matrix consisting of approximately 50% rocks and 50% sand. The
opening of this bay is characterized by deep waters and rocky reefs. Water turbidity
at this site is often very high, especially during low tide. This site is a known juvenile
shark nursery for multiple species as well as a popular tourist spot, with large tourist
boats visiting everyday between the hours or 09:00 and 16:00. This site is also
frequented by local families.
La Seca (LS) is another site located on the western side of San Cristobal
Island (-0.821816667, -89.52186667). Just south of PG, this site is also considered a
known nursery ground for juvenile blacktip sharks. There is likely an undetermined
amount of connectivity between these two sites. LS is characterized by a large bay
area with one small lagoon of red mangrove forest. The small lagoon is the site of
interest. The bottom matrix is almost completely rocky with silty sand found only near
a smaller sandy beach before the target site
and within the mangrove forest lined lagoon.
The mangrove lagoon is closed off by large
rocks during low tide. Visibility at this site is
considerably more difficult due to turbid waters
from mangrove debris and a dark bottom
matrix that often absorbs light.
Manglecito (MC) is a monthly site nearest
to port on the central-western side of San
Cristobal (-0.830733333, -89.53925). This site
features rocky coastline with a small sandy
beach often visited by tourists.
Fig. 8: Google Earth Image of Manglecito. Two smaller bay alcoves separated by a natural volcanic rock jetty are visible. Image taken 05/05/2016 by CNES/Airbus.
MC sits near to another survey site, LS, and is
often considered part of LS by the local
population despite their separation by a large
jettison of land. This site and LS often get confused within scientific literature due to
naming conventions. The bottom matrix consists of large volcanic rocks with a small
sandy channel that runs in the middle of the bay. There is no coastal mangrove
forest at this site and is reachable during all tidal states.
In addition to the 7 monthly sites, drone surveys were conducted at a total of 7
random sites in the months of April and July. These sites were chosen based on
their similar coastal morphologies with monthly sites. By surveying expanses with
similar coastal morphologies, we were able to narrow down the “other areas”
referenced in Heupel, Carlson & Simpfendorfer’s (2007) first criterion to
environments likely suitable for nursery presence. Zero of these sites had been
previously surveyed or linked to higher than average juvenile shark abundance.
These flights are meant for comparative use to better understand densities in
targeted and nontargeted sites. A single-track drone flight was done at each of these
lack of preliminary shark data in these bays, time constraints, or restrictive
environmental conditions.
Puerto Chino is a sandy bottom bay that
is frequented by tourists and locals (-0.926625,
-89.42843).
Fig. 9: Google Earth image of Puerto Chino tourist beach. Image taken 30/03/2018 by CNES/Airbus.
Situated on the southeastern side of the island,
this area experiences rougher waters and small
waves that break on a rocky reef at the
entrance of the bay. The area is relatively small
compared to the 7 monthly survey sites and more exposed to the ocean. There is no
mangrove fringed bay at this site.
Montones de Arena is a rocky bottom bay with a small mangrove-lined lagoon
on the southeastern side of San Cristobal
(-0.8585806, -89.37025). This bay is largely
open with increased wave action during rising
tide. While the coastline is principally rocky,
there is one area with a large ‘mountain’ of silty
sand.
Fig. 10: Google Earth image of Montones de Arena rocky bay. Image taken 24/11/2014 by DigitalGlobe.
Three rocky islets make it difficult to enter the
inundated during high tide. Local fishermen have sometimes reported seeing juvenile
sharks at this location.
The tourist site at Rosa Blanca is a large lagoon with majority rocky coastline
(-0.82615, -89.35213). This site is located directly between RB1 and RB2. A small
section of mangrove fringed coast is partially
inundated, but consistently filled with plastic
debris.
Fig. 11: Google Earth image of Rosa Blanca Tourist Site between RB1 and RB2. Image taken 24/11/2014 by DigitalGlobe.
This area is highly frequented by tourist
snorkeling groups, with at least 1 tourist crowd
arrival per day, 7 days a week. The bottom
matrix is variable consisting of approximately
50% sandy bottom and 50% lava rock. Juvenile blacktip sharks have been
previously spotted at this location in low numbers. This site is popular for whitetip
reef sharks (Triaenodon obesus) who use a small cave for resting.
Posas de Sal is located on the northern
tip of San Cristobal Island (-0.703, -89.27345).
This site features a majority rocky coastline with
small sandy beaches between rocky inlets. The
bottom matrix is principally rocky, with small
patches of sand near each beach.
T bay does not have any inundated mangrove during any tidal cycle. This bay is less
protected from the open ocean than many monthly survey sites, but does not receive
large amounts of wave action due to its gradually sloped sandy bottom and location
on the western side of the island.
Galapaguera Naturaleza (0.69462,
-89.30173) is located on the northwestern side
of San Cristobal Island. The coastline consists
of a small sandy beach in a semi-enclosed
bay. The bottom matrix consists of silty sand.
This bay is close to the survey site Posas de
Sal.
Fig. 13: Google Earth Image of Galapaguera Naturaleza. Image taken 24/11/2014 by DigitalGlobe.
No mangrove forested coastline is found at this area, though a different species of
mangrove can be seen farther back from the beach. This is likely black mangrove
(Avicennia nitida), a species that is never inundated in seawater. Due to its position on the western side of the island, the water is
calmer at this location, though still prone to
waves during increasing tidal height.
Silbido del Diablo is a small enclosed
rocky bay facing MC (-0.84757, -89.55067). It is
possible to see MC from the beach at this site.
Fig. 14: Google Earth Image of Silbido del Diablo. Image taken 27/03/2014 by
This bay encompasses the smallest survey location out of all random and monthly
sites. Like its coastline, the bottom matrix of this site consists of dark lava rock. Local
fishermen have reported seeing small numbers of juvenile sharks at this location on
occasion. Its proximity to Manglecito and La Seca may explain these occurrences.
Playa Ochoa is the closest random survey site to the Baquerizo Port on San
Cristobal (-0.8635, -89.57137). Located on the
southwestern side of the island, this site is
frequented by tourists either on a 360 tour of
the island or diving and snorkeling at Kicker
Rock.
Fig. 15: Google Earth Image of Playa Ochoa tourist beach. Image taken 30/03/2018 by CNES/Airbus.
This site includes a small sandy beach
enclosed inside a rocky bay. This area does
not experience large amounts of wave action. The bottom matrix is similar to the
sand found on the beach and lightly sloped, leading to a generally shallow bay with
clear waters.
These 7 extra sites were added in an attempt to survey areas previously not
researched. While it is not expected that sharks would be found in these areas, their
environmental conditions may mirror some of the other monthly sites.
2.2 Materials & methods – Field
Monthly drone surveys were conducted at 7 shallow coastal bays around San
Cristobal Island, Galapagos from November 2018 to July of 2019. Of the 7 sites, 3
were previously labeled nursery areas or potential nursery areas (Llerena, Murillo &
is not sufficient enough to define an area as nursery ground, field work was
conducted in areas not known for juvenile shark presence as well as suspected
juvenile habitats. This was done to effectively answer criterion 1 of Heupel, Carlson,
& Simpfendorfer’s (2007) nursery definition (Heupel et al., 2018).
While the use of drones for recreation is not permitted in the Galapagos
Archipelago, research permits were obtained for all investigation related drone
surveys (scientific investigation permit: N° PC-24-18 & N° PC-13-19). Monthly
surveys were conducted over two days in order to maximize surveying time in the
early morning (0600 to 1000). This time was chosen in order to minimize sun glitter
and glare in drone footage and to coincide with what we believe is the most active
time of day for juvenile sharks due to their diel feeding pattern that preferences dawn
or dusk (Bush, 2003; Barry et al., 2008). Surveys began early mornings and often lasted until midafternoon (0600 to 1530). All surveys took place from a small
speedboat owned by a local fisherman and were conducted over 2 consecutive
days.
The Phantom 4 Pro+ (DJI) with screen integrated RC equipped with a
20-megapixel camera and 4K 60P video recording capabilities was used for all surveys.
The camera is situated on a gimbal allowing for smooth multi-angle views of survey
areas. Flight time approaches approximately 30 minutes for each fully charged
intelligent flight battery. Video transmission supported two different frequencies,
allowing for less interruption of live streamed video during flight and a flying range of
Fig. 16: Phantom 4 Pro+ with RC used for all surveys.
All flights followed a spatially explicit pattern, allowing for replication of the
same general design each month. The Phantom 4 Pro+ records flight patterns and
positioning every 0.1 second, permitting retrieval and repeatability of the original
flight. Exact flight paths could not be achieved due to RC type, which did not allow
for third-party applications that include autonomous flight planners. The drone was
consistently flown at an altitude of 20 meters following a line transect along the coast
of each survey location (Fig. 17). Flights were randomized between sites each month
allowing for comparison between and within sites in accordance with flight time.
Drone flights generally encompassed a coastal transect between 500 and 2000
meters in length, with the targeted area within the transect. The camera pointed
nadir during the entirety of every survey to prevent image distortion and flight pattern
was chosen in order to encompass the shallowest extents of each coastline. Areas
were specifically targeted due to their shallow depth, which is likely used as a
defense mechanism by juvenile sharks to keep out other larger predators (Heupel &
Simpfendorfer, 2005).
Previous attempts determined that flying at an altitude any higher than 20
meters will likely obscure identification of juvenile sharks in multiple survey areas
due to a combination of shark total length and environmental effects such as water
turbidity and bottom substrate. Swathe width and length for drone imagery
by 15-meter rectangle. Video was exclusively used for marine surveys, as still
images could be pulled from the film using the VLC 2 video viewing and editing
program when determined necessary.
Variability of inundated mangrove area on a temporal scale made it
impossible to effectively correct for juvenile shark densities within mangrove prop
roots. Additionally, the ability for a juvenile shark to swim in and out of a mangrove
covered area may lead to double counting in video, but this is unlikely due to an
average speed of 4.5 m⁄s for which all drone surveys were conducted. This is a
drawback that should be considered when calculating density values of each area in
future surveys, though it has not been accounted for in previous surveying methods.
This bias likely cannot be overcome without more extensive study of shark density
within mangrove prop roots. Although, preliminary analysis of species composition
within mangroves at multiple survey sites using GoPro cameras indicates that
juvenile blacktip sharks likely solely utilize the edges of these fringed bays and are
Fig. 17: Sample drone still shots of 7 monthly sites. Site indicated as: A) Rosa Blanca 2, B) Puerto Grande, C) Rosa Blanca 1, D) Manglecito, E) Cerro Brujo, F) La Seca, G) La Tortuga. Shoreline is found on the left side of each image.
At each site, measurements of survey start and end time, site GPS
coordinates, water clarity, sea state on the Beaufort scale, chlorophyll-a composition,
bottom composition, cloud cover, air temperature, and tidal state were measured.
Percent moon illumination was also obtained as a proxy measurement for tidal state.
The Castaway CTD, which measures GPS location, temperature, salinity,
conductivity, density, sound and pressure, was deployed monthly at each location.
Once biological and environmental sampling finished, a drone transect was flown
along the coastline of each targeted bay. After each survey, all video recordings
were immediately transferred to an external hard-drive for further analysis.
For comparison at each survey site, gill-net capture studies of juvenile blacktip
sharks were conducted. This was accomplished by setting a 100 x 3.5-meter gill-net
for 1 hour and recording the number of sharks caught over this period. Two people
were in the water at all times, snorkeling along the edges of the gill-net and removing
sharks to be measured and marked on the boat. Snorkelers were used as a
precautionary method to prevent juvenile sharks from being left within the gill-net for
long periods of time. In addition to capture, each shark was measured, weighed,
tagged, and a small amount of blood was taken before they were returned to the
water. These surveys provided an estimated value of site-specific shark abundance
through a catch per unit effort (CPUE) value as well as relative size and age
population structure for each month. Gill-net surveys were temporally staggered with
drone surveys in order to not bias video results with human disturbance in the water.
Drone and gill-net surveys were conducted from November 2018 until August
2019, with the exception of surveys in February. We were unable to survey all 7 sites
each month due to environmental factors such as rain, high winds, or rough seas. A
An additional set of 7 random sites were surveyed twice during the months of
April and July 2019. Surveys at these locations included only drone flights and
measurement of environmental variables. Gill-net surveys were not conducted at
these sites due to multiple factors including time constraints, sea state, and lack of
previous catch data. Two of the seven monthly sites, Manglecito and Rosa Blanca 2,
had never been studied in previous research and Rosa Blanca 1 had only been
studied once in previous published works (Llerena et al., 2015). Of the fourteen total
sites, only two of them had previously been definitively classified as nursery ground
for juvenile blacktip sharks. Surveys of these two sites in this research attempted to
reaffirm previous classifications. These sites were used as an additional factor
testing density values of juvenile sharks near target habitats in order to fulfil Heupel,
Carlson & Simpfendorfer’s (2007) nursery definition criterion 1. Density values of
juvenile sharks in the 7 random sites were expected to be lower than average
density values across all sites.
2.3 Materials & methods – Lab:
Representative images of blacktip shark densities were captured from the
video transects, though not used for abundance counts. Shark abundance (total
number of sharks) and density (sharks
km2 ) from drone surveys were calculated right after
field surveys concluded for that month. A count and density value were found per
site for each month. Final number of sharks at each surveyed location was an
averaged value of 3 independent counts (n = 3) for each month (Sykora-Bodie et al., 2017). This average was subsequently utilized in descriptive statistics calculations,
Fig. 18: Example image capture from drone footage displaying aggregation of juvenile blacktip sharks (Carcharhinus limbatus) in La Seca.
Species and age stages (e.g. juvenile or adult) were noted during footage
analysis in addition to abundance and density values (Fig. 19). Each independent
counter was briefed on characteristics of expected sharks encountered per survey
site. Differences between juvenile scalloped hammerhead and blacktip sharks were
readily apparent for each independent counter. Additionally, adult sharks were
obvious compared to their juvenile counterparts. Adult blacktip and whitetip reef
sharks were the most difficult to determine species differences, though not
impossible. Adult whitetip reef sharks were almost exclusively considered bottom
dwellers in small social groups while adult blacktips were often found in solitary
movement. Rostrum shape and fin tip coloration also allowed for differentiation
between adult blacktip and whitetip reef sharks in all survey locations.
ArcGIS Pro 2.4.2 (ESRI) was used to calculate the total area covered at each
survey site by using GPS points from each flight log and applying a buffer
representing the focal width of the Phantom 4 Pro camera at 20 meters height. This
utilized to create non-parametric probability density functions that were visualized
through kernel density maps. Total population density across all months was
grouped for kernel density to determine area of highest abundance within each site.
Water clarity was measured as the difference between secchi disk turbidity
measurements and total depth obtained from CTD casts. This measurement was
given the name clarity coefficient and contained a range of values between 0 and 1.
To address visibility bias, the combined effects of perception and availability bias,
videos were analyzed to measure percent sun glitter and glare through
representative images. The value was then converted to an average percent area
not obscured in survey. This process was meant to address the presence of
availability bias in drone footage. While perception bias was estimated to be
approaching zero due to the drone’s vertical vantage point over all surveyed areas
and highly oligotrophic waters surrounding the Galapagos, the clarity coefficient was
still kept as an environmental measurement. It was also presumed that perception
bias may be affected by bottom matrix composition and contrast with juvenile shark,
but we were unable to test this contribution to bias. Thus all changes to visibility bias
were reflected through an availability correction factor (ACF) and a clarity coefficient
(Sykora-Bodie et al., 2017). The correction factor was calculated using the color threshold and particle analysis tools in the ImageJ software package (1.50i). 10
random still images representative of a specific survey site video was used to
calculate a high, low, and average ACF. Therefore, a minimum, maximum, and
average density could be calculated based on the ACF.
While ACF was calculated for each video, clarity coefficients were found to be
at or above 0.75 during all surveys, indicating calculated abundance values
sites around San Cristobal Island likely mirrored that of work completed by Kessel et al. (2013), with availability bias approaching a value of zero due to shallow depth, low turbidity, and small mangrove coverage. It is possible that the choice to utilize
video instead of imagery for abundance sampling in these habitats decreased the
level of significance that availability bias plays on an observer’s ability to effectively
count juvenile blacktip sharks by allowing for the capture of movement within
non-static glare patches. Furthermore, as glare increases, we also expect to capture an
increase in overhead light availability, which may positively affect our ability to
capture juveniles (Benavides, Fodrie & Johnston, 2019). We also suggest that
turbidity within a site is non-static, and thus not accurately measurable at all
locations within the bay during flight. But, these two coefficients were still used in
analysis to determine general trends of glare and clarity effect on abundance.
Calculated abundances and densities of each site were compared to the
Fig. 19: Imagery depicting a juvenile scalloped hammerhead (A1.), juvenile blacktip shark (A2.), adult whitetip reef sharks (B.), and an adult blacktip shark (C.) as captured in drone footage.
2.4 Materials & Methods – Statistical Analysis
Viability of drone assessments as a tool for abundance surveying was
examined through performance of statistical analysis in order of increasing levels of
complexity. Descriptive statistics were first calculated and analyzed to describe the
interpretation of trends. The descriptive indicators informed next steps for statistical
comparison.
The Pearson rank correlation was used to parallel collinearity between
abundance estimates for both the drone method and gill-net CPUE values. This
correlation ranks instances within each method then compares ranks across
methods to inform on extent to which the abundance values were linearly related.
When abundance values increased in one survey method, we expected to capture a
similar value increase in the other, and vice-versa; this would indicate similar
capabilities of capturing changes in seasonal abundance patterns. A perfect positive
correlation would thus result in a Pearson coefficient value of 1. This method allowed
for a relative comparison between survey types across all sites. Relative abundance
was compared because while the drone method was able to capture an abundance
within a specified area to produce density measurements, the gill-net CPUE was a
static measurement and thus did not have a similar representative area, despite
traditionally being interpreted as a density value.
Next, direct counts were compared between both survey methods to
determine drone capability to efficiently measure abundance values of juvenile
sharks. The descriptive statistics examining abundance values across both methods
included a value of percent difference between approaches. If drone abundance
values were the same or higher than gill-net abundance values, the descriptive
statistics would indicate a positive percent difference. If the majority of surveys
demonstrated this positive percent difference, the drone survey method was
determined as a more effective measure of abundance values in the present
Due to a high number of zeros present in catch data, a more advanced
method was chosen to analyze the relationship between catch method and
abundance. Variability in the marine environment often causes a positively skewed
dataset for teleost abundance which may insufficiently present trends, and thus lead
us to an incorrect conclusion. A delta approach was used to mitigate the high
number of zeros found in this positively skewed dataset (Serafy et al., 2007). This method uses abundance metrics of occurrence, concentration, and density to
understand variation affected by a chosen level. In this case, the effect of method on
abundance was measured. Two data sets were created: one indicating presence of
a captured juvenile blacktip shark either through drone footage or 1-hour gill-net
setting (occurrence), and another describing mean catch rate when present
(concentration). The values were then multiplied together to get a delta-density index
reflecting zero inflation. The delta-density index then informed us on method effect
on abundance values.
Another tested method of accounting for the zero-inflated data while including
the effects of other parameters is through a Bayesian multilevel modeling approach.
This method was tested examining the relationship between method and abundance.
Using the R package brms (Bürkner, 2018) in R Studio (version 1.2.1335), a
zero-inflated negative binomial model was created to quantify difference between drone
and gill-net surveys (Eq. 1-3). Significance of parameters was indicated by
confidence intervals bounded away from zero. As the most complex technique used
to compare method effect on abundance, this model analyzed the effect of multiple
different variables on shark count in conjunction with survey type. This more complex
method was tested despite the availability of simpler techniques so that interactions
Zero inflation was modelled as a separate linear predictor of chosen
parameters with a logit-link function. We compared the zero-inflated model to a
similar model not accounting for the positively-skewed data inflation and ultimately
found no significant differences, thus we continued subsequent analysis with the
zero-inflated model.
Averaged independent counts for drone footage abundance were not used in
Bayesian statistics, and instead each count was included in the dataset as an
independent value with an additional parameter indicating the counter. We included
the random interaction between method and independent counter to address
potential bias from under or overcounting caused by human error. The random effect
of site location and the fixed effect of survey method were also included to account
for variance caused by site choice when comparing between abundance
methodologies (Table 2). Additionally, the fixed effect interaction between method
and water clarity was tested in an attempt to model the effect of clarity on method
choice. Level of fit was determined by examining parameter mixing across chains
and R̂ values. Priors for all beta (𝛽) parameters were set to a Cauchy distribution
with a mean value of 0 and scale of 2.5 (Cauchy (0,2.5)). The Cauchy distribution
was determined to be a weakly informative prior best fit for logistic regression
(Gelman et al., 2008). These priors were established to better localize beta parameter predictions while all other priors were pre-set by the brms package.
𝑦 ~ 𝑍𝐼𝑁𝐵(𝜆, 𝜋, 𝛿)
log(𝜆) = 𝛽0 + 𝑀𝑖 + 𝐿𝑗 + (𝑀𝐶)𝑖𝑗+ 𝑀𝐺𝑘+ 𝑊𝐶𝑙+ (𝑀𝑊𝐶)𝑖𝑙+ 𝐷𝑂𝑌𝑚+ 𝐴𝑇𝑛 + 𝑇𝑜+ 𝑀𝐼𝑝
log ( 𝜋𝑖𝑗
1 − 𝜋𝑖𝑗) = 𝛽0
(𝜋)
+ 𝑀𝑖(𝜋)+ 𝐿𝑗(𝜋)+ (𝑀𝐶)𝑖𝑗(𝜋)
(1)
(2)