© The Author 2015. Published by Oxford University Press on behalf of The Gerontological Society of America. All rights reserved.
For permissions, please e-mail: [email protected]. 89
doi:10.1093/gerona/glv162 Advance Access publication September 25, 2015
Research Article
Effects of Age and Functional Status on the Relationship
of Systolic Blood Pressure With Mortality in Mid and Late
Life: The ARIC Study
B. Gwen Windham,
1Michael E. Griswold,
2Seth Lirette,
2Anna Kucharska-Newton,
3Randi E. Foraker,
4Wayne Rosamond,
5Josef Coresh,
6Stephen Kritchevsky,
7and
Thomas H. Mosley Jr
11Department of Medicine–Geriatrics and 2Center of Biostatistics, University of Mississippi Medical Center, Jackson. 3Kucharska-Newton: Cardiovascular Disease Program, Department of Epidemiology, Gillings School of Global Public Health, University of North Carolina at Chapel Hill. 4Division of Epidemiology, The Ohio State University College of Public Health, Columbus. 5Division of Epidemiology and Community Health, University of Minnesota School of Public Health, Minneapolis. 6Welch Center for Prevention, Epidemiology, and Clinical Research, Johns Hopkins Bloomberg School of Public Health, Baltimore, Maryland. 7Sticht Center on Aging, Wake Forest School of Medicine, Winston-Salem, North Carolina.
Address correspondence to B. Gwen Windham, MD, MHS, Department of Medicine–Geriatrics, University of Mississippi Medical Center, 2500 North State Street, Jackson, MS 39216. E-mail: [email protected]
Received June 2, 2015; Accepted August 26, 2015
Decision Editor: James Goodwin, MD
Abstract
Background: Impaired functional status attenuates the relationship of systolic blood pressure (SBP) with mortality in older adults but has not been studied in middle-aged populations.
Method: Among 10,264 stroke-free Atherosclerosis Risk in Communities participants (mean age 62.8 [5.7] years; 6,349 [62%] younger [<65 years]; 5,148 [50%] men; 2,664 [26%] Black), function was defined as good function (GF) for those self-reporting no difficulty performing functional tasks and basic or instrumental tasks of daily living; all others were defined as impaired function (IF). SBP categories were normal (<120 mmHg), prehypertension (120–139 mmHg), and hypertension (≥140 mmHg). Mortality risk associated with SBP was estimated using adjusted Cox proportional hazard models with a triple interaction between age, functional status, and SBP.
Results: Mean follow-up was 12.9 years with 2,863 (28%) deaths. Among younger participants, 3,017 (48%) had IF; 2,279 of 3,915 (58%) older participants had IF. Prehypertension (hazard ratio [HR] = 1.48 [1.03, 2.15] p = .04) and hypertension (HR = 1.97 [1.29, 3.03] p = .002) were associated with mortality in younger GF and older (≥65 years) GF participants (prehypertension HR = 1.21 [1.06, 1.37] p = .005; hypertension HR = 1.47 [1.36, 1.59] p < .001). Among IF participants, prehypertension was not associated with mortality in younger participants (HR = 0.99 [0.85, 1.15] p = .93) and was protective in older participants (HR = 0.87 [0.85, 0.90] p < .001). Hypertension was associated with mortality in younger IF participants (HR = 1.54 [1.30, 1.82] p < .001) but not in older IF participants (HR = 0.99 [0.87, 1.14] p = .93).
Conclusions: Compared with younger and well-functioning persons, the additional contribution of blood pressure to mortality is much lower with older age and impaired function, particularly if both are present. Functional status and age could potentially inform optimal blood pressure targets.
Keywords: Blood pressure—Mortality—Middle aged—Functional status
The association between blood pressure (BP) and mortality in older adults remains controversial, with several studies reporting U-shaped relationships representing higher mortality risk among those with
raise the target systolic BP (SBP) for initiating and control of HTN to 150 mmHg in persons 60 years or older without diabetes or kid-ney disease. The debate over BP control is not new (8,9), despite randomized controlled trials demonstrating benefits of lowering BP in hypertensive persons older than 60 years (10–12) and in hyper-tensive persons 80 years and older in the Hypertension in the Very Elderly Trial (HYVET) (13). Opposing arguments cite attenuated benefit or even increased mortality among older participants in treat-ment arms of clinical trials of HTN (10–12,14,15), associations of higher BP with better outcomes among older adults in cohort studies (16,17), and lack of generalizability to persons frequently encoun-tered in clinical practice including those with multiple comorbidities, physical or cognitive disabilities, frailty, and those in nursing homes or assisted living facilities (8,18,19).
Age, however, may not be the best predictor of clinical risk. Measures of functional status are important vital signs of health in older adults (20), are associated with mortality and other adverse outcomes, and modify life expectancy (21,22) in older adults. Recent reports demonstrate that self-reported (fast, medium, and slow) (23) and objectively measured walking speed (24) modifies the relation-ship of BP with mortality in older adults, with no association observed between higher BP and mortality among slow walkers but a signifi-cantly higher risk of mortality among faster walkers with higher BP. These findings suggest that functional measures may be informative for understanding risks and benefits associated with HTN and HTN treatment in older persons. If functional measures provide informa-tion on mortality risk apart from age alone, funcinforma-tional status may also modify the relationship of BP to mortality in younger as well as older persons. The effect of functional status on the relationship of BP to mortality has not been examined in middle-aged populations.
The aim of this study was to examine the effects of age and func-tional status on the relationship of SBP to all-cause mortality in a middle-aged and older biracial population.
Method
Population
The Atherosclerosis Risk in Communities (ARIC) is a prospective study of a community-dwelling cohort of men and women at four sites in the United States (Forsyth County, NC; Jackson, MS; sub-urbs of Minneapolis, MN; and Washington County, MD) designed to investigate the natural history of atherosclerosis as previously reported (25). At baseline (1987–1989), 15,792 participants were sampled; participants were predominantly White in MD and MN. All participants in Jackson, MS were African American; African Americans were oversampled in Forsyth County to facilitate race-specific analyses. This analysis included 11,656 participants from the fourth exam (1997–1999), which was considered the baseline for this study, when self-reported functional status was ascertained. Those with prevalent stroke at the time of the functional assessment (n = 709) were excluded as patients with stroke may differ from those without stroke regarding risk associated with BP; partici-pants who developed stroke after the index examination were not excluded. Another 683 were missing functional status data, leaving 10,264 for the current analysis.
Functional Status and Disability Definitions
Functional status was assessed using standardized questionnaires to ascertain the level of difficulty (None, Some, A lot, and Unable) performing functional measures (26,27) and instrumental and basic activities of daily living adapted from validated questionnaires
(26–29). Participants were asked how much difficulty they have per-forming each of the following: walking room to room; transferring; dressing; feeding oneself; standing from a chair; walking ¼ mile; walking up 10 steps; stooping, crouching, kneeling; lifting or carry-ing 10 pounds; docarry-ing housework; preparcarry-ing meals; and managcarry-ing money. Good function (GF) was assigned to participants reporting “No difficulty” on all questions and impaired function (IF) otherwise.
Mortality
ARIC mortality surveillance has been previously described and was completed through December 31, 2011 (25). All participants or their proxies are contacted annually by phone. Deaths were identified through records obtained from hospitals in the ARIC surveillance catchment areas, death certificates, and interviews of next of kin for potential out-of-hospital fatal events. Death certificates from state vital statistics offices were obtained on an ongoing basis. A question-naire was also sent to participants’ physicians to confirm out-of-hospital deaths.
BP Measurements
The average of the second and third measurements of resting BP, assessed by standardized protocols with a random-zero sphygmoma-nometer, was used for this analysis. SBP was analyzed as both a con-tinuous and a categorical variable according to the American Heart Association recommendations for normal (<120 mm Hg), pre-HTN (120–139 mmHg), and HTN (≥140 mm Hg) (30).
Covariates
Self-reported demographics, education, alcohol use, and smoking status were ascertained using standardized interviews. Medications were recorded at each study visit. Body mass index (kg/m2) was
calculated from weight and height with participants wearing light-weight clothes. Heart disease (31), stroke (32), and heart failure (33,34) were ascertained as previously described using self-report, medical records, and standardized questionnaires. Laboratory assays, including lipids, were obtained using standardized protocols; glucose was measured with the hexokinase method. Diabetes was defined as a fasting glucose level ≥126 mg/dl, a random glucose level ≥200 mg/dl, or current use of hypoglycemic medications. A diagnosis of HTN (for descriptive purposes) was defined as use of antihyper-tensive medications, SBP ≥140 or diastolic BP ≥90.
Statistical Analysis
White sandwich estimators. Similar results were found with simple race- and sex-adjusted models. Sex- and race-stratified analyses were examined, and moderating effects were not supported (p value for all interactions > .15). All analyses were performed with Stata v13.1 (StataCorp, College Station, TX).
Results
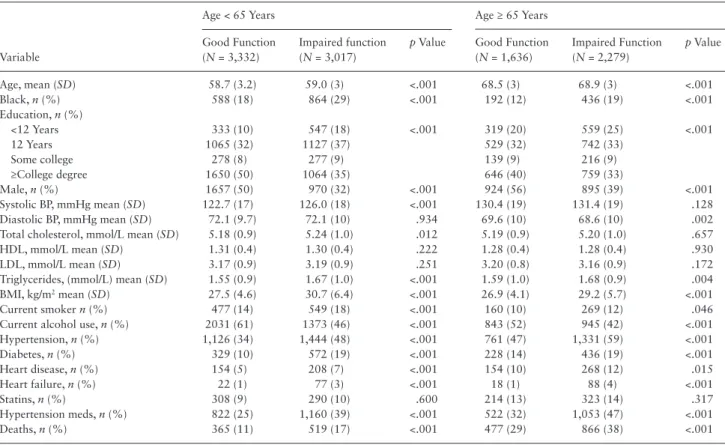
Table 1 shows characteristics of younger (<65 years) and older (≥65 years) participants stratified by Visit 4 functional status. The mean follow-up was 12.9 years. In both younger and older partici-pants, IF was associated with older age, African American race, gen-erally poorer health measures, and death. IF was associated with higher SBP, more so in younger than older participants, whereas IF was associated with lower diastolic BP in older participants. Figure 1 shows unadjusted, cumulative mortality incidence for the normo-tensive, pre-HTN, and HTN groups by age–functional status; crude HRs were similar to adjusted HRs. Mortality risk was higher in the older and IF groups.
Participants With Good Functional Status
Table 2 shows the adjusted risk of death associated with BP cat-egories comparing across the same age and functional groups, using normal SBP (<120 mm Hg) as the reference. Among participants with GF, pre-HTN was associated with a 48% increase in mortality risk in younger persons, HR = 1.48 (95% confidence interval: 1.03, 2.15) p = .036, and a 21% increase in mortality risk in older persons, HR = 1.21 (1.06, 1.37) p = .005. GF younger participants with HTN (SBP ≥ 140) showed a doubling of mortality risk compared with
normal SBP in younger persons, HR = 1.97 (1.29, 3.03) p = .002, and a 50% increase in mortality risk in older persons, HR = 1.47 (1.36, 1.59) p < .001, showing some attenuation of, but still statisti-cally and clinistatisti-cally meaningful, increased mortality risk among the older participants. Despite attenuation of risk associated with higher BP in the older groups, differences in absolute risks associated with higher SBP were comparable for those with GF. For example, the absolute risk among the younger GF group with HTN versus normal SBP was 18% versus 9% (absolute risk difference 9%); for the older group with GF, risk among those with HTN versus normal SBP was 37% and 27%, respectively, an absolute risk difference of 10%.
Participants With Impaired Functional Status
Among those with IF, pre-HTN was not associated with mortality in younger participants, HR = 0.99 (0.85, 1.15) p = .93, and was protective in older participants, HR = 0.87 (0.85, 0.90) p < .001. HTN remained associated with mortality in younger IF participants, HR = 1.54 (1.30, 1.82) p < .001, but was not associated with mortal-ity in older IF participants, HR = 0.99 (0.87, 1.14) p = .93. Notably, the confidence intervals for older IF participants did not overlap with confidence intervals for older GF participants, supporting differences in associations of HTN with mortality between the older IF and the older GF groups. Differences in absolute risks associated with HTN for younger IF participants were similar to differences observed in the GF groups but not among older participants with IF. The absolute risk among the younger IF group with HTN versus normal SBP was 26% and 16%, respectively (absolute risk difference 10%). Conversely, for the older group with IF, risk for those with HTN versus normal SBP was 44% and 41%, respectively, an absolute risk difference of 3%.
Table 1. Population Characteristics at the Baseline Functional Assessment (ARIC Visit 4) by Age and Functional Status
Variable
Age < 65 Years Age ≥ 65 Years
Good Function (N = 3,332)
Impaired function (N = 3,017)
p Value Good Function (N = 1,636)
Impaired Function (N = 2,279)
p Value
Age, mean (SD) 58.7 (3.2) 59.0 (3) <.001 68.5 (3) 68.9 (3) <.001
Black, n (%) 588 (18) 864 (29) <.001 192 (12) 436 (19) <.001
Education, n (%)
<12 Years 333 (10) 547 (18) <.001 319 (20) 559 (25) <.001
12 Years 1065 (32) 1127 (37) 529 (32) 742 (33)
Some college 278 (8) 277 (9) 139 (9) 216 (9)
≥College degree 1650 (50) 1064 (35) 646 (40) 759 (33)
Male, n (%) 1657 (50) 970 (32) <.001 924 (56) 895 (39) <.001
Systolic BP, mmHg mean (SD) 122.7 (17) 126.0 (18) <.001 130.4 (19) 131.4 (19) .128
Diastolic BP, mmHg mean (SD) 72.1 (9.7) 72.1 (10) .934 69.6 (10) 68.6 (10) .002
Total cholesterol, mmol/L mean (SD) 5.18 (0.9) 5.24 (1.0) .012 5.19 (0.9) 5.20 (1.0) .657
HDL, mmol/L mean (SD) 1.31 (0.4) 1.30 (0.4) .222 1.28 (0.4) 1.28 (0.4) .930
LDL, mmol/L mean (SD) 3.17 (0.9) 3.19 (0.9) .251 3.20 (0.8) 3.16 (0.9) .172
Triglycerides, (mmol/L) mean (SD) 1.55 (0.9) 1.67 (1.0) <.001 1.59 (1.0) 1.68 (0.9) .004
BMI, kg/m2 mean (SD) 27.5 (4.6) 30.7 (6.4) <.001 26.9 (4.1) 29.2 (5.7) <.001
Current smoker n (%) 477 (14) 549 (18) <.001 160 (10) 269 (12) .046
Current alcohol use, n (%) 2031 (61) 1373 (46) <.001 843 (52) 945 (42) <.001
Hypertension, n (%) 1,126 (34) 1,444 (48) <.001 761 (47) 1,331 (59) <.001
Diabetes, n (%) 329 (10) 572 (19) <.001 228 (14) 436 (19) <.001
Heart disease, n (%) 154 (5) 208 (7) <.001 154 (10) 268 (12) .015
Heart failure, n (%) 22 (1) 77 (3) <.001 18 (1) 88 (4) <.001
Statins, n (%) 308 (9) 290 (10) .600 214 (13) 323 (14) .317
Hypertension meds, n (%) 822 (25) 1,160 (39) <.001 522 (32) 1,053 (47) <.001
Deaths, n (%) 365 (11) 519 (17) <.001 477 (29) 866 (38) <.001
Thus, the absolute risk was higher in older persons and in those with IF. However, the absolute mortality increase attributed to HTN was similar and around 10% in younger participants, regardless of func-tional status, and in older participants with GF, whereas the absolute difference was much lower (3%) and statistically nonsignificant in older participants with IF. Consistent results were found in sensitivity analyses including the 709 participants with prevalent strokes.
Figure 2 illustrates the estimated nonlinear relationships of con-tinuous SBP with mortality by age and functional status. Median SBP values for each BP group were selected for displaying risk comparisons (SBP = 110 mmHg for those with SBP < 120 mmHg and SBP = 150 for those with SBP > 140 mmHg, vertical reference lines on plot). The x-axis shows continuous SBP along with distri-butions of SBP for each age–function group. The HRs for each of these groups are shown on the y-axis comparing any given SBP in each age–function group with the reference of a younger GF par-ticipant with SBP = 110 (HR = 1). For example, compared with a younger GF participant with SBP = 110 mmHg, an older GF par-ticipant with the same SBP had 2.6 times the mortality risk, but 4.3 times the risk for an older GF participant with SBP = 150 mmHg,
indicating that the increase in risk for an older GF participant due to SBP was HR = 4.30/2.65 = 1.63 (95% confidence interval: 1.25, 2.12). Older IF adults had higher mortality risks at lower SBP and experienced a statistically nonsignificant 5% risk increase for the same SBP increase; HR = 1.05 (95% confidence interval: 0.87, 1.29). Comparing older GF versus IF adults, the increase in SBP showed a 35% lower effect on mortality risk for IF older adults; ratio of haz-ard ratio = 0.65 (0.60, 0.69) p < .001. Similar but attenuated reduc-tions in SBP effects were seen comparing younger GF versus younger IF adults; ratio of hazard ratio = 0.82 (0.77, 0.86) p < .001. Of note, in older IF participants, we did not find support for increased mortality risk associated with HTN compared with normal SBP even when using a higher threshold of SBP = 160 mmHg, HR = 1.04 (0.76, 1.43), although the sample size was smaller (N = 741).
Discussion
In this study of middle-aged and young-old adults, both age and impaired self-reported functional status attenuated the association of SBP to mortality. In older persons and in those with IF, for whom
Figure 1. Kaplan–Meier (unadjusted) cumulative mortality incidence by systolic blood pressure group and hazard ratios for prehypertension (Pre-HTN: 120–
140 mmHg) and hypertension (HTN: ≥ 140 mmHg) compared with normal blood pressure (<120 mmHg) for the same age group and functional status.
Table 2. Adjusted Hazard Ratios Estimating Mortality Risk Associated With Pre-HTN and HTN Compared With Normal Blood Pressure in the Same Age and Functional Status Groups
Functional Group HTN Group
Younger Participants Older Participants
Deaths Hazard Ratio Deaths Hazard Ratio
Good function Normal 139/1,569 = 9% Reference 137/517 = 27% Reference
Pre-HTN 165/1,314 = 13% 1.48, p = .04 (1.03, 2.15) 217/710 = 31% 1.21, p = .005 (1.06, 1.37) HTN 95/543 = 18% 1.97, p = .002 (1.29, 3.03) 190/517 = 37% 1.47, p < .001 (1.36, 1.59)
Impaired function Normal 199/1246 = 16% Reference 271/658 = 41% Reference
Pre-HTN 206/1,249 = 16% 0.99, p = .930 (0.85, 1.15) 402/1,066 = 38% 0.87, p < .001 (0.85, 0.90) HTN 178/679 = 26% 1.54, p < .001 (1.30, 1.82) 358/809 = 44% 0.99, p = .930 (0.87, 1.14)
Notes: Models adjusted for race, sex, body mass index, smoking, diabetes, heart disease, heart failure, statin use, antihypertensive medications, and clustering by site.
the absolute mortality risk is high, the additional contribution of BP to mortality was much lower than in younger participants and in those with GF, although absolute risk differences were similar between older and younger persons with good functional status. The attenuation of risk associated with higher BP was especially evident both for those at older age and for those with IF. Clinicians could be misguided if using single BP targets for large segments of the popula-tion. The findings in this study suggest that both age and functional status can inform clinicians of risk associated with BP and suggest that developing a personalized approach to BP management that incorporates measurable factors, of which age and functional status appear to be important, may be a rational strategy.
In older persons and in those with impaired functional status, the reduced contribution of BP to mortality risk could be due in part to a higher risk of death from other conditions, for example, cancer and hip fractures. HTN also causes endovascular dysfunction that has been linked with cerebral hypoperfusion (36); long-standing hypoper-fusion of the brain or other end organs could contribute to cell death, organ dysfunction, and mortality, potentially explaining associations of lower BP with adverse outcomes. Recent studies also suggest that lower SBP is associated with higher mortality (37) and more cognitive decline (38) in selected older populations. These findings emphasize the need to elucidate mechanisms for the heterogeneity of responses to different BP levels, especially in older persons, and to develop a more personalized approach to BP management in older populations.
A large proportion (nearly half) of study participants were described as having IF using our broad definition. If a large segment of a population with impaired physical function indeed gains little to no benefit from BP control to guideline standards, this could have an immense population health impact. We caution, however, that we only considered mortality outcomes, and uncontrolled HTN contributes to other devastating outcomes including stroke. Further studies should examine the ways in which more precise assessments of functional
status might better define appropriate BP levels for subgroups in whom risks and benefits related to BP differ in mid and late life.
The current study builds upon prior studies that reported increased mortality associated with higher SBP among high-tioning adults aged 60 years or older but not among lower func-tioning older adults (23,24) by extending findings to middle-aged persons. Based on the collective findings, we suggest that risk associ-ated with higher BP should not be aggregassoci-ated by age thresholds but that age, functional status, and related life expectancies should be considered. Failure to account for modifying characteristics under-estimates risks for some, overunder-estimates for others, and may explain disconcordance across studies of relationships between BP or BP treatment and mortality.
Impaired functional status is related to mortality and other adverse outcomes (21,22) and may identify persons in whom risks of interventions outweigh benefits. Conversely, well-functioning older persons may benefit from procedures or treatments, including more aggressive BP control, similar to younger persons. For example, a high-functioning 80-year-old man whose life expectancy is 10 years might benefit from maintaining a SBP near 130 mmHg rather than 150 mmHg, but an 80-year-old man with IF whose life expectancy is 3 years might not live to see the benefit and may even have more adverse effects or potential harm. A growing literature cites the com-plexity of treating the older population and the need to consider multiple chronic conditions, time to benefit, increasing susceptibil-ity to adverse drug effects and risk of disease, qualsusceptibil-ity of life, and patient preferences (39). These considerations are often presented in the context of avoiding unnecessary interventions and burdens on older, frail persons who may not benefit and could be harmed (39). The protective direction of the association between pre-HTN and mortality, compared with the current definition of normal BP, in our study supports this view. The converse argument is equally impor-tant; high-functioning older adults with few clinical problems may achieve benefit from treatments similar to younger persons. Studies are needed to determine how functional assessments could inform clinicians of the most appropriate BP targets and how functional abilities might shift treatment targets across the life span.
Some limitations warrant discussion. Objective measures of functional status were not available and may be more sensitive than self-reported measures, particularly at higher levels of func-tional abilities. However, self-reported measures are widely avail-able, acceptable in clinical settings, and are validated measures of function (29,40). The age range of ARIC participants (52–75 years at the baseline functional assessment) limits the ability to examine relationships in the oldest old, that is, in those aged 80 and older, the subpopulation in which HTN treatment has been most contro-versial. However, the current findings among middle-aged persons with IF add to the existing literature and should motivate further investigation in other populations. Potentially, among the oldest old with IF, higher BP targets may be beneficial although this remains to be defined. Additionally, the results could be useful in developing study designs and hypotheses to elucidate optimal treatment targets.
In summary, these findings emphasize the need to consider func-tional markers of age in addition to chronologic age in estimating risk of BP in both middle-aged and older adults and underscore the relevance of simple, clinically feasible measures of function.
Funding
This work was supported by the National Heart, Lung, and Blood Institute (HHSN268201100005C, HSN268201100006C, HHSN268201100007C, HHSN268201100008C, HHSN268201100009C,
Figure 2. Nonlinear relationships of continuous systolic blood pressure
HHSN268201100010C, HHSN268201100011C, HHSN268201100 012C).
Acknowledgments
The authors thank the staff and participants of the ARIC study for their important contributions.
Conflict of Interest
There are no conflicts for any of the authors.
References
1. Langer RD, Criqui MH, Barrett-Connor EL, Klauber MR, Ganiats TG. Blood pressure change and survival after age 75. Hypertension. 1993;22:551–559.
2. Boshuizen HC, Izaks GJ, van Buuren S, Ligthart GJ. Blood pressure and mortality in elderly people aged 85 and older: community based study. BMJ. 1998;316:1780–1784.
3. Mattila K, Haavisto M, Rajala S, Heikinheimo R. Blood pressure and five year survival in the very old. Br Med J (Clin Res Ed). 1988;296:887–889. 4. Hakala SM, Tilvis RS, Strandberg TE. Blood pressure and mortality in an
older population. A 5-year follow-up of the Helsinki Ageing Study. Eur Heart J. 1997;18:1019–1023.
5. James PA, Oparil S, Carter BL, et al. 2014 Evidence-based guideline for the management of high blood pressure in adults: report from the panel mem-bers appointed to the Eighth Joint National Committee (JNC 8). JAMA. 2014;311:507–520. doi:10.1001/jama.2013.284427
6. Peterson ED, Gaziano JM, Greenland P. Recommendations for treat-ing hypertension: what are the right goals and purposes? JAMA. 2014;311:474–476. doi:10.1016/j.ypmed.2013.12.014
7. Ortiz E, Oparil S, James PA. Guidelines for managing high blood pres-sure–reply. JAMA. 2014;312:295–296. doi:10.1001/jama.2013.284427 8. Goodwin JS. Embracing complexity: a consideration of hypertension in
the very old. J Gerontol A Biol Sci Med Sci. 2003;58:653–658. 9. Aronow WS. Commentary on “embracing complexity: a
considera-tion of hypertension in the very old”. J Gerontol A Biol Sci Med Sci. 2003;58:659–660.
10. Amery A, Birkenhager W, Brixko R, et al. Efficacy of antihypertensive drug treatment according to age, sex, blood pressure, and previous cardiovascu-lar disease in patients over the age of 60. Lancet. 1986;2:589–592. 11. Dahlöf B, Lindholm LH, Hansson L, Scherstén B, Ekbom T, Wester PO.
Morbidity and mortality in the Swedish Trial in Old Patients with Hyper-tension (STOP-HyperHyper-tension). Lancet. 1991;338:1281–1285.
12. Staessen JA, Fagard R, Thijs L, et al. Subgroup and per-protocol analysis of the randomized European Trial on Isolated Systolic Hypertension in the Elderly. Arch Intern Med. 1998;158:1681–1691.
13. Beckett NS, Peters R, Fletcher AE, et al. Treatment of hypertension in patients 80 years of age or older. N Engl J Med. 2008;358:1887–1898. doi:10.1056/NEJMoa0801369
14. Gueyffier F, Bulpitt C, Boissel JP, et al. Antihypertensive drugs in very old people: a subgroup meta-analysis of randomised controlled trials. INDANA Group. Lancet. 1999;353:793–796.
15. Law MR, Morris JK, Wald NJ. Use of blood pressure lowering drugs in the prevention of cardiovascular disease: meta-analysis of 147 randomised tri-als in the context of expectations from prospective epidemiological stud-ies. BMJ. 2009;338:b1665. doi:10.1136/bmj.b1665
16. Peralta CA, Katz R, Newman AB, Psaty BM, Odden MC. Systolic and diastolic blood pressure, incident cardiovascular events, and death in elderly persons: the role of functional limitation in the Cardiovascular Health Study. Hypertension. 2014;64:472–480. doi:10.1161/HYPER-TENSIONAHA.114.03831
17. Sabayan B, van Vliet P, de Ruijter W, Gussekloo J, de Craen AJ, Westen-dorp RG. High blood pressure, physical and cognitive function, and risk of stroke in the oldest old: the Leiden 85-plus Study. Stroke. 2013;44:15–20. doi:10.1161/STROKEAHA.112.663062
18. Douma S, Petidis K, Zamboulis C. Treatment of hypertension in the elderly. N Engl J Med. 2008;359:971–972. doi:10.1056/NEJMc081224 19. Messerli FH, Sulicka J, Gryglewska B. Treatment of hypertension in the
elderly. N Engl J Med. 2008;359:972–973.
20. Fritz S, Lusardi M. White paper: “walking speed: the sixth vital sign”. J Geriatr Phys Ther. 2009;32:46–49.
21. Guralnik JM, Ferrucci L, Simonsick EM, Salive ME, Wallace RB. Lower-extremity function in persons over the age of 70 years as a predictor of subsequent disability. N Engl J Med. 1995;332:556–561.
22. Keeler E, Guralnik JM, Tian H, Wallace RB, Reuben DB. The impact of functional status on life expectancy in older persons. J Gerontol A Biol Sci Med Sci. 2010;65:727–733. doi:10.1093/gerona/glq029
23. Odden MC, Covinsky KE, Neuhaus JM, Mayeda ER, Peralta CA, Haan MN. The association of blood pressure and mortality differs by self-reported walking speed in older Latinos. J Gerontol A Biol Sci Med Sci. 2012;67:977–983. doi:10.1093/gerona/glr245
24. Odden MC, Peralta CA, Haan MN, Covinsky KE. Rethinking the association of high blood pressure with mortality in elderly adults: the impact of frailty. Arch Intern Med. 2012;172:1162–1168. doi:10.1001/archinternmed.2012.2555 25. The Atherosclerosis Risk in Communities (ARIC) Study: design and
objec-tives. The ARIC Investigators. Am J Epidemiol. 1989;129:687–702. 26. Nagi S. An epidemiology of disability among adults in the United States.
Milbank Mem Fund Q. 1976;54:439–467.
27. Rosow I, Breslau N. A Guttman health scale for the aged. J Gerontol. 1966;21:556–559.
28. Katz S, Ford AB, Moskowitz RW, Jackson BA, Jaffe MW. Studies of illness in the aged. The index of ADL: a standardized measure of biological and psychosocial function. JAMA. 1963;185:914–919.
29. Lawton MP, Brody EM. Assessment of older people: self-maintaining and instrumental activities of daily living. Gerontologist. 1969;9:179–186. 30. Chobanian AV, Bakris GL, Black HR, et al. The Seventh Report of the Joint
National Committee on Prevention, Detection, Evaluation, and Treatment of High Blood Pressure: the JNC 7 report. JAMA. 2003;289:2560–2572. doi:10.1001/jama.289.19.2560
31. Toole JF, Chambless LE, Heiss G, Tyroler HA, Paton CC. Prevalence of stroke and transient ischemic attacks in the Atherosclerosis Risk in Com-munities (ARIC) study. Ann Epidemiol. 1993;3:500–503.
32. Chambless LE, Shahar E, Sharrett AR, et al. Association of transient ischemic attack/stroke symptoms assessed by standardized questionnaire and algo-rithm with cerebrovascular risk factors and carotid artery wall thickness. The ARIC Study, 1987–1989. Am J Epidemiol. 1996;144:857–866. 33. Eriksson H, Caidahl K, Larsson B, et al. Cardiac and pulmonary causes of
dyspnoea—validation of a scoring test for clinical-epidemiological use: the Study of Men Born in 1913. Eur Heart J. 1987;8:1007–1014.
34. Bell EJ, Lutsey PL, Windham BG, Folsom AR. Physical activity and car-diovascular disease in African Americans in Atherosclerosis Risk in Communities. Med Sci Sports Exerc. 2013;45:901–907. doi:10.1249/ MSS.0b013e31827d87ec
35. Royston P, Lambert PC. Flexible Parametric Survival Analysis Using Stata: Beyond the Cox Model. College Station, TX: Stata Press; 2011. 36. Scuteri A, Nilsson PM, Tzourio C, Redon J, Laurent S. Microvascular brain
damage with aging and hypertension: pathophysiological consideration and clinical implications. J Hypertens. 2011;29:1469–1477. doi:10.1097/ HJH.0b013e328347cc17
37. Benetos A, Labat C, Rossignol P, et al. Treatment with multiple blood pres-sure medications, achieved blood prespres-sure, and mortality in older nursing home residents: The PARTAGE Study. JAMA Intern Med. 2015;175:989– 995. doi:10.1001/jamainternmed.2014.8012
38. Mossello E, Pieraccioli M, Nesti N, et al. Effects of low blood pressure in cog-nitively impaired elderly patients treated with antihypertensive drugs. JAMA Intern Med. 2015;175:578–585. doi:10.1001/jamainternmed.2014.8164 39. Boyd CM, Darer J, Boult C, Fried LP, Boult L, Wu AW. Clinical practice
guidelines and quality of care for older patients with multiple comorbid diseases: implications for pay for performance. JAMA. 2005;294:716– 724. doi:10.1001/jama.294.6.716