Genomic regions associated with
susceptibility to Barrett’s esophagus and
esophageal adenocarcinoma in African
Americans: The cross BETRNet admixture
study
Xiangqing Sun1, Apoorva K. Chandar2, Marcia I. Canto3, Prashanthi N. Thota4, Malcom Brock5, Nicholas J. Shaheen6, David G. Beer7, Jean S. Wang8, Gary W. Falk9, Prasad G. Iyer10, Julian A. Abrams11, Medha Venkat-Ramani2, Martina Veigl12,
Alexander Miron13, Joseph Willis14, Deepa T. Patil15, Ilke Nalbantoglu16, Kishore Guda12, Sanford D. Markowitz17, Xiaofeng Zhu1, Robert Elston1, Amitabh Chak2,12*
1 Department of Population and Quantitative Health Sciences, Case Western Reserve University, Cleveland,
OH, United States of America, 2 Division of Gastroenterology and Hepatology, University Hospitals Cleveland Medical Center, Case Western Reserve University School of Medicine, Cleveland, OH, United States of America, 3 Division of Gastroenterology and Hepatology, Johns Hopkins Medical Institutions, Baltimore, MD, United States of America, 4 Department of Gastroenterology and Hepatology, Cleveland Clinic, Cleveland, OH, United States of America, 5 Department of Cardiology and Thoracic Surgery, Johns Hopkins Medical Institutions, Baltimore, MD, United States of America, 6 Center for Esophageal Diseases & Swallowing, University of North Carolina at Chapel Hill School of Medicine, Chapel Hill, NC, United States of America, 7 Thoracic Surgery, Department of Surgery, University of Michigan, Ann Arbor, MI, United States of America, 8 Division of Gastroenterology, Washington University School of Medicine, St Louis, MO, United States of America, 9 University of Pennsylvania Perelman School of Medicine, Philadelphia, PA, United states of America, 10 Division of Gastroenterology and Hepatology, Mayo Clinic, Rochester, MN, United States of America, 11 Department of Medicine, Columbia University Medical Center, New York, NY, United States of America, 12 Division of General Medical Sciences (Oncology), Case Comprehensive Cancer Center, Case Western Reserve University School of Medicine, Cleveland, OH, United States of America,
13 Department of Genetics and Genome Sciences, Case Western Reserve University School of Medicine,
Cleveland, OH, United States of America, 14 Department of Pathology, University Hospitals Case Medical Center, Case Western Reserve University School of Medicine, Cleveland, OH, United States of America,
15 Department of Pathology, Cleveland Clinic, Cleveland, OH, United States of America, 16 Department of
Pathology and Immunology, Washington University School of Medicine, St. Louis, MO, United States of America, 17 Division of Oncology and Case Comprehensive Cancer Center, Case Western Reserve University School of Medicine, Cleveland, OH, United States of America
Abstract
Background
Barrett’s esophagus (BE) and esophageal adenocarcinoma (EAC) are far more prevalent in European Americans than in African Americans. Hypothesizing that this racial disparity in preva-lence might represent a genetic susceptibility, we used an admixture mapping approach to inter-rogate disease association with genomic differences between European and African ancestry.
Methods
Formalin fixed paraffin embedded samples were identified from 54 African Americans with BE or EAC through review of surgical pathology databases at participating Barrett’s
a1111111111 a1111111111 a1111111111 a1111111111 a1111111111 OPEN ACCESS
Citation: Sun X, Chandar AK, Canto MI, Thota PN, Brock M, Shaheen NJ, et al. (2017) Genomic regions associated with susceptibility to Barrett’s esophagus and esophageal adenocarcinoma in African Americans: The cross BETRNet admixture study. PLoS ONE 12(10): e0184962.https://doi. org/10.1371/journal.pone.0184962
Editor: Ken-ichi Mukaisho, Shiga University of Medical science, JAPAN
Received: March 31, 2017
Accepted: September 4, 2017
Published: October 26, 2017
Copyright:©2017 Sun et al. This is an open access article distributed under the terms of the
Creative Commons Attribution License, which permits unrestricted use, distribution, and reproduction in any medium, provided the original author and source are credited.
Data Availability Statement: All genetic data files are available from the dbGaP database. Please reference this accession for the study data deposit in dbGAP: phs001454.v1.p1. The study summary is also available on the dbGaP preview page through this url:https://www.ncbi.nlm.nih.gov/ projects/gapprev/gap/cgi-bin/preview1.cgi?GAP_ phs_code=zIWSRXTtNPlskbVZ.
Esophagus Translational Research Network (BETRNet) institutions. DNA was extracted from normal tissue, and genotyped on the Illumina OmniQuad SNP chip. Case-only admix-ture mapping analysis was performed on the data from both all 54 cases and also on a sub-set of 28 cases with high genotyping quality. Haplotype phases were inferred with Beagle 3.3.2, and local African and European ancestries were inferred with SABER plus. Disease association was tested by estimating and testing excess European ancestry and contrasting it to excess African ancestry.
Results
Both datasets, the 54 cases and the 28 cases, identified two admixture regions. An associa-tion of excess European ancestry on chromosome 11p reached a 5% genome-wide signifi-cance threshold, corresponding to -log10(P) = 4.28. A second peak on chromosome 8q reached -log10(P) = 2.73. The converse analysis examining excess African ancestry found no genetic regions with significant excess African ancestry associated with BE and EAC. On average, the regions on chromosomes 8q and 11p showed excess European ancestry of 15% and 20%, respectively.
Conclusions
Chromosomal regions on 11p15 and 8q22-24 are associated with excess European ances-try in African Americans with BE and EAC. Because GWAS have not reported any variants in these two regions, low frequency and/or rare disease associated variants that confer sus-ceptibility to developing BE and EAC may be driving the observed European ancestry asso-ciation evidence.
Introduction
Esophageal adenocarcinoma (EAC) is the seventh leading cause of death in U.S. males [1] and one of the deadliest cancers worldwide, with 5-year survival rates lower than 20% [2], and in the United States the incidence rate has increased dramatically up to 7-fold over the past three decades [3,4]. EAC tends to arise from Barrett’s esophagus (BE), which replaces the squamous epithelium with columnar-lined metaplastic epithelium in the lower esopha-gus during healing reflux esophagitis and may progress to dysplasia [5]. BE and EAC are rare in African Americans (AA), with the majority of cases occurring in European Ameri-cans (EA) [6–12]. Although EAC occurs at least five-fold more frequently in EAs than AAs [13], the distribution of known risk factors for BE and EAC (e.g. GERD [14], obesity [15,16], etc) are at least as common in AA as EA, suggesting another basis for the racial differences.
Hypothesizing that this racial/ethnical difference in prevalence might represent a genetic susceptibility, we used an admixture mapping approach to interrogate disease association with genetic differences in European and African ancestry using a multi-institutional sample of AA patients with EAC or BE. Although our sample size is limited because of the rareness of BE in AA patients, we demonstrate here–the first and the only admixture mapping study of BE and EAC we know of–how this approach can efficiently find regions of genetic susceptibility for this disease.
the National Cancer Institute (NCI). AC received the funding. The funders had no role in study design, data collection and analysis, decision to publish, or preparation of the manuscript.
Materials and methods
Samples and genotyping
The study was approved by the Institutional Review Board of the University Hospitals of Cleveland. Formalin fixed paraffin embedded (FFPE) samples were identified from 54 AA patients with EAC or BE through review of surgical pathology databases at eight participat-ing BETRNet institutions. The samples were coded and had no identifyparticipat-ing information. The codes and identifying information were kept secure at each individual institution and were only available to the institutional investigator who identified the subject, and were not available to any other research personnel. Germline DNA was extracted from normal tissue of the samples, generally from squamous epithelium; in 9 cases the germline DNA was obtained from other non-neoplastic tissues (5 gastric, 2 colonic, 1 vocal cord, and 1 adipose tissue biopsies). DNA samples were genotyped on the Illumina OmniQuad SNP chip. We considered BE and EAC to be part of the same trait, theorizing that at least a proportion of EAC arose from BE.
Of the 54 patient samples, 30 had a genotyping call rate>0.95 and, after excluding 2 sam-ples because of very low heterozygosity rates (outside the range of 3 standard deviations from the mean heterozygosity), we formed an enriched sample set of 28 samples.
There were 2.3 million SNPs genotyped, but upon additional processing following instruc-tions from Illumina technologists, and restricting SNPs to call rates greater than 96.4%, 378,711 SNPs were available for data analysis.
For the admixture mapping study, the two ancestry populations were selected from the 1000 genome project [17], which included genotype data on 87 Europeans (CEU) and 88 Afri-cans (YRI). After further filtering SNPs that could not match with SNPs in the 1000 genome data, or had no variation in our sample, we finally had 289,112 SNPs on the 22 autosomal chromosomes for admixture mapping.
Admixture mapping analysis
We performed admixture mapping analysis using all the 54 EAC/BE cases as well as using just the cleaned samples comprising 28 cases.
Phases of the 54 and 28 cases were respectively inferred by Beagle 3.3.2 [18], then local Afri-can and European ancestries for each dataset were estimated with SABER [19].
Because the dataset of 54 EAC cases has a lower sample call rate than the dataset of 28 cases, we first compared the allele frequencies in the 54 individuals with those estimated from the 1000 genome data (estimated as 0.8 freqYRI+0.2 freqCEU) for the same allele at each SNP. Among the 289,112 autosomal SNPs, 908 SNPs had an allele frequency difference>0.3. For the dataset of 54 individuals, we did two admixture mapping analyses: one using all the 289,112 SNPs, and the other excluding these 908 SNPs.
Test of excess European or African ancestry
The incidence of esophageal adenocarcinomas in EAs is five times higher than that in AAs [13,20,21], and so any excess of European ancestry at a SNP could be detecting a region har-boring susceptibility variants for EAC and BE. Conversely, such a region would not show excess African ancestry. Excess European and African ancestries were estimated and tested by the following method [22].
Assume we have a total of N individuals and L marker loci.
The excess European ancestry is estimated asDPl¼1
N
PN
i¼1ðqil MiÞ, where Mi ¼1
L
PL
l¼1qil.
Then the Z score test statistic is defined asZl ¼ DPl
SDðDPlÞ, whereSD(ΔPl) is the common
stan-dard deviation ofΔPlestimated over all the markers.
In view of the large numbers,Zlfollows a standard normal distribution, and the test for excess European ancestry was conducted at each locus, using a right tailed test. The test of excess African ancestry, that is, the association of esophageal adenocarcinomas being due to African ancestry, was conducted by using a left tailed test with the same statistic.
Estimating the number of independent tests
The number of independent tests was estimated by the eigenvalue method using the local ancestry of each chromosome [23] and summed up over the 22 autosomal chromosomes. That is, for each chromosome, we calculated the eigenvalues of the correlation matrix of the local ancestry of SNPs on that chromosome, and the effective number of independent tests for that
chromosome was estimated asM¼ Pn
i¼1
ffiffiffi
li
p Pn
i¼1li
, whereλiis thei-th eigenvalue andnis the total
number of eigenvalues for that chromosome.
Results
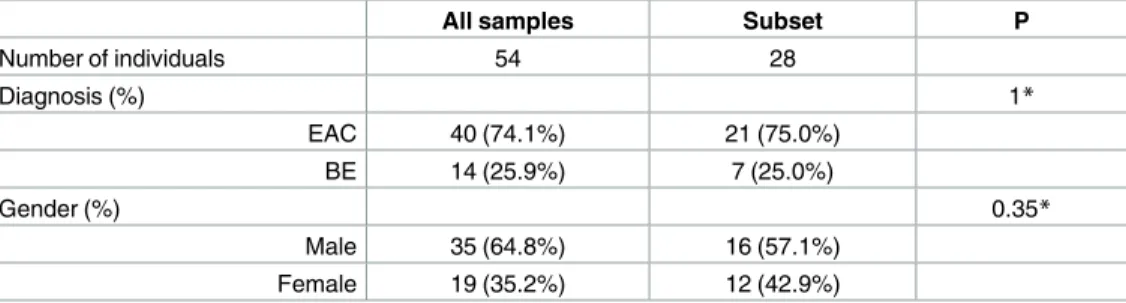
There is no significant difference on demographic statistics between the whole samples of 54 individuals and the subset of 28 individuals (Table 1). In addition, the whole sample of 54 indi-viduals has mean proportion (±standard error) of European ancestry 0.32±0.20, and the sub-set of 28 individuals has mean proportion of European ancestry 0.27±0.14; both are close to estimates of African ancestry in the literature [24,25].
The number of independent tests
By the eigenvalue method, the number of independent tests for 54 individuals estimated using all SNPs is 288.3; after excluding the 908 SNPs it is 281.9. The number of independent tests for the 28 individuals using all SNPs is 252.2. Thus, the corresponding 5% genome-wide thresh-olds of association tests are respectively for the three scenarios 0.000173 (corresponding to -log10(P) = 3.76), 0.000177 (corresponding to -log10(P) = 3.75), and 0.000198 (corresponding to -log10(P) = 3.70).
Table 1. Demographic statistics of the admixed population of EAC/BE patients.
All samples Subset P
Number of individuals 54 28
Diagnosis (%) 1*
EAC 40 (74.1%) 21 (75.0%)
BE 14 (25.9%) 7 (25.0%)
Gender (%) 0.35*
Male 35 (64.8%) 16 (57.1%)
Female 19 (35.2%) 12 (42.9%)
*Chi square test of association between the data of 28 individuals and the remaining data of 26 (= 54–28) individuals.
Excess of European ancestry
The results of genome-wide excess of European ancestry among the AA EAC/BE patients are shown inS1–S3Figs. From all the 54 patients, removing the 908 SNPs that have allele fre-quency difference>0.3 did not decrease the admixture mapping signal (S1–S3Figs; Figs1 and2). The highest excess of European ancestry signals that are in common for the 54- and 28-patient datasets are on chromosomes 11 and 8 (Figs1and2). From the 28 patients, the maximum association signal (-log10(P)) on chromosomes 8 and 11 are respectively 2.73 and 4.28. Because the genome-wide significance threshold for this dataset is 3.70, the signal on chromosome 11 reached genome-wide significance (Fig 2). From the 54 patients without the 908 SNPs, the maximum association signals (-log10(P)) on chromosomes 8 and 11 are respec-tively 3.32 and 3.51, which do not reach the genome-wide significance threshold of 3.75.
The region of excess European ancestry on chromosome 8 is from 90.4 Mb to 129 Mb, with the peak at 106.3 Mb, and the excess of European ancestry at the peak is 0.15 (S1 File). The region of excess European ancestry on chromosome 11 is from 5.6 Mb to 42.4 Mb, with the two peaks at 24.8 Mb and 32.5 Mb respectively, and the maximum mean excesses of European ancestry are 0.18 and 0.2 (S1 File).
Fig 1. Admixture mapping test for excess European ancestry on chromosome 8 using all 54 AA patients and the subset of 28 high genotyping quality patients, respectively.
https://doi.org/10.1371/journal.pone.0184962.g001
Fig 2. Admixture mapping test for excess European ancestry on chromosome 11 using all 54 AA patients and the subset of 28 high genotyping quality patients, respectively.
Excess African ancestry
No association due to excess African ancestry reached any genome-wide significance threshold for any of the three datasets; the strongest associations due to African ancestry are on chromo-somes 15 and 16, but they are far from reaching genome-wide significance level: the associa-tion P-values for the three datasets are all>0.001 (S4–S6Figs).
It is noteworthy that, compared with the association due to European ancestry, fewer and lower association peaks due to African ancestry are found (compareS1–S3Figs withS4–S6 Figs)
Discussion
Admixture mapping is an effective tool for discovering genetic regions associated with disease. The method interrogates a recently admixed population such as AAs for genetic associations to diseases when prevalence differs markedly between the ancestral Caucasian and African populations [26–30]. Admixture mapping is particularly more powerful than GWAS in detect-ing regions that harbor rare or multiple different disease variants [31]. Admixture studies are cost effective, require less dense maps, and compared to association studies, they do not assume a disease model [31]. The identification of ancestry informative markers (AIMS) enables such approaches to be successful in diseases such as BE and EAC, whose prevalence are vastly disparate between AAs and EAs [32–38]. In this study, we performed a genome-wide case only admixture mapping association study of BE and EAC using 54 BE/EAC cases and a subset of 28 cases with high genotyping quality. We identified two chromosome regions with excess European ancestry in both datasets; one on chromosome 11p15, which reached genome-wide significance in the 28 cases, and a second one on chromosome 8q22-24. It is not surprising that the results from the two datasets are consistent, but it does suggest that the sig-nals are not caused by genotype errors. We did not find any significant chromosome region with excess African ancestry. Because no common variants have been reported in these two regions in the genome wide association studies of BE/EAC so far, the current result indicates that these two regions with excess European ancestry likely harbor low frequency and/or rare disease associated variants that confer susceptibility to developing BE and EAC.
The fact that there are more and higher admixture mapping peaks of excess European ancestry than of excess African ancestry is consistent with the higher prevalence of BE and EAC in European Americans than in African Americans. Although not conclusive, this is cer-tainly suggestive.
At the admixture peak on chromosome 8, we have a mean excess European ancestry of 0.15; and at the admixture peak on chromosome 11, we have a higher mean excess European ancestry of 0.2. Assuming an additive model for the genetic variants, the estimated relative risks for European alleles in the chromosome 8q and 11p regions would be 1.93 and 2.81, respectively (S1 File). However, because of the large number of regions examined, these are over-estimates due to the winner’s curse.
locates at the rightmost (the highest) peak on chromosome 11; it is a tumor-suppressor gene [52] that encodes a zinc finger transcription factor regulating transcription of growth factors such as PDGF-A [53], growth factor receptor (IGF-IR) [54] and other genes (RAR-α, c-myc and bcl-2) [55,56]. Myogenic differentiation 1 MYOD1 is 7 Mb to the left of the peak on chro-mosome 11, and was reported to have frequent hypermethylation in intestinal metaplasia tissue (Barrett’s esophagus) [57]. The oncogene MYC [58] is close to our chromosome 8 admixture mapping region and, because the location of genetic variants for BE/EAC in our study could be inaccurately estimated due to the small sample size, this is another candidate gene for further fine mapping study. The admixture mapping regions on the two chromosomes are large, with more than 200 genes in the chromosome 8 region and more than 300 genes in the chromosome 11 region, making it is hard to locate the susceptibility genes in this kind of study. Moreover, the susceptibility variants could be miRNAs, other non-coding RNAs, or regulatory elements in the regions. The identification of the susceptibility genes and variants will require a large-scale accrual of cases at multiple centers since AA EAC cases are rare.
The results of this study indicate the power of the admixture approach for racially disparate diseases such as BE and EAC. The case only admixture mapping study is a more efficient design for a rare disease such as EAC than case-control design [26] and, because it is based on compar-ing local ancestry with average local or global ancestry [27,59], it is robust against any popula-tion stratificapopula-tion difference between cases and controls. The rarity of BE and EAC limited our available sample size. Furthermore, the quality of the fragmented DNA extracted from archived FFPE blocks resulted in poor quality SNP calls for nearly half our available samples. Due to the limitations of the small sample size and the DNA quality, our admixture results could miss other regions and the case only admixture mapping could not accurately locate association variants. Despite these limitations, the admixture analysis was able to identify two regions of excess Euro-pean ancestry that appear to be associated with BE and EAC. It is especially noteworthy that poor sample quality, which would seriously affect association results, has less of a detrimental effect on admixture mapping (Figs1and2); this can be explained by the fact that in admixture mapping larger regions are studied, and within such regions positive and negative errors tend to cancel out. This, of course, comes at the expense of a less precise location of any causal variant.
In conclusion, our admixture mapping association study of BE and EAC identified chromo-some 8q22-24 and chromochromo-some 11p15 with excess European ancestry. This is the first admix-ture analysis to suggest a genetic basis for the racial disparity in the prevalence of BE and EAC. One possible mechanism to explain racial disparity in BE and EAC is that the normal squa-mous mucosa of esophagus in AA is less susceptible to refluxate damage, and subsequent development of metaplastic BE, than that of EA. This might be secondary to endogenous pro-tection from more active detoxifying enzymes, more extensive mucin production, or the increased expression of protective gene products in AA. A second possible mechanism is that Barrett’s epithelium is more likely to replace damaged squamous epithelium in EA than AA. Thus, admixed AA cases with BE may carry European alleles that more readily replace dam-aged squamous epithelium with metaplastic BE. Further sequencing of the two regions with a larger sample size will be conducted to locate genetic variants for esophageal adenocarcinoma and Barrett’s esophagus and identify the mechanisms that explain resistance to the develop-ment of BE in individuals of African ancestry.
Supporting information
S1 Fig. The genome-wide admixture mapping result for excess European ancestry signals from 54 individuals using all SNPs.
S2 Fig. The genome-wide admixture mapping result for excess European ancestry signals from 54 individuals using SNPs without the 908 SNPs having allele frequencies different from the 1000 genomes.
(TIF)
S3 Fig. The genome-wide admixture mapping result for excess European ancestry signals from the 28 individuals having high genotyping quality.
(TIF)
S4 Fig. The genome-wide admixture mapping result for excess African ancestry signals from 54 individuals using all SNPs.
(TIF)
S5 Fig. The genome-wide admixture mapping result for excess African ancestry signals from 54 individuals excluding the 908 SNPs having different allele frequency from the 1000 genomes.
(TIF)
S6 Fig. The genome-wide admixture mapping result for excess African ancestry signals from the 28 individuals having high genotyping quality.
(TIF)
S1 File. Estimating the association effect size of variants in the two admixture mapping regions.
(DOCX)
Author Contributions
Conceptualization: Sanford D. Markowitz, Robert Elston, Amitabh Chak.
Data curation: Xiangqing Sun, Apoorva K. Chandar, Marcia I. Canto, Prashanthi N. Thota, Malcom Brock, Nicholas J. Shaheen, David G. Beer, Jean S. Wang, Gary W. Falk, Prasad G. Iyer, Julian A. Abrams, Medha Venkat-Ramani, Amitabh Chak.
Formal analysis: Xiangqing Sun, Kishore Guda, Xiaofeng Zhu, Robert Elston, Amitabh Chak.
Funding acquisition: Amitabh Chak.
Investigation: Xiangqing Sun, Martina Veigl, Alexander Miron, Amitabh Chak.
Methodology: Xiangqing Sun, Martina Veigl, Alexander Miron, Joseph Willis, Deepa T. Patil, Kishore Guda, Sanford D. Markowitz, Xiaofeng Zhu, Amitabh Chak.
Project administration: Apoorva K. Chandar, Amitabh Chak.
Resources: Marcia I. Canto, Prashanthi N. Thota, Malcom Brock, Nicholas J. Shaheen, David G. Beer, Jean S. Wang, Gary W. Falk, Prasad G. Iyer, Julian A. Abrams, Joseph Willis, Deepa T. Patil, Ilke Nalbantoglu, Sanford D. Markowitz, Robert Elston, Amitabh Chak.
Software: Robert Elston.
Supervision: Robert Elston, Amitabh Chak.
Writing – original draft: Xiangqing Sun, Robert Elston, Amitabh Chak.
Nalbantoglu, Kishore Guda, Sanford D. Markowitz, Xiaofeng Zhu, Robert Elston, Amitabh Chak.
References
1. American Cancer Society. Cancer Facts & Figures 2017. Atlanta: American Cancer Society; 2017
2. Holmes R.S, Vaughan TL. Epidemiology and pathogenesis of esophageal cancer. Semin Radiat Oncol. 2007; 17: 2–9.https://doi.org/10.1016/j.semradonc.2006.09.003PMID:17185192
3. Pohl H, Welch HG. The role of overdiagnosis and reclassification in the marked increase of esophageal adenocarcinoma incidence. J Natl Cancer Inst. 2005; 97: 142–146.https://doi.org/10.1093/jnci/dji024 PMID:15657344
4. Brown LM, Devesa SS, Chow WH. Incidence of adenocarcinoma of the esophagus among white Ameri-cans by sex, stage, and age. J Natl Cancer Inst. 2008; 100:1184–1187.https://doi.org/10.1093/jnci/ djn211PMID:18695138
5. Chak A, Ochs-Balcom H, Falk G, Grady WM, Kinnard M, Willis JE, et al. Familiality in Barrett’s esopha-gus, adenocarcinoma of the esophaesopha-gus, and adenocarcinoma of the gastroesophageal junction. Can-cer Epidemiol Biomarkers Prev. 2006; 15: 1668–1673.https://doi.org/10.1158/1055-9965.EPI-06-0293 PMID:16985029
6. Altorki NK, Skinner DB. Adenocarcinoma in Barrett’s esophagus. Semin Surg Oncol. 1990; 6: 274–278. PMID:2237086
7. Cameron AJ, Lomboy CT. Barrett’s esophagus: age, prevalence, and extent of columnar epithelium. Gastroenterology. 1992; 103: 1241–1245. PMID:1397881
8. Falk GW. Barrett’s esophagus. Gastroenterology. 2002; 122: 1569–1591. PMID:12016424 9. Anderson LA, Watson RG, Murphy SJ, Johnston BT, Comber H, Mc Guigan J, et al. Risk factors
for Barrett’s oesophagus and oesophageal adenocarcinoma: results from the FINBAR study. World J Gastroenterol. 2007; 13: 1585–1594.https://doi.org/10.3748/wjg.v13.i10.1585PMID: 17461453
10. DeVault KR. Epidemiology and significance of Barrett’s esophagus. Dig Dis. 2000; 18: 195–202. PMID: 11356990
11. Edelstein ZR, Bronner MP, Rosen SN, Vaughan TL. Risk factors for Barrett’s esophagus among patients with gastroesophageal reflux disease: a community clinic-based case-control study. Am J Gas-troenterol. 2009; 104: 834–842.https://doi.org/10.1038/ajg.2009.137PMID:19319131
12. Falk GW. Risk factors for esophageal cancer development. Surg Oncol Clin N Am. 2009; 18: 469–485. https://doi.org/10.1016/j.soc.2009.03.005PMID:19500737
13. Cook MB, Chow WH, Devesa SS. Oesophageal cancer incidence in the United States by race, sex, and histologic type, 1977–2005. Br J Cancer. 2009; 101: 855–859.https://doi.org/10.1038/sj.bjc.6605246 PMID:19672254
14. Sharma P, Wani S, Romero Y, Johnson D, Hamilton F. Racial and geographic issues in gastroesopha-geal reflux disease. Am J Gastroenterol. 2008; 103: 2669–2680.https://doi.org/10.1111/j.1572-0241. 2008.02089.xPMID:19032462
15. Ogden CL, Carroll MD, Kit BK, Flegal KM. Prevalence of obesity among adults: United States, 2011– 2012. NCHS Data Brief. 2013: 1–8.
16. An R. Prevalence and Trends of Adult Obesity in the US, 1999–2012. ISRN Obes. 2014;2014: 185132.
17. 1000 Genomes Project Consortium, Auton A, Brooks LD, Durbin RM, Garrison EP, Kang HM, Korbel JO, et al. A global reference for human genetic variation. Nature. 2015; 526: 68–74.https://doi.org/10. 1038/nature15393PMID:26432245
18. Browning SR, Browning BL. Rapid and accurate haplotype phasing and missing data inference for whole genome association studies using localized haplotype clustering. Am J Hum Genet. 2007; 81: 1084–1097.https://doi.org/10.1086/521987PMID:17924348
19. Johnson NA, Coram MA, Shriver MD, Romieu I, Barsh GS, London SJ, et al. Ancestral components of admixed genomes in a Mexican cohort. PLoS Genet. 2011; 7: e1002410.https://doi.org/10.1371/ journal.pgen.1002410PMID:22194699
20. Lepage C, Drouillard A, Jouve JL, Faivre J. Epidemiology and risk factors for oesophageal adenocar-cinoma. Dig Liver Dis. 2013; 45: 625–629.https://doi.org/10.1016/j.dld.2012.12.020PMID:
23453359
22. Zhu X, Luke A, Cooper RS, Quertermous T, Hanis C, Mosley T, et al. Admixture mapping for hyperten-sion loci with genome-scan markers. Nat Genet. 2005; 37: 177–1781.https://doi.org/10.1038/ng1510 PMID:15665825
23. Galwey NW. A new measure of the effective number of tests, a practical tool for comparing families of non-independent significance tests. Genet Epidemiol. 2009; 33: 559–568.https://doi.org/10.1002/gepi. 20408PMID:19217024
24. Bryc K, Durand EY, Macpherson JM, Reich D, Mountain JL. The genetic ancestry of African Americans, Latinos, and European Americans across the United States. Am J Hum Genet. 2015; 96: 37–53.https:// doi.org/10.1016/j.ajhg.2014.11.010PMID:25529636
25. Zakharia F, Basu A, Absher D, Assimes TL, Go AS, Hlatky MA, et al. Characterizing the admixed Afri-can ancestry of AfriAfri-can AmeriAfri-cans. Genome Biol. 2009; 10: R141. https://doi.org/10.1186/gb-2009-10-12-r141PMID:20025784
26. Hoggart CJ, Shriver MD, Kittles RA, Clayton DG, McKeigue PM. Design and analysis of admixture map-ping studies. Am J Hum Genet. 2004; 74: 965–978.https://doi.org/10.1086/420855PMID:15088268 27. Shriner D. Overview of admixture mapping. Curr Protoc Hum Genet. 2013;Chapter 1: Unit 1.23.
28. Chakraborty R, Weiss KM. Admixture as a tool for finding linked genes and detecting that difference from allelic association between loci. Proc Natl Acad Sci U S A. 1988; 85: 9119–9123. PMID:3194414 29. Briscoe D, Stephens JC, O’Brien SJ. Linkage disequilibrium in admixed populations: applications in
gene mapping. J Hered. 1994; 85: 59–63. PMID:8120361
30. Zhu X, Tang H, Risch N. Admixture mapping and the role of population structure for localizing disease genes. Adv Genet. 2008; 60: 547–569.https://doi.org/10.1016/S0065-2660(07)00419-1PMID: 18358332
31. Montana G, Pritchard JK. Statistical tests for admixture mapping with case-control and cases-only data. Am J Hum Genet. 2004; 75: 771–789.https://doi.org/10.1086/425281PMID:15386213
32. Freedman ML, Haiman CA, Patterson N, McDonald GJ, Tandon A, Waliszewska A, et al. Admixture mapping identifies 8q24 as a prostate cancer risk locus in African-American men. Proc Natl Acad Sci U S A. 2006; 103: 14068–14073.https://doi.org/10.1073/pnas.0605832103PMID:16945910
33. Reich D, Patterson N, De Jager PL, McDonald GJ, Waliszewska A, Tandon A, et al. A whole-genome admixture scan finds a candidate locus for multiple sclerosis susceptibility. Nat Genet. 2005; 37: 1113– 1118.https://doi.org/10.1038/ng1646PMID:16186815
34. Kopp JB, Smith MW, Nelson GW, Johnson RC, Freedman BI, Bowden DW, et al. MYH9 is a major-effect risk gene for focal segmental glomerulosclerosis. Nat Genet. 2008; 40: 1175–1184.https://doi. org/10.1038/ng.226PMID:18794856
35. Elbein SC, Das SK, Hallman DM, Hanis CL, Hasstedt SJ. Genome-wide linkage and admixture map-ping of type 2 diabetes in African American families from the American Diabetes Association GENNID (Genetics of NIDDM) Study Cohort. Diabetes. 2009; 58: 268–274.https://doi.org/10.2337/db08-0931 PMID:18840782
36. Reich D, Patterson N, Ramesh V, De Jager PL, McDonald GJ, Tandon A, et al. Admixture mapping of an allele affecting interleukin 6 soluble receptor and interleukin 6 levels. Am J Hum Genet. 2007; 80: 716–726.https://doi.org/10.1086/513206PMID:17357077
37. Shetty PB, Tang H, Feng T, Tayo B, Morrison AC, Kardia SL, et al. Variants for HDL-C, LDL-C, and tri-glycerides identified from admixture mapping and fine-mapping analysis in African American families. Circ Cardiovasc Genet. 2015; 8: 106–113.https://doi.org/10.1161/CIRCGENETICS.114.000481PMID: 25552592
38. Shetty PB, Tang H, Tayo BO, Morrison AC, Hanis CL, Rao DC, et al. Variants in CXADR and F2RL1 are associated with blood pressure and obesity in African-Americans in regions identified through admixture mapping. J Hypertens. 2012; 30: 1970–1976.https://doi.org/10.1097/HJH.
0b013e3283578c80PMID:22914544
39. Sun X, Elston R, Falk GW, Grady WM, Faulx A, Mittal SK, et al. Linkage and related analyses of Bar-rett’s esophagus and its associated adenocarcinomas. Mol Genet Genomic Med. 2016. 4:407–419. https://doi.org/10.1002/mgg3.211PMID:27468417
40. Han Y, Rand KA, Hazelett DJ, Ingles SA, Kittles RA, Strom SS, et al. Prostate Cancer Susceptibility in Men of African Ancestry at 8q24. J Natl Cancer Inst. 2016; 108.
42. Brisbin AG, Asmann YW, Song H, Tsai YY, Aakre JA, Yang P, et al. Meta-analysis of 8q24 for seven cancers reveals a locus between NOV and ENPP2 associated with cancer development. BMC Med Genet. 2011; 12: 156.https://doi.org/10.1186/1471-2350-12-156PMID:22142333
43. Yeager M, Chatterjee N, Ciampa J, Jacobs KB, Gonzalez-Bosquet J, Hayes RB, et al. Identification of a new prostate cancer susceptibility locus on chromosome 8q24. Nat Genet. 2009; 41: 1055–1057. https://doi.org/10.1038/ng.444PMID:19767755
44. Pomerantz MM, Beckwith CA, Regan MM, Wyman SK, Petrovics G, Chen Y, et al. Evaluation of the 8q24 prostate cancer risk locus and MYC expression. Cancer Res. 2009; 69: 5568–5574.https://doi. org/10.1158/0008-5472.CAN-09-0387PMID:19549893
45. Penney KL, Salinas CA, Pomerantz M, Schumacher FR, Beckwith CA, Lee GS, et al. Evaluation of 8q24 and 17q risk loci and prostate cancer mortality. Clin Cancer Res. 2009; 15: 3223–3230.https://doi. org/10.1158/1078-0432.CCR-08-2733PMID:19366828
46. Schumacher FR, Feigelson HS, Cox DG, Haiman CA, Albanes D, Buring J, et al. A common 8q24 vari-ant in prostate and breast cancer from a large nested case-control study. Cancer Res. 2007; 67: 2951– 2956.https://doi.org/10.1158/0008-5472.CAN-06-3591PMID:17409400
47. Yeager M, Orr N, Hayes RB, Jacobs KB, Kraft P, Wacholder S, et al. Genome-wide association study of prostate cancer identifies a second risk locus at 8q24. Nat Genet. 2007; 39: 645–649.https://doi.org/10. 1038/ng2022PMID:17401363
48. Ahmadiyeh N, Pomerantz MM, Grisanzio C, Herman P, Jia L, Almendro V, et al. 8q24 prostate, breast, and colon cancer risk loci show tissue-specific long-range interaction with MYC. Proc Natl Acad Sci U S A. 2010; 107: 9742–9746.https://doi.org/10.1073/pnas.0910668107PMID:20453196
49. Tuupanen S, Turunen M, Lehtonen R, Hallikas O, Vanharanta S, Kivioja T, et al. The common colorec-tal cancer predisposition SNP rs6983267 at chromosome 8q24 confers potential to enhanced Wnt sig-naling. Nat Genet. 2009; 41: 885–890.https://doi.org/10.1038/ng.406PMID:19561604
50. Shi X, Wang X. The role of MTDH/AEG-1 in the progression of cancer. Int J Clin Exp Med. 2015; 8: 4795–4807. PMID:26131054
51. Yu C, Chen K, Zheng H, Guo X, Jia W, Li M, et al. Overexpression of astrocyte elevated gene-1 (AEG-1) is associated with esophageal squamous cell carcinoma (ESCC) progression and pathogenesis. Carcinogenesis. 2009; 30: 894–901.https://doi.org/10.1093/carcin/bgp064PMID:19304953 52. Oji Y, Yano M, Nakano Y, Abeno S, Nakatsuka S, Ikeba A, et al. Overexpression of the Wilms’ tumor
gene WT1 in esophageal cancer. Anticancer Res. 2004; 24: 3103–3108. PMID:15510596 53. Gashler AL, Bonthron DT, Madden SL, Rauscher FJ 3rd, Collins T, Sukhatme VP. Human platelet
derived growth factor A chain is transcriptionally repressed by the Wilms’ tumor suuppressor WT1. Proc Natl Acad Sci U S A. 1992; 89: 10984–10988. PMID:1332065
54. Werner H, Re GG, Drummond IA, Sukhatme VP, Rauscher FJ 3rd, Sens DA, et al. Increased expres-sion of the insulin-like growth factor I receptor gene, IGFIR, in Wilms’ tumor is correlated with modula-tion of IGFIR promoter activity by the WT1 Wilms’ tumor gene product. Proc Natl Acad Sci U S A. 1993; 90: 5828–5832. PMID:8390684
55. Goodyer P, Dehbi M, Torban E, Bruening W, Pelletier J. Repression of the retinoic acid receptor-alpha gene by the Wilms’ tumor suppressor gene product, WT1. Oncogene. 1995; 10: 1125–1129. PMID: 7700638
56. Hewitt SM, Hamada S, McDonnell TJ, Rauscher FJ 3rd, Saunders GF. Regulation of the proto-onco-genes bcl-2 and c-myc by the Wilms’ tumor suppressor gene WT1. Cancer Res. 1995; 55: 5386–5389. PMID:7585606
57. Eads CA, Lord RV, Wickramasinghe K, Long TI, Kurumboor SK, Bernstein L, et al. Epigenetic patterns in the progression of esophageal adenocarcinoma. Cancer Res. 2001; 61: 3410–3418. PMID: 11309301
58. Sotelo J, Esposito D, Duhagon MA, Banfield K, Mehalko J, Liao H, et al. Long-range enhancers on 8q24 regulate c-Myc. Proc Natl Acad Sci U S A. 2010; 107: 3001–3005.https://doi.org/10.1073/pnas. 0906067107PMID:20133699