Absorption of DCM Dye in Ethanol: Experimental and
Time Dependent Density Functional Study
Seyed Hassan Nabavia,*, Mohammad Hassan Khodabandehb, Maryam Golbabaeeb
, and Ahmad Moshaiia a Department of Physics, University of Tarbiat Modares, Tehran, Iran
a Department of Chemistry, University of Shahid Beheshti, Tehran, Iran
ABSTRACT— Experimental and theoretical absorption spectra of [2-[2-[4-(dimethylamino) phenyl]ethenyl]-6-methyl-4H- pyran-4-ylidene]-propanedinitrile (DCM) have been studied. UV-Visible (UV-Vis.) absorption spectrum of DCM has been reported after its synthesis. Two relatively intense peaks appeared at 473 and 362 nm respectively. A theoretical investigation on the electronic structure of DCM is presented in an effort to rationalize our experimental results. Theoretical results have been obtained with a polarizable continuum model time-dependent density functional theory (PCM-TD-DFT) approach. At first, a vast functional benchmark has been performed to determine a suitable approach for determination of electronic structure and UV-Vis. absorption spectrum of DCM. In a second step, we evaluated the impact of the atomic basis set on the electronic transition energies using a large panel of Pople’s basis sets ,up to the 6-31+G(3df,2p) and also a correlation consistent basis set, cc-pVTZ. It turns out that the selected basis set has a relatively finite influence on the calculated electronic transition energies as well as the topology of the absorption shape, but both are significantly affected by the chosen functional. In the present case, no single functional simultaneously provides highly accurate positions and intensities of the different bands, but mPW1PBE and mPW1LYP appear to be a good compromise. The mPW1PBE along with medium basis sets produced both absorption bands with maximum peaks about 463 and 346 nm. At all stages, ethanol has been chosen as a solvent environment. To improve the accuracy of first electronic excitation, a complete analysis of the origin of the band shape using TD-DFT vibrational couplings was performed. Finally the computed transition energy was corrected to
472 nm which was in excellent agreement with experiments.
KEYWORDS: TD-DFT, DCM dye, Absorption
spectra, Vibrational coupling.
I.
I
NTRODUCTIONThere has been a great deal of research on
DCM ([2-[2-[4-(dimethylamino) phenyl]ethenyl]-6-methyl-4H-
pyran-4-ylidene]-propanedinitrile), for its advantage of widely tunable, efficient laser dye [1]–[4] and capability to use as an active element in luminescent solar concentrators [5], [6]. The photophysical properties, such as the absorption and emission spectra provide a direct way for studying the details of electronic nature on the primary photoprocesses that are operative in a fluorescent dye. DCM has also been used as a guest in polyimide hosts for electro-optic devices [7]. The presence of an electron-donating group (e. the dimethyl amino) at 4-position in phenyl ring decreases HOMO-LUMO gap and increases the fluorescence quantum yield which has led it to its vast applications in dye lasers. Hence, the photophysics and photochemistry investigations of this dye have been studied intensively [6], [8]–[11]. Also nowadays, DCM and its analogs are considered in color graphical displays [12], inorganic light diodes [13], and as a fluorescent probe in biological systems [14].
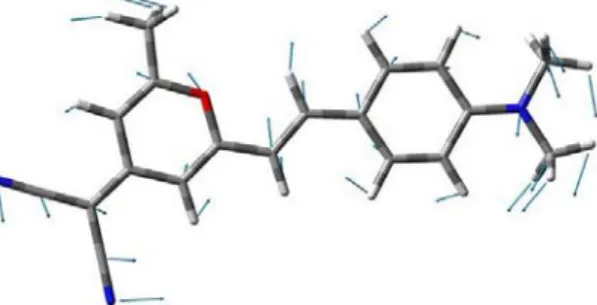
DCM is an example of a donor-π -bridge-acceptor molecule (Fig. 1). It consists of an *Corresponding author: [email protected]
Received: May. 24, 2015, Revised: Aug. 10, 2015, Accepted: Dec. 15, 2015, Available Online: Oct. 28, 2017
S.H. Nabavi et al. Absorption of DCM dye in Ethanol: Experimental and Time…
electron-donating dimethylamino group and an electron-accepting dicyano group, separated by a conjugated bridge (Fig. 1) [15]. The bridge is composed of two aromatic rings and alternating single and double bonds that extend all the way from the donor to the acceptor. Conjugation gives rise to a π molecular orbital that extends from the donor to the acceptor by overlapping of the p-orbitals from the constituent carbon atoms or from lone pairs. The amino nitrogen in the donor group of DCM is expected to have orbitals that are between pure sp3 and sp2 hybrid orbitals. This is due to resonance structures that involve delocalization of the one pair to the aromatic ring [16]. Cis and Trans isomers of DCM have been identified in solutions via measurement of the absolute absorption cross sections by J. M. Darke et al. [17]. The effect of the solvent polarity on the absorption spectra has been reported by Meyer et al. [9]. The evolution of DCM during electronic excitation has been investigated in both theoretical and experimental field by numerous authors [8], [18]–[26].
Fig. 1. [2-[2-[4-(dimethylamino)phenyl]ethenyl]-6-methyl-4H-pyran-4-ylidene]- propanedinitrile (DCM). α, β and γ are the three rotors (dihedral angles) was used to investigate for potential energy curves (PECs) on ground (S0) and first excited (S1)
states. This picture has been depicted by gaussview 05 software.
In this article, we synthesized DCM and showed different absorption spectra in solvent environment (ethanol) in the UV-Vis. region. Two relatively intense peaks appeared at 473 and 362 nm respectively. As far as we know, there is not any theoretical investigation about effect of different DFT methods on accurate
spectra of DCM accurately. In order to obtain this aim, one needs to include electron correlation. In practice, this can be done with TDDFT. An advantage of TD-DFT, compared to more refined electron correlated wave function theories, is the possibility to include bulk solvation effects during excited-state force minimizations, through the use of dielectric approximations, typically the polarizable continuum model (PCM) [27], [28]. The basis sets and functionals effects for simulation of DCM spectra are investigated. Among the examined functional/ basis levels, mPW1PBE simultaneously provides accurate positions and intensities of the different bands. To improve the accuracy of simulations, we have to evaluate the vibronic couplings. Vibrational modes that hook up with the electronic transition are not clear in shape of experimental spectra but change the final position of maximum peaks in spectra. To perform such task, one needs to calculate the Hessian of both the ground state and relevant (generally first) singlet excited state. In practice, this can be done with DFT and TDDFT for ground and excited states respectively. The first TDDFT derivatives (gradients) allows to minimize the excited-state geometries since the seminal work of Van Caillie and Amos [29] and the subsequent extensions has been improved [27], [30], [31]. Therefore computed transition energies corrected to 472 nm by considering the vibrational transition during first electronic excitation. This paper is organized as follows: In Sections 2.1 and 2.2, our experimental and computational protocols are described. In Sections 3.1 and 3.2, the functionals and basis set effects for DCM absorption spectra are investigated. Section 3.3 gives the computed vertical spectra with vibrational couplings of DCM and eventually, we conclude.
II.
S
YNTHESIZEM
ETHODA. Experiment
The chemicals for synthesizing of DCM dye were obtained from Merck and Aldrich and used without further purification. Melting
point was analyzed with an electro thermal melting point apparatus. The hydrogen NMR (nuclear magnetic resonance) spectrum was obtained on FT-NMR (Fourier transform-NMR-500MHz) Brucker spectrometer and the chemical shifts are expressed in δ ppm using tetra methyl silane (TMS) as an internal standard.
For synthesis of 4- dicyano methylene- 2,6- dimethyl-4H- pyran (DCM intermediate), a mixture of malonitirile (1 mmol), 2,6-dimethyl-4H-pyran-4-one (1 mmol) and acetic anhydride (0.5 ml) was refluxed for 1.5 h. The unreacted acetic acid was aspirated off and the residue was washed with 50 ml. of boiling water and collected to give soft brown material. Recrystallization from boiling heptane produced a brown powder. After that, for synthesis of 4-(Dicyanomethylene)-2-methyl-6-(4-dimethylaminostyryl)-4H-pyran (DCM), the mixture of (1.06 g) (6.16 mmole)
synthesized 4-dicyanomethylene-2,6- dimethyl-4H- pyran, (0.76 g) (5.048 mmol)
(N,N-Dimethyl) benzaldehyde, (87 ml) toluene, 60 drops of piperidine and 90 drops of acetic acid was added. The mixture was refluxed (120◦ C) under argon gas for 20 h.
Afterwards the precipitated dye was filtered. The product was purified by column chromatography using n-hexane- ethyl acetate (6:1) as eluent. Fig. 2 show the schematic for preparing the DCM dye. Hydrogen NMR spectrum of final product (DCM) is available in supporting information.
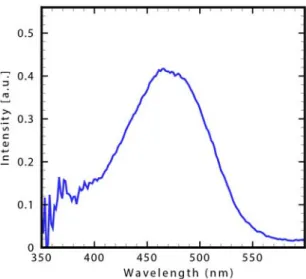
UV-Vis. spectra of DCM diluted in ethanol has been taken by a spectrometer (Avantes Avaspec-2048) supplied with a white light source with 200-1200 nm wavelength range (Avantes Avalight-Hall). The concentration of synthesized DCM dissolved in ethanol was 10 -5 M/lit and the diluted DCM hold in a 1×1×5 cm3 quartz cuvette for measuring its absorption spectrum in ambient temperature. The Figure 3 shows the experimental absorption spectra. As can be seen, the room temperature absorption spectrum of DCM exhibit two main bands in polar solvent (ethanol).
Fig. 2. Experimental UV-Vis. absorption spectrum of solvated DCM at room temperature.
Fig. 3. DCM synthesis protocol
A low energy band spanned in the 450-520 nm region and second band that is less intense spanned in higher energy 340 -380 nm. Maximum peak in each one aforementioned bands appear in 473 and 362 nm respectively (Fig. 3).
B. Computational Details
All calculations have been performed with the Gaussian09 [32] program suite, using default thresholds and algorithms except when it has noted. We have selected a large set of atomic (ABS) and DFT functionals: B3LYP [33]– [35], X3LYP [36], O3LYP [37], BLYP [34]– [38], MPW1PBE [39], [40], MPW3PBE [39], [40], MPW1LYP [34]–[38], [41], [42] , M06-2X [42], B97-2 [42], wB97XD [43] and
S.H. Nabavi et al. Absorption of DCM dye in Ethanol: Experimental and Time…
B3LYP [44] to perform benchmarks for DCM. We have used the popular Pople’s ABS [45], [46] in this paper. Triple zeta correlation consistent ABS (cc-pVTZ) [47] has been used as well. All Pople’s ABS used in this work are split valence basis sets of contracted gaussian type functions (CGTFs) with different diffuse and polarization functions. The cc-pVTZ is a developed CGTF which designed by Dunning and co-workers for use in calculation methods (such as CI and DFT) that include electron correlation [47]. The ground-state, S0 (and first excited-state, S1) geometries have been optimized with DFT (TD-DFT) until the residual mean square forces were smaller than
4
10
3
(au). The vibrational frequencies have been computed analytically for the S0 (S1) state. They confirmed the presence of minima characterized by the absence of imaginary modes (and transition states characterized by a single imaginary mode). During all calculation steps, we have included bulk solvent effects by using the PCM [28] that correctly models the major solvent effects as long as no specific solute-solvent interactions are implied. In PCM model, the solvent is indicated by a homogeneous dielectric polarized by the solute, located within a cavity constructed as an envelope of spheres centered on solute atoms. We have selected ethanol as a polar solvent. Vibrationally resolved spectra within the harmonic approximation were computed using the FC classes program [48]–[50]. The reported spectra have been simulated at 298.15 (K) using a convoluting gaussian functions presenting a full width at half maximum (FWHM) of 0.33 (eV) for vertical excitation without vibrational corrections. FWHM for simulating of vibronic spectra was adjusted in accordance with the experimental information (about 0.33 (eV)) and fine structure of vibronic transitions (135 and 1 (cm−1)). A maximum quantum number that has to be considered for each vibrational mode (overtone) involved in the combination bands were 20 and 13 respectively. A maximum number of integrals to be computed for each class were set to 108
for comparable discussions. Experimental and all computational spectra are reported as normalized absorption line shapes.
III.
R
ESULTS ANDD
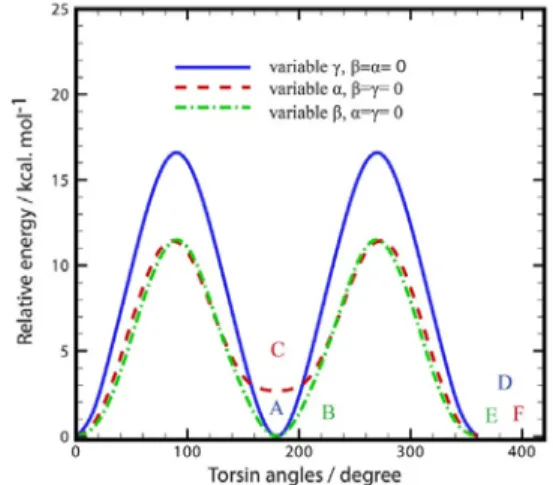
ISCUSSIONGiven the planarity of the aromatic rings and ylidene and the symmetry of the methyl groups, the streochemical configuration of DCM is significantly specified by the α, β and
γ dihedral angles, which refer to the torsion around of two C-C and one C-N bonds respectively (Fig. 1). Ground state potential energy curves (PECs) has been obtained by variation of each torsion angle separately and calculation of electronic energies (Fig. 4). As can be seen in Fig. 5, the points A, B, D, E and F have same structure and energy. So there are two different minima in PEC, A and C that are correspond to cis (α≈0◦) and trans (α ≈ 180◦)
isomers respectively and β=γ=0 as well.
Fig. 4. Ground state potential energy curves (PECs) that has been obtained by variation of each torsion angle and electronic energy calculations, separately. All calculations have been performed at PCM-B3LYP/6-31G(d) level. Relative energy unit is (kcal.mol−1) and angle unit is degree. A, B, D, E
and F isomers have been labeled cis and C isomer has been labeled trans.
Frequency calculations on optimized cis and
trans structure proved that these are in
minimum energy. Relative computed thermodynamic parameters and electric dipole moments are shown in Table 1.
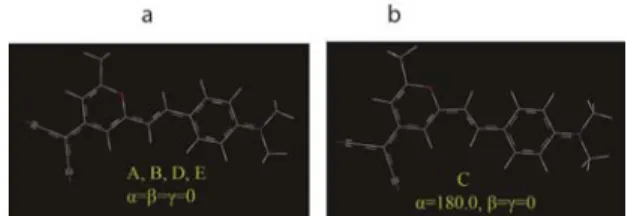
Fig. 5. (a), cis isomer and (b), trans isomer. Geometry minimizations have been performed at PCM-B3LYP/6-31G(d) level.
An energetic comparison of two minima indicates that, in the polar solvent, cis isomer is most favored conformer on the ground electronic state. Thus, at the following sections we focused on electronic structure and photochemical properties of this minimum.
Table 1. Computed thermodynamic parameters and dipole moments μ obtained at B3LYP/6-31G(d)// B3LYP/6-31G(d) level for cis and trans. All energetic parameters reported in (kcal.mol−1) unit.
Dipole moment’s unit is Debye. Angle’s unit is degree. Ee and E0 are electronic energy difference without and with considering the zero-point vibrational energy respectively. E298,
298 H
and G298 are electronic energy, enthalpy and Gibbs free energy differences at room temperature.
Isomer Cis Trans
0.0 180
0.0 0.0
0.0 0.0
e E
0.0 2.9
0
E
0.0 2.5
298
E
0.0 1.6
298
H
0.0 1.6
298
G
0.0 3.8
21.6 20.4
The electronic structure of most favored DCM conformer during computation of excitations at PCM-TD-B3LYP/6-31G(d) level is considered before examination of different functionals and basis sets. Computed spectrum has been shown in Fig. 6. By comparing computed spectrum with experimental spectrum (Fig. 3) it is seen that the two aforementioned maximum peaks are resulted from singlet HOMO→LUMO and HOMO-1
→LUMO in combination with HOMO→
LUMO+1 electronic transition (Fig. 6).
Fig. 6. (a) Canonical Orbitals which is included in first two singlet electronic excitation processes. (b), Computed absorption spectrum of solvated DCM resulted from vertical excitation computation without vibrational couplings. Schematic diagram depicts each of transition processes. All computation have been performed at PCM-TD-B3LYP/6-31G(d) level.
Fig. 7. Localized natural bond orbitals: a) Nature of HOMO is c N amino b) Nature of LUMO is c c* .
As can be seen in Fig. 6, nature of desired orbitals is π and π∗. Natural bond orbital analysis shows that the HOMO and LUMO have c N aminobonding and c c* antibonding
nature (Fig. 7). It means that intermolecular charge transfer occurs during first electronic excitation. This phenomenon has been proposed for photo-excitation of D--conjugated bridge-A systems by many research groups [19], [51]–[60]. Computed spectra shape and their intense peaks at B3LYP/6-31G(d) level has relatively good agreement with one obtained by experiment (Fig. 6). For instance, maximum peaks in low energy band appeared in 483 nm in comparison with 473 nm in experiment. In following sections effect of other functionals and basis sets for reproduce of UV-Vis. spectrum of DCM have been reported.
S.H. Nabavi et al. Absorption of DCM dye in Ethanol: Experimental and Time…
A. Functional Investigation
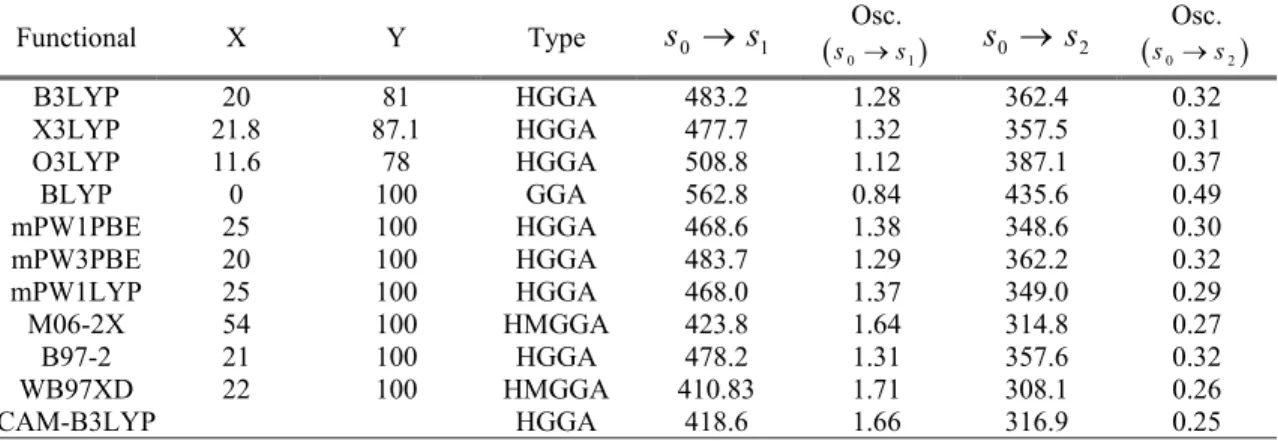
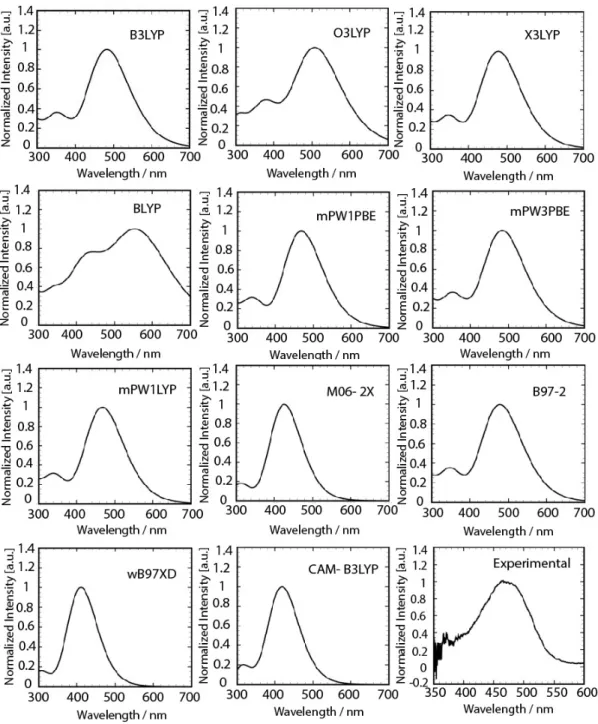
The obtained results for 11 functionals are summarized in Table 2. Obviously, the selected functional impacts significantly on the computed S0 S1 and S0 S2 transition energies, that tend to increase when more exact exchange is plugged in an expected trend for π-π* transitions [31], [61]–[63]. As seen in the Table 2, generally in hybrid functionals, with the increase in exact exchange functional ratio (X), a blue shift occurs in electronic transition. For example when X in X3LYP increase about 5% compared with B3LYP, both electronic transition S0→ S1 and S0→ S2 have shown the blue shift but electronic excitation resulted from O3LYP functional that has smaller exact exchange contribution than B3LYP has shown a red shift. Shape of the calculated spectra arising from the use of all 11 functionals by medium size Pople basis 6-31G(d) has been shown in Fig. 8.
Also computed transition energies from B3LYP, X3LYP, mPW3PBE and B97-2 are in agreement with experiment but with slightly underestimation. Although previous studies [64]–[66] about the global hybrids such as PBE0 and B3LYP, have been found efficient within the vertical time dependent DFT approximation for some of dyes but in DCM case the mPW1PBE and mPW1LYP are more
efficient. Estimated transition energies by other functionals have large deviation from experimental results. For example computed first electronic transition energies at BLYP, O3LYP and WB97XD levels are in 563, 509 and 411 nm, respectively.
B. Basis Set Investigation
The results of the ABS investigation can be found in Table 3 whereas depicted topologies of corresponding spectra placed in Fig. 9. In this examination, a PCM-mPW1PBE method on B3LYP optimized structure has been used. The efficiency of mPW1PBE to discussion of electronic transition in DCM was proved in previous section. One of the vast investigations aiming at assessing the influence of the size of the some Pople basis on the TD-DFT calculation and topology of the vibronic band has been done by Jacquemin [64] and Grimme [63] on the other dyes. At the present work almost all selected basis give similar outcomes analogous to [64]. Range of variation of low energy vertical transition wavelengths (S0→S1) from compact basis 6-31G to sizable basis 6-31+G(3df,2p) and cc-pVTZ is about 13 nm. As shown in Table 3, effect of diffuse basis function (+) in variation of electronic transition energies is larger than polarization functions (p, d and f basis functions).
Table 2. Computed two lower singlet-singlet excitations of solvated cis-DCM by using different functionals. All results obtained at PCM-TDDFT/6-31G(d) level of theory on PCM-B3LYP/6-31G(d) optimized structure. X and Y
are exact exchange and correlation contributions. Osc. is oscillator strength of electronic transition between to states. Transition energy unit reported in nm.
Functional X Y Type s0 s1
Osc.
s0s1 s0 s2
Osc. s0s2
B3LYP 20 81 HGGA 483.2 1.28 362.4 0.32
X3LYP 21.8 87.1 HGGA 477.7 1.32 357.5 0.31
O3LYP 11.6 78 HGGA 508.8 1.12 387.1 0.37
BLYP 0 100 GGA 562.8 0.84 435.6 0.49
mPW1PBE 25 100 HGGA 468.6 1.38 348.6 0.30
mPW3PBE 20 100 HGGA 483.7 1.29 362.2 0.32
mPW1LYP 25 100 HGGA 468.0 1.37 349.0 0.29
M06-2X 54 100 HMGGA 423.8 1.64 314.8 0.27
B97-2 21 100 HGGA 478.2 1.31 357.6 0.32
WB97XD 22 100 HMGGA 410.83 1.71 308.1 0.26
CAM-B3LYP HGGA 418.6 1.66 316.9 0.25
Fig. 8. Calculated absorption spectra for solvated DCM using different functionals and the same basis set along with experimental spectra.
Table 3. Computed two lower singlet-singlet excitation energy of solvated DCM by different basis sets. All results obtained at PCM-TD-mPW1PBE/basis level
Basis set s0 s1(nm) Osc. s0s2 s0s2(nm) Osc.s0s2 6-31G 470.3 1.37 345.9 0.35
6-31G(d) 468.6 1.38 348.6 0.30
6-31+G(d) 480.1 1.37 351.0 0.35
6-31++G(d) 481.0 1.37 351.0 0.35
6-31+G(2d,2p) 481.7 1.37 352.2 0.34
6-31+G(3df,2p) 481.6 1.38 353.2 0.33
cc-pVTZ 476.7 1.38 352.2 0.31
International Journal of Optics and Photonics (IJOP) Vol. 12, No. 1, Winter-Spring, 2018
Resulted shapes of spectra by using different basis sets are very similar to each other and experiments (Fig. 9). By comparison of transition intensities which obtained using different basis sets with experimental absorption, it revealed that 6-31G(d) basis set reproduced experimental absorption spectra of DCM and is better than others. As can be seen in Table 3, range of change in computation of high transition energy band (S0 → S2) is about 6.3 nm.
Apart from the first two compact basis sets in Table 3, other chosen basis sets slightly underestimated the transition energy of low energy peak in comparison with experimental absorption. As a compromise between cost and accuracy computations, 6-31G(d) is appropriate. This basis set defines d
polarization functions on all atoms except for hydrogen atoms. This basis satisfies both correct shape of spectra and transition energies.Computation of Vertical Spectra with Vibrational Couplings
To improve the accuracy of simulations, the vibronic couplings should be evaluated. Vibrational modes that hook up with the electronic transition are not clear in shape of experimental spectra but may change the final position of maximum peaks in spectra. To the best of our knowledge, there are no previous experimental or theoretical investigations aiming at assessing the influence of the vibrational coupling on position of maximum peaks and shape of spectra for DCM dye. We are going to correct the computed first transition energy by including the vibrational couplings along with electronic transitions. To perform such task, one needs to calculate the Hessian of both the ground state and relevant (generally first) singlet excited state. In practice, this can be done with DFT and TDDFT for ground and excited states respectively. For a reliable calculation, geometry in both ground and excited states were optimized at PCM-mPW1PBE/6-31G(d) and PCM-TD-mPW1PBE/6-31G(d) approach, respectively. The harmonic frequencies of both
levels. It should be noted that, vertical excitation without including the vibrational couplings, using latter structure appears in 463 nm.
In the interaction of visible light with solvated DCM, it was found a significant elongation of the C-C bond in the ring containing oxygen upon electron excitation. As a consequence, the vibrational frequency of normal mode corresponding to stretch of this bond are obviously displaced to lower frequency (from 1601 (cm−1) in ground state structure to 1547 (cm−1) in excited state structure). Also elongation of bond length was appeared at nitrile bonds, C=N, upon excitation but not noticeably. Finally vibronic absorption spectra of solvated DCM was simulated (Fig. 10) using computed Hessian matrix of minimum structures in initial state, S0 and final state, S1 and FC classes code [32], [58], [59]. Fine structures of vibronic spectra were computed although this fine structure is not obvious in the experimental spectrum.
Fig. 9. Computed absorption spectra of solvated DCM using different basis sets and mPW1PBE functional.
To simulating the spectrum line-shape, it is required to convolute the stick-spectrum with a gaussian distribution function with an adequate full-width at the half-maximum (FWHM). Figure 10 shows absorption spectra with different FWHM (FWHM: 1,135 and
is appealing that the shape of convoluted spectrum with FWHM equal to 2685 (cm-1)is comparable with experimental one. As can be seen in convoluted spectrum with FWHM equal to 1 (cm-1) the most intense vibronic transition is 0-0 transition in accordance to Frank-Condon rule (i.e. most intense transition occurs from lowest vibrational level, 0, in S0 electronic state to lowest vibrational level,
0
, in S1 electronic state). The separation between the first and second most intense peaks (in black stick spectrum in Figure 10, FWHM=1 (cm-1)) is equal to 101 (cm−1). It can mainly ascribe to third vibration overtone of mode 3 in excited electronic state. Vibrational mode 3 is corresponding to the in planar bending of DCM plane (Fig. 11). Present study predicts the vibronic shape of absorption spectrum for first singlet-singlet electronic transition of DCM in ethanol at 298 (K). Also this is an important result that the computed transition energy was corrected to 472 nm by considering the vibrational couplings during first electronic excitation.
Fig. 10. Computed absorption spectrum of solvated DCM by including the vibrational couplings during electronic excitation. Different full width at half maximum (FWHM) have been chosen in convoluting gaussian (red, green and blue stick line).
Fig. 11. Vibrational mode 3 at first singlet electronic excited state structure of solvated DCM.
This mode has been calculated at PCM-TD-mPW1PBE/6-31G(d).
IV.
C
ONCLUSIONThe absorption spectra of synthesized DCM dye has obtained using an experimental spectroscopy and a time-dependent density functional theory approach. The room temperature absorption spectrum of DCM exhibit two main bands in polar solvent (ethanol). A low energy band spanned in the 450-520 nm regions and second band with less intensity spanned in higher energy 340 -380 nm. Maximum peak in each aforementioned bands appear in 473 and 362 nm respectively. A theoretical investigation on the electronic structure of DCM is presented in an effort to rationalize our experimental results. It turned out that the selected DFT functional strongly affects the computed transition wavelengths as well as the topology of the absorption spectra. In the present case, mPW1PBE and mPW1LYP provide accurate positions (wavelengths) and intensities for the absorption peaks. These functionals are efficient to determine the shapes of the absorption bands. We evaluated the impact of the atomic basis set on the electronic transition energies using a large panel of Pople’s basis sets ,up to the 6-31+G(3df,2p) and also a correlation consistent basis set, cc-pVTZ. On the contrary to functionals, the selected atomic basis set has a relatively modest impact on the photoproperties of DCM. As a compromise between cost and accuracy computations, 6-31G(d) basis set is appropriate for considering the photophysical and photochemical properties of DCM. Thus it was suggested that the mPW1PBE/6-31G(d) gives best results for DCM. This level with low overestimation in computation of transition energy produced both main low and high energy bands with maximum peaks about 463 and 346 nm, respectively. To improve the accuracy of first electronic excitation, vibrational couplings were computed during first electronic transition. It was shown that the most intense vibronic transition is 0-0 transition. Finally the computed transition energy alter from 463 to
S.H. Nabavi et al. Absorption of DCM dye in Ethanol: Experimental and Time…
472 nm which was in excellent agreement with experiments.
V.
A
CKNOWLEDGMENTS.H. Nabavi thanks Davood Danaei for helpful support during the writing of the article.
R
EFERENCES[1] P.R. Hammond, “Laser dye DCM, its spectral
properties, synthesis and comparison with other dyes in the red,” Opt. Commun. vol. 29, no. 3, pp. 331–333, 1979.
[2] E.G. Marason, “Laser dye DCM: CW,
synchronously pumped, cavity pumped and single-frequency performance,” Opt. Commun. vol. 37, no. 1, pp. 56–58, 1981.
[3] J.C. Mialocq and M. Meyer, “Photophysical
properties of the DCM and DFSBO styryl dyes consequence for their laser properties,” Laser Chem. vol. 10, no. 5–6, pp. 277–296, 1990.
[4] S.Z.Y.C.M. Meili, W.P.W.T.W. Gongjun, and
Q. Minjun, “Tunable properties of a new efficient laser dye DCM,” Chinese J. Lasers, vol. 10, pp. 1-5, 1981.
[5] J.S. Batchelder, A.H. Zewail, and T. Cole,
“Luminescent solar concentrators. 2: Experimental and theoretical analysis of their possible efficiencies,” Appl. Opt. vol. 20, no. 21, pp. 3733–3754, 1981.
[6] J. Sansregret, J.M. Drake, W.R.L. Thomas,
and M.L. Lesiecki, “Light transport in planar luminescent solar concentrators: the role of DCM self-absorption,” Appl. Opt. vol. 22, no. 4, pp. 573–577, 1983.
[7] S.P. Ermer, J.F. Valley, R.S. Lytel, G.F.
Lipscomb, T.E. Van Eck, D.G. Girton, D.S. Leung, and S. M. Lovejoy, “DCM-polyimide system for triple-stack poled polymer electro-optic devices,” in OE/LASE’93: Optics, Electro-Optics, & Laser Applications in Science and Engineering, Vol. 61, pp. 183– 192,1993.
[8] M. Meyer and J.C. Mialocq, “Ground state
and singlet excited state of laser dye DCM: dipole moments and solvent induced spectral shifts,” Opt. Commun. vol. 64, no. 3, pp. 264– 268, 1987.
and trans-cis isomerization of the DCM styrene dye: picosecond and nanosecond laser spectroscopy, high-performance liquid chromatography, and nuclear magnetic resonance studies,” J. Phys. Chem. vol. 94, no. 1, pp. 98–104, 1990.
[10] M. Lesiecki, F. Asmar, J.M. Drake, and D.M.
Camaioni, “Photoproperties of DCM,” J. Lumin. vol. 31, pp. 546–548, 1984.
[11] J.M. Drake, M.L. Lesiecki, J. Sansregret, and
W.R.L. Thomas, “Organic dyes in PMMA in a planar luminescent solar collector: a performance evaluation,” Appl. Opt. vol. 21, no. 16, pp. 2945–2952, 1982.
[12] L.S. Hung and C.H. Chen, “Recent progress
of molecular organic electroluminescent materials and devices,” Mater. Sci. Eng. Reports, vol. 39, no. 5, pp. 143–222, 2002.
[13] Z.Y. Xie, L.S. Hung, and S.T. Lee,
“High-efficiency red electroluminescence from a narrow recombination zone confined by an organic double heterostructure,” Appl. Phys. Lett. vol. 79, no. 7, pp. 1048–1050, 2001.
[14] S.K. Pal, D. Mandal, D. Sukul, S. Sen, and K.
Bhattacharyya, “Solvation dynamics of DCM in human serum albumin,” J. Phys. Chem. B, vol. 105, no. 7, pp. 1438–1441, 2001.
[15] W. Mccolgin and F. Webster, “Arylidene dye
lasers.” Google Patents, 03-Dec-1974.
[16] J. McMurry, Organic chemistry. 5th, Ed. RR
Donnelly Sons Willard, Ohio, 2000.
[17]J.M. Drake, M.L. Lesiecki, and D.M.
Camaioni, “Photophysics and cis-trans isomerization of DCM,” Chem. Phys. Lett. vol. 113, no. 6, pp. 530–534, 1985.
[18]M. Meyer, J.C. Mialocq, and M. Rougee,
“Fluorescence lifetime measurements of the two isomers of the laser dye DCM,” Chem. Phys. Lett. vol. 150, no. 5, pp. 484–490, 1988.
[19]S. Marguet, J.-C. Mialocq, P. Millié, G.
Berthier, and F. Momicchioli, “Intramolecular charge transfer and trans-cis isomerization of the DCM styrene dye in polar solvents. A CS INDO MRCI study,” Chem. Phys. vol. 160, no. 2, pp. 265–279, 1992.
[20] J.C. Mialocq, X. Armand, and S. Marguet, “A
new sensitive chemical actinometer for time-resolved and continuous photochemistry: the
[21]M.M. Martin, P. Plaza, and Y.H. Meyer,
“Ultrafast intramolecular charge transfer in the merocyanine dye DCM,” Chem. Phys. vol. 192, no. 3, pp. 367–377, 1995.
[22] T. Gustavsson, G. Baldacchino, J.-C. Mialocq,
and S. Pommeret, “A femtosecond fluorescence up-conversion study of the dynamic Stokes shift of the DCM dye molecule in polar and non-polar solvents,” Chem. Phys. Lett. vol. 236, no. 6, pp. 587– 594, 1995.
[23] S. Pommeret, T. Gustavsson, R. Naskrecki, G.
Baldacchino, and J.C. Mialocq, “Femtosecond absorption and emission spectroscopy of the DCM laser dye,” J. Mol. Liq. vol. 64, no. 1, pp. 101–112, 1995.
[24] H. Zhang, A.M. Jonkman, P. Van der Meulen,
and M. Glasbeek, “Femtosecond studies of charge separation in phot-excited DCM in liquid solution,” Chem. Phys. Lett. vol. 224, no. 5, pp. 551–556, 1994.
[25]A.J. Van Tassle, M.A. Prantil, and G.R.
Fleming, “Investigation of the excited state structure of DCM via ultrafast electronic pump/vibrational probe,” J. Phys. Chem. B, vol. 110, no. 38, pp. 18989–18995, 2006.
[26]I.D. Petsalakis, D.G. Georgiadou, M.
Vasilopoulou, G. Pistolis, D. Dimotikali, P. Argitis, and G. Theodorakopoulos, “Theoretical Investigation on the Effect of Protonation on the Absorption and Emission Spectra of Two Amine-Group-Bearing, Red ‘Push− Pull’ Emitters, 4-Dimethylamino-4′ -nitrostilbene and 4-(dicyanomethylene)-2-methyl-6-p-(dimethylamino) styryl-4H-pyran, by,” J. Phys. Chem. A, vol. 114, no. 17, pp. 5580–5587, 2010.
[27] G. Scalmani, M.J. Frisch, B. Mennucci, J.
Tomasi, R. Cammi, and V. Barone, “Geometries and properties of excited states in the gas phase and in solution: Theory and application of a time-dependent density functional theory polarizable continuum model,” J. Chem. Phys. vol. 124, no. 9, pp. 094107 (1-15), 2006.
[28]J. Tomasi, B. Mennucci, and R. Cammi,
“Quantum mechanical continuum solvation models,” Chem. Rev. vol. 105, no. 8, pp. 2999–3094, 2005.
[29] C. Van Caillie and R.D. Amos, “Geometric
derivatives of excitation energies using SCF
and DFT,” Chem. Phys. Lett. vol. 308, no. 3, pp. 249–255, 1999.
[30] F. Furche and R. Ahlrichs, “Adiabatic
time-dependent density functional methods for excited state properties,” J. Chem. Phys. vol. 117, no. 16, pp. 7433–7447, 2002.
[31] M. Dierksen and S. Grimme, “The vibronic
structure of electronic absorption spectra of large molecules: a time-dependent density functional study on the influence of ‘exact’ Hartree-Fock exchange,” J. Phys. Chem. A, vol. 108, no. 46, pp. 10225–10237, 2004.
[32]A. Frisch, Gaussian 09: User’s Reference.
Gaussian, 2009.
[33]A.D. Becke, “Density‐functional
thermochemistry. III. The role of exact exchange,” J. Chem. Phys. vol. 98, no. 7, pp. 5648–5652, 1993.
[34]C. Lee, W. Yang, and R.G. Parr,
“Development of the Colle-Salvetti correlation-energy formula into a functional of the electron density,” Phys. Rev. B, vol. 37, no. 2, pp. 785-789, 1988.
[35] P.J. Stephens, F.J. Devlin, C.F. Chabalowski,
and M.J. Frisch, “Ab initio calculation of vibrational absorption and circular dichroism spectra using density functional force fields,” J. Phys. Chem. vol. 98, no. 45, pp. 11623– 11627, 1994.
[36]X. Xu and W.A. Goddard, “The X3LYP
extended density functional for accurate descriptions of nonbond interactions, spin states, and thermochemical properties,” Proc. Natl. Acad. Sci. U. S. A. vol. 101, no. 9, pp. 2673–2677, 2004.
[37]J. Baker and P. Pulay, “Assessment of the
Handy–Cohen optimized exchange density functional for organic reactions,” J. Chem. Phys. vol. 117, no. 4, pp. 1441–1449, 2002.
[38]A.D. Becke, “Density-functional
exchange-energy approximation with correct asymptotic behavior,” Phys. Rev. A, vol. 38, no. 6, pp. 3098-3100, 1988.
[39]C. Adamo and V. Barone, “Exchange
functionals with improved long-range behavior and adiabatic connection methods without adjustable parameters: The mPW and mPW1PW models,” J. Chem. Phys. vol. 108, no. 2, pp. 664–675, 1998.
S.H. Nabavi et al. Absorption of DCM dye in Ethanol: Experimental and Time…
[40] J.P. Perdew, K. Burke, and M. Ernzerhof,
“Generalized gradient approximation made simple,” Phys. Rev. Lett. vol. 77, no. 18, pp. 3865-3868, 1996.
[41]W.J. Hehre, L. Radom, P.V.R. Schleyer, and
J.A. Pople, AB Initio Molecular Orbital Theory, John Wiley & Sons, 1986.
[42] Y. Zhao and D.G. Truhlar, “Comparative DFT
study of van der Waals complexes: rare-gas dimers, alkaline-earth dimers, zinc dimer, and zinc-rare-gas dimers,” J. Phys. Chem. A, vol. 110, no. 15, pp. 5121–5129, 2006.
[43] J.-D. Chai and M. Head-Gordon, “Long-range
corrected hybrid density functionals with damped atom–atom dispersion corrections,” Phys. Chem. Chem. Phys. vol. 10, no. 44, pp. 6615–6620, 2008.
[44] Y. Tawada, T. Tsuneda, S. Yanagisawa, T.
Yanai, and K. Hirao, “A long-range-corrected time-dependent density functional theory,” J. Chem. Phys. vol. 120, no. 18, pp. 8425–8433, 2004.
[45] P.C. Hariharan and J.A. Pople, “The influence
of polarization functions on molecular orbital hydrogenation energies,” Theor. Chim. Acta, vol. 28, no. 3, pp. 213–222, 1973.
[46] T. Clark, J. Chandrasekhar, G. W. Spitznagel,
and P. V. R. Schleyer, “Efficient diffuse function‐augmented basis sets for anion calculations. III. The 3‐21+ G basis set for first‐row elements, Li–F,” J. Comput. Chem. vol. 4, no. 3, pp. 294–301, 1983.
[47]A.K. Wilson, T. van Mourik, and T.H.
Dunning, “Gaussian basis sets for use in correlated molecular calculations. VI. Sextuple zeta correlation consistent basis sets for boron through neon,” J. Mol. Struct. Theochem. vol. 388, pp. 339–349, 1996.
[48] F. Santoro, A. Lami, R. Improta, J. Bloino,
and V. Barone, “Effective method for the computation of optical spectra of large molecules at finite temperature including the Duschinsky and Herzberg–Teller effect: The Qx band of porphyrin as a case study,” J. Chem. Phys. vol. 128, no. 22, pp. 224311 (1-17), 2008.
[49] F. Santoro, R. Improta, A. Lami, J. Bloino,
and V. Barone, “Effective method to compute Franck-Condon integrals for optical spectra of
[50]F. Santoro, A. Lami, R. Improta, and V.
Barone, “Effective method to compute vibrationally resolved optical spectra of large molecules at finite temperature in the gas phase and in solution,” J. Chem. Phys. vol. 126, no. 18, pp. 184102 (1-11), 2007.
[51] J. Dreyer and A. Kummrow, “Shedding light
on excited-state structures by theoretical analysis of femtosecond transient infrared spectra: intramolecular charge transfer in 4-(dimethylamino) benzonitrile,” J. Am. Chem. Soc. vol. 122, no. 11, pp. 2577–2585, 2000.
[52]K. Dahl, R. Biswas, N. Ito, and M.
Maroncelli, “Solvent dependence of the spectra and kinetics of excited-state charge transfer in three (alkylamino) benzonitriles,” J. Phys. Chem. B, vol. 109, no. 4, pp. 1563– 1585, 2005.
[53] E. Abraham, J. Oberlé, G. Jonusauskas, R.
Lapouyade, and C. Rulliere, “Photophysics of 4-dimethylamino 4′-cyanostilbene and model compounds: dual excited states revealed by sub-picosecond transient absorption and Kerr ellipsometry,” Chem. Phys. vol. 214, no. 2, pp. 409–423, 1997.
[54] E. Gilabert, R. Lapouyade, and C. Rullière,
“Time-resolved dual fluorescence of push— pull stilbenes at high solute concentration and excitation intensity: evidence for an emitting bicimer,” Chem. Phys. Lett. vol. 185, no. 1, pp. 82–87, 1991.
[55] M. Hashimoto and H. Hamaguchi, “Structure
of the twisted-intramolecular-charge-transfer excited singlet and triplet states of 4-(dimethylamino) benzonitrile as studied by nanosecond time-resolved infrared spectroscopy,” J. Phys. Chem. vol. 99, no. 20, pp. 7875–7877, 1995.
[56]W.M. Kwok, C. Ma, P. Matousek, A.W.
Parker, D. Phillips, W.T. Toner, M. Towrie, and S. Umapathy, “A determination of the structure of the intramolecular charge transfer state of 4-dimethylaminobenzonitrile (DMABN) by time-resolved resonance Raman spectroscopy,” J. Phys. Chem. A, vol. 105, no. 6, pp. 984–990, 2001.
[57] R. Lapouyade, A. Kuhn, J.F. Letard, and W.
Rettig, “Multiple relaxation pathways in photoexcited dimethylaminonitro-and dimethylaminocyano-stilbenes,” Chem. Phys.
[58]W. Rettig and W. Majenz, “Competing
adiabatic photoreaction channels in stilbene derivatives,” Chem. Phys. Lett. vol. 154, no. 4, pp. 335–341, 1989.
[59] J.-M. Viallet, F. Dupuy, R. Lapouyade, and C.
Rullière, “Multiple luminescence from ‘push-pull’diphenyl polyenes revealed by picosecond spectroscopy. Evidence for TICT and bicimer states,” Chem. Phys. Lett. vol. 222, no. 6, pp. 571–578, 1994.
[60] J. Oberlé, E. Abraham, G. Jonusauskas, and C.
Rulliere, “Study of the intramolecular charge‐transfer (ICT) process in
4‐dimethylamino‐4′‐nitrostilbene by
picosecond time‐resolved CARS,” J. Raman Spectros. vol. 31, no. 4, pp. 311–317, 2000.
[61] D. Jacquemin, V. Wathelet, E.A. Perpete, and
C. Adamo, “Extensive TD-DFT benchmark: singlet-excited states of organic molecules,” J. Chem. Theory Comput. vol. 5, no. 9, pp. 2420–2435, 2009.
[62]M.R. Silva-Junior, M. Schreiber, S.P.A.
Sauer, and W. Thiel, “Benchmarks for electronically excited states: Time-dependent density functional theory and density functional theory based multireference configuration interaction,” J. Chem. Phys. vol. 129, no. 10, pp. 104103 (1-15), 2008.
[63] L. Goerigk and S. Grimme, “Assessment of
TD-DFT methods and of various spin scaled CIS (D) and CC2 versions for the treatment of low-lying valence excitations of large organic dyes,” J. Chem. Phys. vol. 132, no. 18, pp. 184103 (1-9), 2010.
[64] D. Jacquemin, E. Brémond, A. Planchat, I.
Ciofini, and C. Adamo, “TD-DFT vibronic couplings in anthraquinones: from basis set and functional benchmarks to applications for industrial dyes,” J. Chem. Theory Comput. vol. 7, no. 6, pp. 1882–1892, 2011.
[65] D. Jacquemin, J.-M. André, and E.A. Perpète,
“Geometry, dipole moment, polarizability and first hyperpolarizability of polymethineimine: An assessment of electron correlation contributions,” J. Chem. Phys. vol. 121, no. 9, pp. 4389–4396, 2004.
[66]E.A. Perpète, V. Wathelet, J. Preat, C.
Lambert, and D. Jacquemin, “Toward a theoretical quantitative estimation of the λmax of anthraquinones-based dyes,” J. Chem.
Theory Comput. vol. 2, no. 2, pp. 434–440, 2006.
Seyed Hassan Nabavi received the B.Sc. degree in atomic and molecular physics from Tehran University, Tehran, Iran, in 1998, the M.Sc. degree in laser spectroscopy in Tehran University, in 2002. Currently he is a Ph.D. student in Tarbiat Modares University and works on plasmonic effects on laser gain and molecule-nanoparticle interactions in theory and experiment. His research fields are laser oscillator and amplifier and their applications, light matter interaction and plasmonic.
Mohammad Hassan Khodabandeh received the B.Sc, M.Sc, and Ph.D. degrees from Shahid Beheshti University, Tehran, Iran in 2006, 2009, and 2015, respectively. His major research area includes physical chemistry, computational chemistry and molecular spectroscopy.
Maryam Golbabaee received the B.Sc. degree in practical chemistry from K.N. Toosi University of Technology, Tehran, Iran, in 2005, the M.Sc. degree in organic chemistry
S.H. Nabavi et al. Absorption of DCM dye in Ethanol: Experimental and Time…
from Shahid Beheshti University, Tehran, Iran in 2007. Her main field of research includes synthesis of organic compounds, nanoparticles and encapsulation of polymeric shell around nanoparticles .
Dr. Ahmad Moshaii, Associate Professor, received his PhD degree from Physics
Department of Sharif University of Technology, Tehran, Iran, in 2004 in the field of sonoluminescence. Then he worked at IPM as a Postdoc researcher with concentration on Resistive Plate Chamber detectors. Dr. Moshaii joined Tarbiat Modares University in 2008 and established a nanooptics Lab. in Physics Department. Currently, his research interest concentrates on plasmonic materials for solar harvesting systems including solar cells and photoelectrochemical water splitting cells.
![Fig. 1. [2-[2-[4-(dimethylamino)phenyl]ethenyl]-6- [2-[2-[4-(dimethylamino)phenyl]ethenyl]-6-methyl-4H-pyran-4-ylidene]- propanedinitrile (DCM)](https://thumb-us.123doks.com/thumbv2/123dok_us/8369121.2222736/2.918.104.421.609.773/dimethylamino-phenyl-ethenyl-dimethylamino-phenyl-ethenyl-ylidene-propanedinitrile.webp)