Do Neighborhood Dynamics Influence Heat Vulnerability in
Chicago? Lessons from the 1995 Chicago Heat Wave
By
Estefany Noria
A paper submitted to the faculty of The University of North Carolina at Chapel Hill
in partial fulfillment of the requirements for the degree Master of City and Regional Planning
June 16, 2017
This paper represents work done by a UNC-Chapel Hill Master of City and Regional Planning student.
It is not a formal report of the Department of City and Regional Planning, nor is it the work of the department’s faculty.
Approved by:
ADVISOR READER (optional)
6/16/2017
DATE DATE
Do Neighborhood Dynamics Influence
Heat Vulnerability in Chicago?
Lessons from the 1995 Chicago Heat Wave
Table of Contents
INTRODUCTION 3
REVIEW OF HEAT VULNERABILITY LITERATURE 5
HEAT-RELATED HEALTH RISKS 5
INDIVIDUAL FACTORS 5
PLACE-BASED FACTORS 6
METHODOLOGY 8
DATA SOURCES 8
DATA TRANSFORMATION 9
GEOCODING ADDRESSES FROM MORTALITY DATA 9 JOINING GEOGRAPHIC BOUNDARIES SHAPEFILE AND TYPOLOGY DATA 9 COUNTING NUMBER OF DEATHS PER CENSUS TRACT 10
PERFORMING REGRESSION ANALYSES 10
ANALYSIS OF MORTALITY RISK WITH DNT NEIGHBORHOOD TYPOLOGY 11
SPATIAL VISUALIZATION 11
GRAPHICAL VISUALIZATIONS 11
STATISTICAL REGRESSIONS 14
INDIVIDUAL NEIGHBORHOOD TYPES 14
LOW VS.HIGH-TIER NEIGHBORHOOD TYPES 15
LOW-TIER NEIGHBORHOOD TYPES 16
DISCUSSION OF MORTALITY RISK ANALYSIS 18
RELATIONSHIP BETWEEN NEIGHBORHOOD TYPE AND HEAT VULNERABILITY 18
TRADEOFFS BETWEEN HEAT RISK REDUCTION AND DISPLACEMENT 18
POLICY RECOMMENDATIONS 20
CONCLUSION 23
REFERENCES 24
APPENDIX 26
APPENDIX 1: METHODOLOGY OF HEAT VULNERABILITY INDEX 26
APPENDIX 2: PROFILES OF DNT NEIGHBORHOOD TYPES 27
APPENDIX 3: HEAT MAP OF THE DNT NEIGHBORHOOD TYPOLOGY STRUCTURE 34 APPENDIX 4: STATA OUTPUTS – REGRESSIONS OF INDIVIDUAL NEIGHBORHOOD TYPES 35 APPENDIX 5: STATA OUTPUTS – REGRESSIONS OF LOW AND HIGH-TIER GROUPS 38
APPENDIX 6: STATA OUTPUTS – REGRESSIONS OF LOW-TIER GROUP 39
APPENDIX 7: STATA OUTPUTS – REGRESSIONS OF NEIGHBORHOOD CHANGE TRADEOFFS 41
Introduction
The 1995 Chicago Heat Wave was an extraordinarily deadly summer event that claimed the lives of more than 700 Chicagoans over a one-week period in July. Although unprecedented weather conditions, including persistent high
temperatures and humidity, combined to produce the Chicago Heat Wave,
examination of mortalities demonstrates the event was a socially organized disaster. Victims were often found to be poor, elderly, and living alone. Neighborhoods with the highest mortality rates tended to have a high proportion of elderly residents and high levels of poverty and violent crime. The geography of heat wave mortality largely mirrored the geography of concentrated poverty and disinvestment in Chicago. Clearly, individual and place-based factors were acting to increase the risk of heat-related death. Mortality data from the Chicago Heat Wave provides an opportunity to examine the degree to which DNT Neighborhood Typology, a composite measure of neighborhood-level factors, serves as an appropriate indicator of heat vulnerability.
The relationship between neighborhood type and heat vulnerability in the context of the 1995 Chicago Heat Wave was prominently asserted by sociologist Eric Klinenberg in his 2002 book, “Heat Wave: A Social Autopsy of Disaster in Chicago.” In addition to presenting evidence supporting the causality of individual risk factors, Klinenberg identified additional place-based factors that appeared to increase the risk of mortality during the heat wave event. These include high rates of violent crime, limited access to everyday resources, and a dearth of social and commercial attractions. Klinenberg posited that these neighborhood-level characteristics converged to produce isolation and reclusiveness, and that this neighborhood dynamic could ultimately explain the differences in mortality observed between neighborhoods with similar proportions of vulnerable residents (Klinenberg 2002). In examining the suitability of neighborhood typology as a predictor of heat
vulnerability, this paper aims to use this measure to capture the neighborhood dynamics described by Klinenberg, and ultimately produce findings that affirm or negate his hypothesis.
Establishing a link between neighborhood typology and heat vulnerability will have several implications for emergency management and hazard mitigation planning within the City of Chicago. DNT Neighborhood Typology can provide an “actionable” data-based reference for policymakers during multi-phase emergency planning for heat wave events. This would be an improvement over existing heat vulnerability indices, whose interpretations are limited primarily to comparative purposes (Reid 2009). By intuitively communicating neighborhood dynamics to policymakers, neighborhood typologies can facilitate the preparation of
This paper first summarizes literature regarding heat vulnerability, including demonstrated and theorized individual and place-based factors. A description of the methodology used to conduct an analysis of mortality attributed to the 1995
Chicago Heat Wave is given. The analysis itself follows and is comprised of spatial, graphical, and statistical components. A discussion regarding the relationship
between neighborhood type and heat wave vulnerability summarizes and interprets outcomes from the mortality analysis. Findings from the analysis are then used to inform policy recommendations to improve the performance of emergency
Review of Heat Vulnerability Literature
Heat-Related Health Risks
Prolonged exposure to extreme heat results in heat stress, which may lead to death if the exposure is severe enough (Luber 2006). Accordingly, days with higher-than-average temperatures and periods of extended high temperatures have been demonstrated to increase heat-related mortality (Chestnut 1998). However, not all populations face the same health risks during heat events. A range of individual and place-based factors have been shown to affect the likelihood of heat-related illness and/or death.
Individual Factors
Several socioeconomic characteristics are likely to increase an individual’s risk of heat-related health consequences. These include a person’s age, income, education, and race. To begin with, the elderly have demonstrated higher mortality and hospital admission rates during heat waves (Stafoggia 2006; Knowlton 2009). Poverty has been shown to modify the effects of heat. During a 1999 heat wave in Chicago, a modest increase in the risk of heat-related death was observed for those making less than $10,000 (Naughton 2002). A study conducted in Seoul, Korea also found low-income people had higher mortality rates during hot weather (Kim and Joh 2006). Low educational attainment has also been shown to affect risks of heat-related deaths. Studies of U.S. cities found individuals with at most a high school education experienced heat-related deaths at a rate higher than those with more years of education (Medina-Ramon 2006). Lastly, non-white populations were found to be at greater risk of heat-related death. A 2001 study from the Center for Disease Control (CDC) found that blacks had a higher age-adjusted heat-related death rate than whites throughout the U.S. from 1979 to 1998 (CDC 2001).
Individual risk factors unique to heat events have also been identified. These concern a person’s health, use of air conditioning, and living arrangements. Several preexisting health conditions, including cardiovascular disease and diabetes, may lead to susceptibility to heat-related illness and death (Naughton 2002; Schwartz 2005). Meanwhile, air conditioning can serve as strong protection against heat-related deaths. Both room and central air conditioning are negatively corheat-related with heat-related mortality (Chestnut 1998). Lastly, living alone was found modify the risks of heat-related death. A study of the 1999 Chicago heat wave found that people who lived alone had a higher risk of death compared with people with more social contacts (Naughton 2002).
The contributions of the aforementioned individual factors to heat
heat-(See Appendix 1 for a description of the methodology underlying the Heat
Vulnerability Index). These included the proportion of the population (1) aged 65 or older, (2) living in poverty, (3) with less than a high school diploma, (4)
self-identified as non-white, (5) diagnosed with diabetes, (6) without central air
conditioning, (7) without any kind of air conditioning, (8) living alone, and (9) aged 65 or older and living alone. Of the ten variables considered for the Heat
Vulnerability Index, only one, the proportion of land area without vegetation, was not an individual risk factor, but rather a place-based factor (Reid 2009).
Previous analyses of mortality data from the 1995 Chicago Heat Wave confirmed several of the individual factors generally identified in heat vulnerability literature served as appropriate indicators of heat-related mortality for this specific heat wave event. This includes the proportion of the population: (1) aged 65 or older, (2) living in poverty, (3) self-identifying as African-American, (4) without air conditioning, (5) living alone, and (6) aged 65 or older and living alone. Mortality demographics demonstrated that the elderly and African-Americans faced a significantly higher likelihood of death during the 1995 Chicago Heat Wave. Seventy-three percent of heat-related casualties were found to be people 65 years or older. African-Americans had the highest proportional death rates of any ethnic and/or racial group, and in fact the mortality rate for African-Americans was 50% higher than whites (Klinenberg 2002). An association between high poverty rates and high mortality rates was also observed. Seven of the 15 neighborhoods with the greatest number of heat-related deaths had poverty rates that placed them in the top quintile of Chicago’s poorest communities (Klinenberg 2002). Furthermore, an epidemiological investigation of the 1995 Chicago Heat Wave conducted by the U.S. CDC found a lack of air conditioning and living alone to be two of several individual factors that increased the likelihood of death during the heat wave crisis
(Klinenberg 2002). Lastly, an additional association between a high proportion of elderly persons living alone and high mortality rates was observed. Four of the 15 community areas with the greatest number of heat-related deaths were in top 20% of communities with regards to percentage of persons aged 65 or older and living alone (Klinenberg 2002).
Place-Based Factors
higher rates of heat distress calls and mortality (Uejio 2011). Poor housing
conditions have also been shown to amplify the risk of heat-related health impacts. A study of heat-related mortality in New York City found that areas with higher rates of poor quality housing, as indicated by code violations and property tax delinquencies, were associated with higher mortality rates (Rosenthal 2014).
The influence of place-based factors on heat vulnerability in the U.S. appears to be less recognized than that of individual factors. As noted before, only one of the ten variables considered for the Heat Vulnerability Index was a place-based factor. This variable, the proportion of land area without vegetation, was chosen to
represent the demonstrated effects of land cover composition on heat-related health consequences (Reid 2009). However, the significance of two place-based factors on heat-related mortality has been confirmed for the 1995 Chicago Heat Wave event. A study of mortality data from the event affirmed two variables related to land cover served as appropriate indicators of heat-related mortality. The normalized
difference vegetation index (NDVI), a measure of vegetation abundance, and normalized difference built-up index (NDBI), a measure of the abundance of components indicative of the built environment, accounted for about 12% of the variance in vulnerability throughout the city (Johnson 2012).
In “Heat Wave: A Social Autopsy of Disaster in Chicago”, Klinenberg contends that additional place-based factors may have increased the risk of mortality during the 1995 heat event in Chicago. These include rates of violent crime at the
neighborhood-level and a “lack of access to everyday resources.” He described the latter as the dearth of “social and commercial attractions that draw people
outdoors”, such as animated public spaces, and providers of food and medicine. As Klinenberg explains, violent neighborhood crime “pushes” older residents to remain at home, while lack of access to everyday resources fails to provide a great enough “pull” for them to venture outside of their residences. These two forces work in tandem to produce isolation (limited social ties) and reclusiveness (confinement to the household), which make older residents less likely to receive or be able to reach aid during a heat wave event (Klinenberg 2002). Klinenberg provides some
evidence that neighborhood crime may have increased the risk of mortality during the 1995 Chicago Heat Wave. Seven of the 15 community areas with the highest mortality rates had violent crime rates that placed them in the top 20% of community areas in Chicago ranked according to their violent crimes rates
(Klinenberg 2002). However, evidence that links “access to everyday resources” and heat wave mortality is harder to find, mostly due to the fact that there is no clear definition for lack of access to everyday resources. Simple indicators of access to everyday resources could include the number of neighborhood commercial business within a given radius or a Walk Score, which measures the walkability of addresses by considering walking distances to a range of amenities (Walk Score 2016).
Methodology
Data Sources
Analysis of the relationship between neighborhood type and heat wave mortality used spatial and qualitative data from three sources:
US Census TIGER/Line Shapefile (2000)
Geographic boundary files for census tracts in Cook County, IL were downloaded from the U.S. Census web interface for TIGER/Line Shapefiles.
DNT Neighborhood Typology (2000)
Neighborhood typology data for Chicago census tracts was sourced from the Dynamic Neighborhood Taxonomy (DNT) project, which was completed in 2009 under the leadership of Living Cities and RW Ventures. DNT Neighborhood Typology uses hybrid hierarchical clustering to group neighborhoods from four major cities—Chicago, Cleveland, Dallas, and Seattle—into nine broad types and 33 detailed sub-types (Weissbourd, Bodini, and He 2009). Figure 1 provides a synopsis of the primary layer of the DNT typology, which consists of nine broad
neighborhood types ordered according to their median income. Profiles of the nine broad neighborhood types, which include high-level descriptions and details on factors that characterize each neighborhood type, are available in Appendix 2.
Source: Dynamic Neighborhoods: New Tools for Community and Economic Development (page 117)
Figure 1: Overview of DNT Neighborhood Typology
The DNT Neighborhood Typology was constructed following a detailed analysis of patterns and drivers of neighborhood change during a 15-year period from 1990 to 2005. The project considered over 2,500 variables for more than 2,000 census tracts, and eventually identified 23 different variables as key determinants of neighborhood type (Weissbourd, Bodini, and He 2009). See Appendix 3 for a heat map illustrating DNT neighborhood types according to the 23 selected indicators.
The DNT Neighborhood Typology was designed to inform economic
neighborhood change, and facilitating impact analysis through the identification of comparable neighborhoods (Weissbourd, Bodini, and He 2009). These applications suggest the DNT typology may provide a similarly useful “actionable” data set for emergency managers and land use planners who seek to prepare for and mitigate against the effects of heat events.
Mortality Data from the 1995 Chicago Heat Wave
Data on deaths attributed to the 1995 Chicago Heat Wave was sourced from the “Heat Wave: An Oral History” webpage. A text file was extracted from the source code for a series of maps illustrating the distribution of victims through the City of Chicago. The text file compiled information provided by the Cook County Medical Examiner’s Office on more than 600 people identified as victims of the 1995 Heat Wave. This included characteristics on individuals such as their name, gender, race, age, date of death, street address, and the latitude and longitude coordinates of their street address (Thomas 2015). The validity of this data was confirmed by cross-referencing summed counts of individual heat wave victims with neighborhood-level mortality data presented in Heat Wave (Klinenberg 200).
Data Transformation
Geocoding Addresses from Mortality Data
The original text file of mortality data associated with the 1995 Heat Wave provided the street addresses, and corresponding geographic coordinates, of 624 deceased individuals. These residential locations were assumed to be their places of death. In order to spatially locate address data for use in ArcGIS, the text file was converted into an Excel file and geocoded using ArcGIS Online services. Geocoding transformed the given location descriptions, in this case street addresses, into a point shapefile compatible with ArcGIS. The addresses of all 624 individuals were successfully geocoded.
Joining Geographic Boundaries Shapefile and Typology Data
DNT Neighborhood Typology data for the City of Chicago was made available in an Excel file, which assigned one of nine broad neighborhood typologies to 850 census tracts located within the city. The polygon TIGER/Line shapefile for Cook County, IL provided the geographic boundaries of 1,344 census tracts in accordance with the 2000 U.S. Census. ArcMap was used to join the TIGER/Line shapefile and DNT typology data file according to a common attribute field—geographic
identifiers for census tracts. Census tracts that did not have an assigned
Counting Number of Deaths Per Census Tract
ArcMap was used to create a “Count” field in the attribute table of the shapefile of geocoded addresses. A join was performed between the polygon TIGER/LINE shapefile (with associated DNT typologies) and the point shapefile of addresses. The resulting polygon shapefile contained a “Sum_Count” field that indicated the number of point features (heat wave victims) located within each polygon feature (census tract). Point data that located heat wave victims outside of the 850 census tracts with assigned typology were eliminated. Thus, this analysis only considered the 538 victims who were found within the 850 census tracts in Chicago with assigned DNT typologies. The resulting output file, which included the DNT typology and number of victims assigned to each census tract, was exported as CSV file.
Performing Regression Analyses
The exported master file was opened in Excel, which was used to create a series of dummy variables for an array of regression analysis scenarios that were performed using STATA. The regression analyses performed are described in detail in the analysis section of this paper. Complete STATA outputs for those regressions can be found in Appendices 4-7.
Analysis of Mortality Risk with DNT Neighborhood Typology
Spatial Visualization
Figure 2 provides an overview of the distribution of heat wave-related deaths within census tracts in Chicago with identified neighborhood typologies. Upon initial observation, Figure 2 indicates a general relationship between
mortality during the 1995 Chicago Heat Wave and neighborhood types in Chicago. A subsection of neighborhood types, specifically census tracts classified as Type 6 or greater, appear to experience zero or relatively few heat wave-related deaths.
Graphical Visualizations
As demonstrated in Figure 3, more detailed analyses of the distribution of heat wave victims provide several illuminating points. First, the distribution of victims per census tracts is extremely asymmetrical, and in fact is skewed to the right. Of the 850 census tracts in Chicago considered, a majority of them
experienced zero heat wave mortalities. Specifically, 507 census tracts
(approximately 60%) did not have any heat wave deaths attributed to them. Of the 343 census tracts that did contain mortalities, approximately 61% of them
experienced one death and 28% of them experienced two deaths. The remaining 11% experienced between three and six deaths. No single census tract experienced seven or more heat wave-related deaths.
Additionally, detailed profiles of census tracts by the degree of mortality experienced provides evidence to indicate a relationship between neighborhood typology and mortality. To begin with, Type 9 census tracts never experienced more than one heat wave-related death. Furthermore, the proportion of census tracts Type 6 or greater decreases as the mortality per census tract increases. This trend validates the observation that census tracts classified as Type 6 or greater may experience fewer heat wave-related deaths from Figure 2. Statistical analyses are needed to determine the validity of this observation, and perhaps reveal minute trends not visible in Figures 2 and 3.
Sources: DNT Neighborhood Typology (2000), Heat Wave: An Oral History (2015), U.S. Census TIGER/Line Shapefile (2000)
Sources: DNT Neighborhood Typology (2000), Heat Wave: An Oral History (2015), U.S. Census TIGER/Line Shapefile (2000)
Statistical Regressions
Individual Neighborhood Types
STATA regression analyses were conducted to determine the degree to which individual neighborhood types function as predictors of heat wave mortality. Dummy variables were generated for each neighborhood type. Individual
regressions were run for each neighborhood type, with their respective dummy variables serving as the independent variable and the number of deaths serving as the dependent variable. See Appendix 4 for complete STATA outputs of regression analyses for individual neighborhood types.
Figure 4 summarizes the results of regression analyses conducted for individual neighborhood types. Six of nine neighborhood types were found to be significant predictors of heat wave mortality. Type 1, Type 2, Type 4, and Type 8 classifications were found to be significant at the 0.05 level. Meanwhile, Type 3 and Type 9 classifications were found to be significant at the 0.10 level. Furthermore, the coefficients for dummy variables representing neighborhood types indicate there is some validity to the previous observation that higher neighborhood types are associated with relatively lower rates of mortality. As Figure 4 demonstrates, a majority of coefficients for Types 1 – 4 are positive, while all of the coefficients for Types 5-9 are negative.
In having a negative coefficient, Type 1 neighborhoods deviate from the general trend of positive coefficients demonstrated among low-tier neighborhood types (Types 1-4). This deviation may be due to the fact that a small number of census tracts (32), are classified as Type 1. Meanwhile, Types 2-4 have at least 100 census tracts that are classified as each neighborhood type. The relatively small sample size for Type 1 neighborhoods may have made the neighborhood type more susceptible to extreme outliers not representative of most Type 1 neighborhoods.
* Significant at the 0.05 level ** Significant at the 0.10 level
Figure 4: Summary of Regression Analyses - Individual Neighborhood Types
Neighborhood
Type Constant Coefficient p-value
1 0.647 -0.365 0.032 *
2 0.595 0.309 0.002 *
3 0.605 0.135 0.090 **
4 0.592 0.285 0.002 *
5 0.655 -0.123 0.145
6 0.637 -0.415 0.190
7 0.657 -0.136 0.111
8 0.664 -0.293 0.006 *
Because of the way that dummy variables for each neighborhood type were defined, a positive coefficient indicates that the group of census tracts classified as the neighborhood type of interest are associated with a higher number of deaths than the group of census tracts classified as other neighborhood types. Conversely, a negative coefficient indicates that the group of census tracts classified as the
neighborhood type of interest are associated with a lower number of deaths than the group of census tracts classified as other neighborhood types.
For example, the regression analysis conducted for Type 1 can be interpreted as follows:
Because 𝑇𝑦𝑝𝑒 1 is a dummy binary variable, it has the following values:
𝑇𝑦𝑝𝑒 1 = 0: Census tract is not classified as Type 1 𝑇𝑦𝑝𝑒 1 = 1: Census tract is classified as Type 1
The estimating equation for the model is:
𝐻𝑒𝑎𝑡 𝑊𝑎𝑣𝑒 𝐷𝑒𝑎𝑡ℎ𝑠̂ = 0.647 − 0.365 ∗ 𝑇𝑦𝑝𝑒 1
Because the p-value for the Type 1 variable is 0.032, the model is significant at the 0.05 level. Thus, there is a significant relationship between neighborhood type and mortality. Census tracts classified as Type 1 are associated with a decrease in heat wave-related deaths of about 0.365 when compared to census tracts classified as Types 2-9. (See Appendix 4 for complete STATA outputs used to inform estimating equations and model interpretations.)
Low vs. High-Tier Neighborhood Types
The previous observation that higher neighborhood types are associated with lower rates of mortality is further supported by the results of STATA
regression analyses that categorize census tracts into low-tier and high-tier groups. Dummy variables were generated for the group of census tracts classified as high-tier neighborhood types. A high-high-tier group was defined using two methods, and thus two regression analyses were run. Both regression analyses considered the high-tier dummy variable as the independent variable and the number of deaths as the
dependent variable. See Appendix 5 for complete STATA outputs of regression analyses for low and high-tier groups.
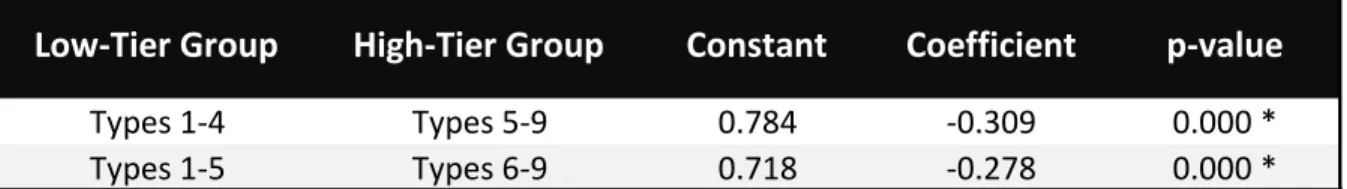
Figure 5 summarizes the results of regression analyses conducted for high-tier groups. The first regression analysis defined a high-high-tier group as being
* Significant at the 0.05 level
Figure 5: Summary of Regression Analyses – Low vs. High-Tier Groups
In both regression analyses, a high-tier neighborhood type was found to be a significant predictor of heat wave mortality. According to both definitions, a high-tier neighborhood type was significant at the 0.05 level. When the high-high-tier group is defined as Types 5-9, high-tier census tracts are associated with a decrease in heat wave-related deaths of about 0.309 when compared to low-tier census tracts.
Alternately, when the high-tier group is defined as Types 6-9, high-tier census tracts are associated with a decrease in deaths of about 0.278 when compared to low-tier tracts. The first definition of a high-tier group, which only considers Types 5-9, demonstrates the largest reductive effect on mortality because its associated coefficient has the higher absolute value.
Low-Tier Neighborhood Types
Regression analyses reveal few distinctions between neighborhood types in the low-tier group. For the purposes of these analyses, low-tier neighborhood types were considered census tracts classified as Type 5 and lower. Type 1 neighborhoods were excluded from this analysis because their effect on mortality deviated from the broader trend of increased mortality demonstrated among low-tier neighborhood types. As seen in Figure 4, the Type 1 variable has a negative coefficient, which indicates Type 1 neighborhoods are associated with a decrease in the number of heat wave-related deaths when compared to other neighborhood types. Dummy variables were generated for a range of scenarios with different low-tier reference and non-reference groups. A total of six regression analyses were run in order to compare every low-tier neighborhood type against every other low-tier
neighborhood type. Regression analyses considered the low-tier dummy variable as the independent variable and the number of deaths as the dependent variable. See Appendix 6 for complete STATA outputs of regression analyses for low-tier
neighborhood types.
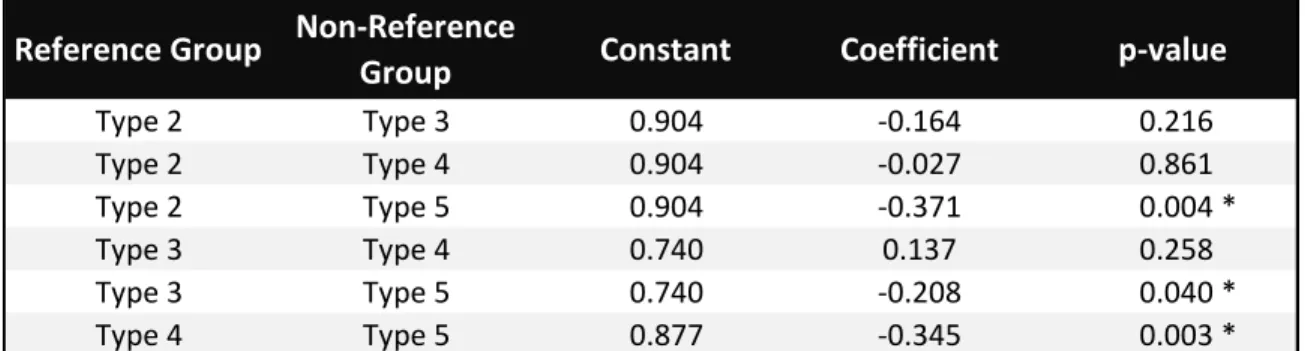
Figure 6 summarizes the results of regression analyses conducted for low-tier neighborhood types. A single neighborhood type, Type 5, was found to be a significant predictor of heat wave mortality. In all of its three regression analyses, Type 5 was found to be significant at the 0.05 level. Additionally, the regression analyses produced negative coefficients for the dummy variable representing Type 5 classification. In other words, census tracts classified as Type 5 are associated with lower rates of heat wave mortality when compared to all other low-tier neighborhood types.
Low-Tier Group High-Tier Group Constant Coefficient p-value
Types 1-4 Types 5-9 0.784 -0.309 0.000 *
* Significant at the 0.05 level
Figure 6: Summary of Regression Analyses – Low-Tier Group
The regression analyses conducted for Type 5 can be interpreted as follows:
Census tracts classified as Type 5 are associated with a decrease in heat wave-related deaths of about 0.371 when compared to census tracts classified as Type 2.
Census tracts classified as Type 5 are associated with a decrease in heat wave-related deaths of about 0.208 when compared to census tracts classified as Type 3.
Census tracts classified as Type 5 are associated with a decrease in heat wave-related deaths of about 0.345 when compared to census tracts classified as Type 4.
Ultimately, regression analyses of low-tier neighborhood types provide consistent evidence that only census tracts classified as Type 5 are associated with significantly lower rates of mortality among low-tier neighborhood types. The implications of this conclusion are important. Stated in other terms, this finding reveals that there are no discernable differences between low-tier neighborhood types in terms of their effects on heat wave mortality, with the exception of Type 5. Furthermore, if the primary definition of low-tier neighborhood types, which consists of Types 1-4, was utilized in this analyses, the conclusion would be even more simple: In terms of heat wave mortality, there is no significant difference in predictive effect between low-tier neighborhood types.
Reference Group Non-Reference
Group Constant Coefficient p-value
Type 2 Type 3 0.904 -0.164 0.216
Type 2 Type 4 0.904 -0.027 0.861
Type 2 Type 5 0.904 -0.371 0.004 *
Type 3 Type 4 0.740 0.137 0.258
Type 3 Type 5 0.740 -0.208 0.040 *
Discussion of Mortality Risk Analysis
Relationship Between Neighborhood Type and Heat Vulnerability
A series of regression analyses validated initial observations made from spatial and graphical visualizations of heat wave mortality during the 1995 Chicago Heat Wave. The results of individual regression analyses for neighborhood types indicated that higher neighborhood types are associated with lower rates of
mortality. As demonstrated in Figure 4, a majority of coefficients for Type 1-4 were found to be positive, while all the coefficients for Types 5-9 were found to be negative. Additional regression analyses that evaluated differences in mortality between low-tier and high-tier neighborhoods provided further evidence to support this broader trend. Classification as a high-tier neighborhood type was found to be a significant predictor of heat wave mortality. As Figure 5 demonstrates, when a high-tier group is defined as Types 1-4, high-high-tier census tracts are associated with a decrease in heat wave-related deaths of about 0.309 when compared to low-tier census tracts.
While a broad relationship between neighborhood types and heat wave mortality was established, further regression analyses revealed few differences between low-tier neighborhood types with regards to their predictive power. A single neighborhood type, Type 5, was found to be a significant predictor of heat wave mortality. As Figure 6 demonstrates, census tracts classified as Type 5 are associated with a decrease in heat wave-related deaths of at least 0.208 when compared to every low-tier neighborhood type. However, it is important to note that this conclusion results from the use of a more inclusive definition of a low-tier group to designate reference and non-reference groups. If a high-tier group was defined as being comprised of Types 5-9, which Figure 5 demonstrates has the greatest reductive effect on mortality, Type 5 would not be considered a low-tier neighborhood type. Thus, it is not unreasonable to define a low-tier group as Types 1-4 and subsequently conclude that there is no significant difference in predictive effect between low-tier neighborhood types.
Tradeoffs Between Heat Risk Reduction and Displacement
Findings from the analysis of heat mortality attributed to the 1995 Chicago Heat Wave offer a cautionary tale when considering the use of neighborhood economic development as a tool for hazard mitigation. Interventions to induce changes in neighborhood type can pose tradeoffs between reducing the risk of heat-related mortalities and displacing existing residents, particularly in low-income neighborhoods.
Figure 7 outlines changes in heat-related mortality risk and average household income associated with the transition of a Type 2 neighborhood.
46% of existing Type 2 neighborhoods remained unchanged during the 10-year period between 1990 and 2000 (Weissbourd, Bodini, and He 2009). As Appendix 8 demonstrates, Type 2 neighborhoods are most likely to transition into Type 3, Type 4, Type 5, Type 6, or Type 8 neighborhoods. Two additional regression analyses were conducted to compare Type 2 neighborhoods against the five neighborhood types it was most likely to transition into. Dummy variables were generated for the two additional scenarios with different non-reference groups (Type 6 and Type 8). Regression analyses considered the dummy variable as the independent variable and the number of deaths as the dependent variable. See Appendix 7 for complete STATA outputs of these regression analyses.
* Significant at the 0.05 level ** Significant at the 0.10 level
Source: Dynamic Neighborhoods: New Tools for Community and Economic Development (pages 121-143)
Figure 7: Summary of Regression Analyses – Tradeoffs of Neighborhood Change
As Figure 7 demonstrates, a radical transition in neighborhood type is needed for a Type 2 community to experience a significant reduction of mortality risk due to neighborhood change. A Type 2 community would only be likely to experience a significant reduction in heat wave mortality if it transitioned into a Type 5, Type 6, or Type 8 neighborhood. This is the case because regression analyses only indicate Type 5, Type 6, and Type 8 neighborhoods are associated with a significant decrease in the number of heat-related deaths compared to Type 2 neighborhoods at the 0.10 level.
However, Type 2 communities that transition into higher income
neighborhood types may face displacement of low-income renters due to rising housing costs. Median incomes in Type 2 neighborhoods average around $20,900 (Weissbourd, Bodini, and He 2009). As Figure 7 demonstrates, significant
reductions in heat vulnerability for a transitioning Type 2 neighborhood will be associated with an increase in average household income of at least $16,400— almost 80% of its initial average income. Unfortunately, there is no scenario where a Type 2 neighborhood can transition in a manner that is associated with both a significant reduction in heat vulnerability and minimal displacement. Ultimately, caution should be exercised when advocating for economic development as a strategy for reducing heat vulnerability to avoid displacing vulnerable low-income
Reference Group Non-Reference
Group Coefficient p-value
Change in Average Household Income
Type 2 Type 3 -0.164 0.216 2,900
Type 2 Type 4 -0.027 0.861 11,100
Type 2 Type 5 -0.371 0.004 * 16,400
Type 2 Type 6 -0.682 0.097 ** 19,100
Policy Recommendations
Findings from an analysis of mortalities attributed to the 1995 Chicago Heat Wave established a general relationship between neighborhood typology and heat vulnerability, with some limitations. By communicating neighborhood dynamics in an intuitive manner, neighborhood typologies can serve as an “actionable” data-based reference for policymakers engaged in emergency management and hazard mitigation planning. The following recommendations outline a range of actions policymakers can adopt to improve the performance of emergency management and hazard mitigation strategies for future heat events within the City of Chicago.
Recommendation #1: Develop neighborhood-specific heat response plans to
effectively address intra-city variations in heat vulnerability.
Analysis of mortality data from the 1995 Chicago Heat Wave provided evidence affirming a broad relationship between neighborhood type and heat vulnerability within the city. Results from a series of regression analyses indicate that high-tier neighborhood types are associated with significantly lower rates of mortality than those found in low-tier neighborhood types. Given these pronounced community-level differences in heat vulnerability, policymakers should utilize the most recent 2006 DNT typology to inform the development of heat response plans for specific neighborhoods. In doing so, policymakers can effectively allocate limited municipal resources in accordance with the unique assets, needs, and constraints of individual communities. More specifically, the DNT typology can facilitate heat event preparedness and real time decision-making by presenting information regarding relevant demographic and built environment characteristics to policymakers, including the availability of civic or private places for heat relief and educational or linguistic barriers to disseminating public health information to residents.
Recommendation #2: Integrate neighborhood “greening” initiatives with local land
use planning process to promote the implementation of high-impact heat mitigation projects.
As previously stated, analysis of mortality data from the 1995 Chicago Heat Wave indicates low-tier neighborhood types are associated with significantly higher rates of heat vulnerability than their high-tier counterparts. Neighborhoods that experience a relatively high degree of heat vulnerability due to place-based factors, specifically a high proportion of impervious land cover and/or lack of vegetation, are ideal candidates for greening initiatives that aim to moderate urban heat island effects at the community-scale. In coordination with local planning agencies,
executing fragmented projects with limited results. Ultimately, this multi-agency approach will increase the likelihood of implementation and the realization of public health benefits from community-scale greening initiatives.
Recommendation #3: Use DNT neighborhood trends to anticipate and prepare for
changes in intra-city heat vulnerability.
The Dynamic Neighborhoods final report suggests that neighborhoods have a
30% chance of changing type within a 10-year period. However, the likelihood of undergoing a neighborhood transition varies according to neighborhood type, as low-income communities tend to change neighborhood types more often than high-income communities (Weissbourd, Bodini, and He 2009). Given the fluid nature of neighborhood types, policymakers should utilize the DNT Neighborhood Transition Matrix (shown in Appendix 8) to anticipate changes in heat vulnerability due to neighborhood transitions, monitor neighborhoods of interests, and plan future emergency management and land use programs accordingly. For example,
policymakers can use the Transition Matrix to identify neighborhoods most likely to transition from high-tier to low-tier neighborhood types and thus experience a significant increase in heat vulnerability. Additionally, policymakers can identify neighborhoods most likely to remain low-tier neighborhood types, which would experience no significant changes in heat vulnerability. Because these
neighborhoods are sites of existing and likely continued high rates of heat
vulnerability, policymakers should prioritize long-term heat mitigation planning in these communities.
Recommendation #4: Assess the impact of community-scale programs by using the
DNT typology to identify comparable neighborhoods.
As the Dynamic Neighborhoods final report describes, the use of hybrid hierarchical clustering to construct the DNT Neighborhood Typology allows the closest peer of any given neighborhood to be identified (Weissbourd, Bodini, and He 2009). This feature has important implications for impact analyses evaluating the effects of heat-related hazard mitigation projects at the neighborhood level. By identifying neighborhoods comparable to the one or ones in which an intervention is implemented, DNT typology allows a user to establish control or baseline
conditions. Thus, changes in indicator variables due to an intervention can be
Recommendation #5: Consider SROs and senior public housing as “hotspots” of heat vulnerability to address vulnerable populations not captured at the neighborhood-level.
Analysis of mortality data from the 1995 Chicago Heat Wave found no
discernable differences between low-tier neighborhood types (Type 1-4) in terms of their effects on heat wave mortality. This conclusion was likely reached because the geographic scale used to evaluate patterns of heat mortality, census tracts, was too large to capture known variations in heat vulnerability within neighborhoods. As Klinenberg contends in Heat Wave, a disproportionately high number of deaths attributed to the 1995 Heat Wave may have occurred in single room occupancy (SROs) dwellings and senior public housing (Klinenberg 2002). Given that both of these types of residences tend to house populations with individual risk factors that increase the likelihood of heat-related illness or death, policymakers engaged in emergency management and hazard mitigation should consider SROs and senior public housing facilities as priority sites for interventions. Policymakers should be wary of interpreting the finding that there are no significant differences between low-tier neighborhoods as there being no residential properties that function as points of extreme heat vulnerability within already vulnerable neighborhoods.
Conclusion
Findings from an analysis of deaths attributed to the 1995 Chicago Heat Wave provide evidence to affirm a general relationship between the DNT
Neighborhood Typology and heat vulnerability within Chicago. Regression analyses indicate low-tier neighborhood types are associated with a significantly higher heat risks than high-tier neighborhood types. The demonstrated relationship between neighborhood typology and heat vulnerability has several implications for heat-related emergency management and hazard mitigation planning for the City of Chicago. By communicating neighborhood dynamics in an intuitive manner,
References
CDC. 2001. “Heat-Related Deaths-Los Angeles County, California, 1999-2000, and United States, 1979-1998.”
http://www.cdc.gov/mmwr/preview/mmwrhtml/mm5029a3.htm.
Chestnut, Lauraine. 1998. “Analysis of Differences in Hot-Weather-Related Mortality Across 44 US Metropolitan Areas.” Environmental Science and Policy 1 (1): 59–70.
Clarke JF. 1972. Some Effects of the Urban Structure on Heat Mortality.
Environmental Research 5 (1): 93-104
Johnson, Daniel P. 2012. “Developing an Applied Extreme Heat Vulnerability Index Utilizing Socioeconomic and Environmental Data.” Applied Geography 35 (1-2): 23-31.
Kilbourne, E. 1982. “Risk Factors for Heatstroke. A Case-Control Study.” JAMA 247 (24): 3332–36.
Kim, Youngmin, and Seunghun Joh. 2006. “A Vulnerability Study of the Low-Income Elderly in the Context of High Temperature and Mortality in Seoul, Korea.” Science of the Total Environment 371 (1-3): 82–88.
Klinenberg, Eric. 2002. Heat Wave: A Social Autopsy of Disaster in Chicago. Chicago, IL: The University of Chicago Press.
Knowlton, K. 2009. “The 2006 California Heat Wave: Impacts on Hospitalizations and Emergency Department Visits.” Environmental Health Perspectives 117 (1): 61– 67.
Luber, Sanchez. 2006. “Heat-Related Deaths-United States, 1999-2003.” Morbidity and Mortality Weekly Report.
http://www.cdc.gov/mmwr/preview/mmwrhtml/mm5529a2.htm.
Medina-Ramon, M. 2006. “Extreme Temperatures and Mortality: Assessing Effect Modification by Personal Characteristics and Specific Cause of Death in a Multi-City Case-Only Analysis.” Environmental Health Perspectives 114 (9): 1331–36.
Naughton, M. 2002. “Heat-Related Mortality during a 1999 Heat Wave in Chicago.”
American Journal of Preventive Medicine 22 (4): 221–27.
Reid, Colleen E. 2009. “Mapping Community Determinants of Heat Vulnerability.”
Environmental Health Perspectives 117 (11): 1730–36.
New York City, 1997-2006.” Health and Place 30: 45-60.
Schwartz, J. 2005. “Who Is Sensitive to Extremes of Temperature? A Case-Only Analysis.” Epidemiology 16 (1): 67–72.
Stafoggia, Forastiere. 2006. “Vulnerability to Heat-Related Mortality: A Multicity, Population-Based, Case-Crossover Analysis.” Epidemiology 17 (3): 315–23.
Thomas, Mike. 2015. “An Oral History: Heat Wave.” Chicagomag.com.
http://www.chicagomag.com/Chicago-Magazine/July-2015/1995-Chicago-heat-wave/.
Uejio, Christopher K. 2011. “Intra-urban Societal Vulnerability to Extreme Heat: The Role of Heat Exposure and the Built Environment, Socioeconomics, and
Neighborhood Stability.” Health and Place 17 (2): 498–507.
Walk Score. 2016. “Walk Score Methodology.”
https://www.walkscore.com/methodology.shtml.
Weissbourd, Robert, Riccardo Bodini, and Michael He. 2009. Dynamic
Neighborhoods: New Tools for Community and Economic Development. Chicago, IL.
Appendix
Appendix 1: Methodology of Heat Vulnerability Index
The Heat Vulnerability Index was composed in 2009 to map national heat vulnerability at the census tract-level. The Index utilized ten variables shown to increase vulnerability to heat-related health effects in urban areas and for which national data sets were available. Variable were grouped into four factors, including social and environmental vulnerability, social isolation, prevalence of no air
conditioning, and proportion of elderly and diabetes. The Heat Vulnerability Index summed these four factors and produced cumulative values that ranged from 7 to 22. As the map below illustrates, spatial clustering of heat vulnerability near urban areas occurs throughout the nation.
Source: Reid, Colleen E. 2009. “Mapping Community Determinants of Heat Vulnerability.”
Source: Weissbourd, Robert, Riccardo Bodini, and Michael He. 2009. Dynamic Neighborhoods: New Tools for Community and Economic Development. Chicago, IL.
Appendix 3: Heat Map of the DNT Neighborhood Typology Structure
The heat map below illustrates the overall structure of the DNT neighborhood typology. Neighborhoods are grouped according to their scores on 23 different variables identified as key determinants of neighborhood type. Each column of the heat map can be interpreted as a census tract, and each row represents an indicator variable. The score of each tract is represented by degrees of color, with dark red indicating a very low score and dark blue indicating a very high score.
Source: Weissbourd, Robert, Riccardo Bodini, and Michael He. 2009. Dynamic Neighborhoods: New Tools for Community and Economic Development. Chicago, IL.
Appendix 6: STATA Outputs – Regressions of Low-Tier Group
Reference Group: Type 3
Appendix 7: STATA Outputs – Regressions of Neighborhood Change Tradeoffs
Appendix 8: Neighborhood Transition Matrix, 1990-2000
Source: Weissbourd, Robert, Riccardo Bodini, and Michael He. 2009. Dynamic Neighborhoods: New Tools for Community and Economic Development. Chicago, IL.