The Impact of Secondary Innovation on Firm Market Value in the Pharmaceutical Industry
By: Maitri Punjabi
Honors Thesis Economics Department
The University of North Carolina at Chapel Hill
March 2016
Approved:
______________________________
Abstract
This paper analyzes the effect of the changing nature of innovation on pharmaceutical firm
market value from the years 1987 to 2010 by using U.S. patent and claim data. Over the years,
firms have started shifting focus from primary innovation to secondary innovation as new ideas
and new compounds become more difficult to generate. In this study, we analyze the impact of
this patent portfolio shift on the market capitalization of pharmaceutical firms. After using firm
fixed effects and the instrumental variable approach, we find that there exists a strong positive
relationship between secondary innovations and the market value of the firm– in fact, we find a
stronger relationship than is observed between primary innovation and market value. When
focusing on the different levels of innovation within the industry, we find that this relationship is
stronger for less-innovative firms (those that have produced fewer patents) than it is for
highly-innovative firms. We also find that this relationship is stronger for firms that spend less on
research and development, complementing earlier findings that research productivity is declining
Acknowledgements
I would primarily like to thank my adviser, Dr. Jonathan Williams, for his patience and constant
support. Without his kind and helpful attitude, this project would have been a much more
frustrating process. Through his knowledge of the industry, I have gained valuable insight and
have learned a great deal about a unique and growing field. I would also like to give my gratitude
to Dr. Klara Peter, my faculty adviser for this project. She not only helped us understand our own
topics from an economic modeling perspective, but she also put in long hours to ensure that we
always remain on track. Her encouragement throughout the entire process pushed me to continue
I. Introduction
The motivation behind researching the pharmaceutical industry is that its massive size
and strong patent protection creates opportunities for huge amounts of profit, attracting hundreds
of firms that incur huge costs. From 1980 to 2014, the U.S. economy grew approximately five
times larger, whereas the amount of money spent by U.S. pharmaceutical companies on R&D
grew roughly twenty-five times larger. In addition to this, the pharmaceutical industry is rapidly
changing in the type of innovation and rate of patenting. The total number of patents filed and
total R&D spending have both been increasing, while the productivity of investments has
declined. This paper aims to measure the effect of this change in innovation on firm decisions
and performance – which may help predict firm behavior in the future. If firms realize that these
secondary innovations, which define the changing pharmaceutical industry, actually do not add
much to their market values, these types of innovations may begin to decrease. This could be
detrimental to not only firms in the industry, but to society as a whole. These innovations matter
to consumers who are paying the high prices for drugs produced by these patent-formed
monopolies. Cases of manipulating the patenting system are becoming a source of concern as a
moralistic responsibility to provide consumers with affordable, efficient drugs comes into play.
Furthermore, this paper aims to measure the value that secondary innovations contribute
to a pharmaceutical firm’s market value. In other words, does secondary innovation, which
represents the new, emerging trend, truly matter from a firm’s perspective? Should firms continue research and development to improve upon a drug that has already been patented? In
order to answer these questions, we analyze patent portfolios of pharmaceutical firms over a
instrumental variable approaches, we compare these changes to market capitalization data for
each firm in order to assess the relationship between secondary innovation and market value.
In the next section, we provide general background information needed to understand the
research question and, more specifically, the U.S. patenting system. In section III, we provide a
summary of research from the past and explain our contributions to the already existing
literature. In section IV, we explain our theoretical approach, and in section V, we develop an
empirical model used for our analysis. In section VI, we describe the data and point out
noteworthy trends. In sections VII and VIII, we discuss the econometric approaches used and
produce results, concluding in section IX with remarks about potential implications and our
major findings.
II. Background
The patenting system in the United States was designed to incentivize innovation. The
pharmaceutical industry, with its high R&D costs, requires very attractive incentives in order for
any research or innovation to occur. Patents on innovative drugs provide such incentives by
protecting firms from competition and therefore granting them market power to set their own
prices. In theory, the patenting system is meant to increase innovation to a more socially optimal
level. In practice, however, firms may manipulate the patenting system to maintain market power
beyond a socially desirable level. Langinier (2004) explains that if market profitability is high, a
competitor will enter the market through further innovation on the patented product. Patents are
therefore barriers-to-entry only when the market is not highly profitable. This finding illuminates
chain of decisions that all influence a firm’s decision whether or not to conduct R&D and patent
a product.
After the Hatch-Waxman Act of 1984, generic entry became easier as firms did not have
to conduct clinical trials for generic drugs anymore. By simply showing bioequivalence, they are
now able to bypass this costly stage, resulting in the surge of generic-producing firms in the
market. Simultaneously, the Hatch-Waxman Act intended to stimulate innovation by providing
three years of market exclusivity to incrementally modified versions of original drugs. Since
then, secondary innovation has drastically increased. In addition, patents on new compounds or
active ingredients have been decreasing in percentage, as innovators are not able to come up with
new chemical compounds and are relying on secondary innovation to build upon already existing
innovation. As a result, the majority of primary innovation is being conducted in smaller labs
within biotech firms. Therefore, the pharmaceutical industry is moving away from such
innovation. New secondary patents coming out of the pharmaceutical industry are called
functional patents, which introduce new uses for or slightly modified versions of previous
innovations. Figure 4 shows the drastic increase in the number of claims filed per year;
specifically, the increase in functional claims (method and formulation claims) demonstrate this
rise in secondary innovation.
III. Literature Review
There is dense literature on the pharmaceutical industry in general, as the complex
regulatory system attracts much research. Acting as a prime example of a market needing high
incentives for optimal social benefits, some literature in the past has specifically focused on
papers on the game theory involved in patent introductions, patent thickets, and lifecycle
management strategy. Early on, Griliches (1981) paved the way for studies that dealt with patent
valuation. He finds a relationship between market value and the intangible capital of a firm and
further concludes that R&D expenditures and the number of patent applications are good
measures of inputs into the model.
Ariel Pakes (1985) first introduced the relationship between patent applications, a firm’s
innovative activity, and a measure of its inventive output – the stock market value of the firm.
Pakes used stock market values for the first time, arguing that the public-good characteristics of
inventive output make it extremely difficult to market, and that “changes in the stock market
value of the firm should reflect changes in the expected discounted present value of the firm’s
entire uncertain net cash flow stream” (Pakes 392).
Many years later, Graham and Higgins (2007) find that the relationship between R&D
expenditures and new product introductions is smaller than previously reported, implying that
research productivity has been declining. This conclusion puts earlier findings back into
question. As Griliches stated in 1981, R&D expenditures and the number of patent applications
are good inputs into the function for market value. If research productivity has been declining,
however, does this function behave differently? Does a patent portfolio now hold more
importance in terms of reflecting a firm’s innovative level? Our paper hopes to answer these
questions. Graham and Higgins also find that there exists no relationship between firm size and
new product introductions, an important finding for our study as firm sizes differ significantly in
our dataset. The loss of research productivity over time is also mentioned by Choi and Gerlach
(2014). They conclude that it becomes impractical to develop a new product that doesn’t infringe
This finding could explain a slowdown in the number of patent applications or approvals on
primary innovations and the change in the patent composition, as well.
The findings from this paper will add to the existing literature, expanding on previous
work by using patent and market data collected over a 23-year period. We hope to use this
unexplored data set in order to test whether Griliches’ findings from 1981 (that there exists a
relationship between market value and the intangible capital of a firm) holds in an empirical
framework many years after his publication. The idea of modeling firm market value through
patent portfolios and the types of claims listed has not been deeply explored in the past.
Furthermore, we will address unanswered questions regarding secondary innovation, which is
often times a new and overlooked concept in innovation literature. The growing importance of
secondary innovation needs to be understood in a technical way, and we provide methods by
which economists and policymakers can better make sense of such a complex and dynamic
industry. More specifically, we use empirical methods to explore the impact of different types of
patent claims on firm market value in hopes of explaining the relationship between this new
innovation trend and the growth in the pharmaceutical industry’s market capitalization over time.
IV. Theoretical Approach
Does a firm’s market capitalization data truly reflect its value? A foundational paper
released in 1970 by Eugene Fama argues that the stock market “fully reflects” available
information if transaction costs of obtaining information and trading are low, as they are in the
U.S. This became known as the Efficient Market Hypothesis (EMH), which suggests that in an
efficient market, profiting from predicting price movements is very difficult and highly unlikely
security prices reflect all available information. We use the EMH as the basis of our theoretical
model so that we can extend it to support the validity and strength of our empirical model.
In the Efficient Market Hypothesis, there are three forms of market efficiency. The first is
the weak form, in which a random-walk model is used. In this form of efficiency, prices are
based on past prices and information. Since the stock market does not move randomly, evidence
against this form is strong, causing many economists to reject its applicability. The second form
of market efficiency is the semi-strong form, in which markets do not over or under react to new
public information. Current prices incorporate all publicly available information. This form is
widely accepted as investors have equal access to public information for U.S. markets. In the
third form of market efficiency, strong-form, current prices fully incorporate all existing
information, including both public and private (insider) information. Since private information is
not commonly traded upon in the pharmaceutical industry (average people do not know what is
always in a pharmaceutical firm’s drug pipeline), this form is not applicable to our study. In fact,
Sanford Grossman and Joseph Stiglitz (1980) explain that market frictions may limit market
efficiency, concluding that semi-strong market efficiency is the most realistic for many cases.
Furthermore, since our study is a long-term study, we use the semi-strong form to support the
argument that current stock prices contain all available information, making market
capitalization data an accurate representation of a firm’s true market value. Furthermore, in “The
Financial Information Content of Perceived Quality,” David Aaker and Robert Jacobson (1994)
found that stock prices accurately reflect product quality of a firm, a finding that further
strengthens the use of the Efficient Market Hypothesis as a theoretical model for our study of the
Applying this theory to describe our theoretical model, we see that market value is a
function of a firm’s assets, including both tangible (labor, capital, R&D, etc.) and intangible
(knowledge or innovation in the form of patents). Information on both of these asset groups are
available to the public, and therefore stock prices should accurately reflect the firm’s value in the
market (Fama). Costs that act as investments (such as research and development costs) are inputs
in the function of market value and can be easily measured, as well. Intangible knowledge assets,
such as the number of patents held and the types of claims filed, are also inputs to the function.
By the Efficient Market Hypothesis, we assume that markets are correctly valuing firms and
therefore that the error term has mean zero given that all assets are accounted for in this model.
V. Empirical Model
The model that Griliches employed in his 1981 publication, “Market value, R&D, and
patents,” is simple and lacks many variables that also may change stock market prices. The
empirical model employed for this study uses the firm’s patent portfolio as its main right-hand
side variable and the firm’s market capitalization as its left-hand side variable. Research and
development expenditure is also included in the equation, and it is lagged once as R&D
expenditure is expected to bring future profits rather than immediate gain. Therefore, our
regressions begin with 1987 as we use 1986 data for our lagged R&D values.
While trying to answer our research question, however, we come across the problem of
endogeneity. There are factors that influence both the decision to patent and also the market
value of the firm. In technical terms, this implies that the covariance of the independent variable
(the patent portfolio) and the error term does not equal zero. For example, if a firm such as Pfizer
regression may not capture that difference. In order to control for the endogeneity in our
research, we use the firm fixed effects approach. Things that may differ across firms include
labor force quality in management and research, legal services quality, access to technology, etc.
To account for these differences, we introduce a firm dummy variable that is constant over time,
represented by µi. We also include the S&P 500 Index in our regression in order to account for average stock market movements in that year (time control) since the S&P Pharmaceuticals
Select Industry Index is only available for years following 1996. This also controls for inflation
and other market changes that occurred over time, leaving R&D expenditure and patent
information as the only determinants that should cause deviation in market value from the stock
market average. Furthermore, a trend variable is also included in our model, which is simply the
number of years since the beginning of the data set (1987). This variable accounts for the fact
that market capitalization should be increasing over time due to technological progresses in the industry, a factor not explained by any other variables in the model.
This creates our empirical model:
log(MarketValuei,t) = B0 + B1(NumPatentsi,t) + B2(PropClaimsi,t) + B3(R&Di,t) + B4(R&Di,t-1) + B5(S&Pt) + B6(Trendt) + µi + εi,t
MarketValuei,t – Market capitalization of firm i in time t, $ NumPatentsi,t – Number of patents held by firm i in time t
PropClaimsi,t – Proportion of claim categories for firm i in time t R&Di,t – Research and development expenditure for firm i in time t R&Di,t-1 – Research and development expenditure for firm i in time t-1 S&Pt – S&P 500 Index in time t
Some additional modifications were also made to the simple baseline model described
above. In order to accurately interpret our results, we transform our claim data into proportions.
We do so by summing total claims and diving each category by the total. Therefore, we are able
to use one type of category as a base and interpret a marginal change in the composition of
claims (e.g. the impact of a 1 percent increase in formulation claims as compared to a 1 percent
increase in compound claims). Similarly, we take the logarithm of our market capitalization
values in order to interpret the results as a percent change in market value rather than an absolute
change.
Although the fixed effects approach helps us account for firm differences, it may not be
enough to address all of the complexities in our research. Therefore, we also employ the
instrumental variable approach in order to account for changes in factors across firms over time.
For example, if a new policy promotes and incentivizes innovation in a certain field, the
pharmaceutical firms specializing in that field would reap the benefits more than those that are
not as specialized. We would not see this in our results, and therefore, we must control for any
drastic changes in incentives in the pharmaceutical industry that affect varying firms differently
over time since our data contains large amounts of heterogeneity. In order to account for these
changes, we use instrumental variables that are uncorrelated with the error term but correlated
with the independent variable (number of patents). In other words, they affect the patent portfolio
of a firm without affecting its management quality, legal services department quality,
researchers’ knowledge, or anything else contained in our error term εit. The instruments that we employ for this study include FDA regulatory changes, acts of Congress, and a landmark
• Instrumental Variable I: (1992) Prescription Drug User Fee Act – requires drug and biologics manufacturers to pay additional fees for product applications and supplements.
• Instrumental Variable II: (1995) Uruguay Round Agreements Act – extends the patent terms of U.S. drugs from 17 to 20 years; also called Patent Term Restoration Act.
• Instrumental Variable IIIa: (1999) Food and Drug Administration Modernization Act – reduced approval time drastically for pharmaceutical patents.
• Instrumental Variable IIIb: (1999) American Investors Protection Act – made
application fees cheaper, introduced First Inventor Defense, which provides defense for
prior users when patent infringement happens, and includes the Patent Term Guarantee
Act, which extends patent terms to account for USPTO delays.
• Instrumental Variable IV: (2002) Supreme Court ruling of FTC v. Schering-Plough – In this decision, the judges upheld a pay-for-delay settlement over the drug K-Dur
(Jacobo-Rubio et. al.). Schering-Plough attempted to pay off Upsher-Smith Laboratories
and American Home Products Corporation to delay the entry of their generic versions of
K-Dur. This ruling showed that patent-holding firms can legally pay off future generics
producers in order to longer maintain market power.
A simple first-stage model for the instrumental variable approach is given by:
NumPatentsi,t = π0 + π1(Zt) + π2(Xi,t) + γi,t
Here, NumPatentsi,t is again the number of patents of firm i at time t, and Zt is the instrumental
variable(s) we employ. We include Xi,t, representing (PropClaimsi,t, R&Di,t, R&Di,t-1, S&Pt,
Trendt, µi) from our original model. We decided to use up to all four instruments for our study, as
lagged effect from these policies and court cases. Therefore, other than standard binary variables
that indicate the “before” and “after” a policy, we include variables that represent “years since”
the implementation of a policy (which is increasing over time). By including these eight
variables as instruments, we are able to account for any changes in the incentives to innovate and
patent over time. Furthermore, combining these instruments with the fixed effects approach in
our regression by using the two-stage least squares method allows for us to control for factors
that change over time across different firms, increasing the accuracy of our model and
estimation.
VI. Data
The patent data that we will be using was acquired from the FDA’s Approved Drug
Products database (The Orange Book). Since the Hatch-Waxman Act required patents associated
with approved drugs to be listed in this database, patents and exclusivities covering each drug at
each point in time is listed. Since The Orange Book was not published in 1986, the patent data is
missing for that entire year, and therefore we analyze the years between 1987 and 2010.
The patent claims data, acquired from the United States Patent and Trademark Office,
was collected from old FDA and USPTO records and books and had to be manually entered into
a system since full digitization of USPTO records was not implemented until just a few years
ago. Therefore, the information contained in this data set has not been widely used for analysis
prior to this study. In this data, multiple claims are listed under single patents and are classified
as: compound, formulation, method, device, process, and other. A description of each type of
claim, along with definitions of all other variables, is provided in Data Table 1. For our research
as indicators of secondary innovation. Figure 4 shows an increasing trend in method and
formulation claims and a stagnant trend in compound claims, supporting the argument that
secondary innovation has been on the rise in recent decades.
The market capitalization data was acquired from the Center for Research in Security
Prices (CRSP) through the Wharton Research Data Services (WRDS) online database. This
market capitalization data is our measure of market value of each individual pharmaceutical firm,
representing the dependent variable in our study. Trends in the pharmaceutical industry’s market
capitalization show an upward movement over this range of time, as shown in Figure 5 below.
We see dips in total industry market capitalization during the period after September 11, 2001 (a
time when the stock market was reacting to the terrorist attacks in the U.S.) and during the
2007-2008 financial crisis. Following from previous work by Griliches, we acquired R&D expenditure
data for each firm to include in our regressions along with the patent data. We also obtained this
data from CRSP through the WRDS online database. Figure 6 shows the trend in R&D
expenditure over time, and we again see a drop in expenditure during the financial crisis.
In order to include a time control variable, we include the S&P 500 Index for each year in
our regressions, as well. Since the S&P Pharmaceuticals Select Industry Index only goes back to
1996, we substitute this industry index with the S&P 500 Index as an approximation. By
including this variable, we hope to account for time shocks in the stock market, such as the
financial crisis of 2007. This data was also acquired from CRSP through the WRDS database.
While creating the final data using these separate data sets, we encountered and addressed
a handful of issues. For one, the original patent data is comprised of all filed patents – even for
international companies that are not publicly listed in the U.S. Therefore, we drop those
we come across is within our patent data, as well. After analyzing the dataset, we notice that
several consumer-based companies are present. Large companies such as Colgate, Bausch &
Lomb, and Johnson and Johnson are being compared to companies such as DUSA
Pharmaceuticals, Inc. and MGI Pharma, Inc. These massive consumer-based companies produce
many different types of products such as household products, personal hygiene products, contact
lenses, etc. This creates huge heterogeneity within our data set. However, this is similar to the
composition of most industries in the real world. Since the pharmaceutical industry does not
solely consist of innovation-focused firms, we see this wide range in firm size and levels of
innovation.
In order to correctly model the innovative segment of the industry, a few additional steps
are taken so that results can be interpreted clearly. After running regressions on the entire data
set, we create a subset of the data that consists of only firms labeled as “Biotech & Pharma”
under the Bloomberg Industry Classification. We therefore drop firms listed as: Medical
Equipment & Devices, Health Care Facilities & Services, Consumer Products, and Materials (a
total of 316 of the 1808 observations are dropped). A list of all of the firms in our entire data set,
along with their respective industry classifications, is provided in Data Table 2. In addition to our
full data set, we also run regressions with firm fixed effects and instrumental variables on our
“Biotech & Pharma” subset. We also manipulate both the full data set and the innovative subset
by creating tertiles and quartiles within the data based on innovation level and R&D expenditure
and then run regressions separately to compare sub-groups. In addition to the fixed effects
regressions with instrumental variables, we also run quantile regressions on the entire data set
methods, we are able to analyze the industry through many different lenses. We explain our
diverse findings in the following sections.
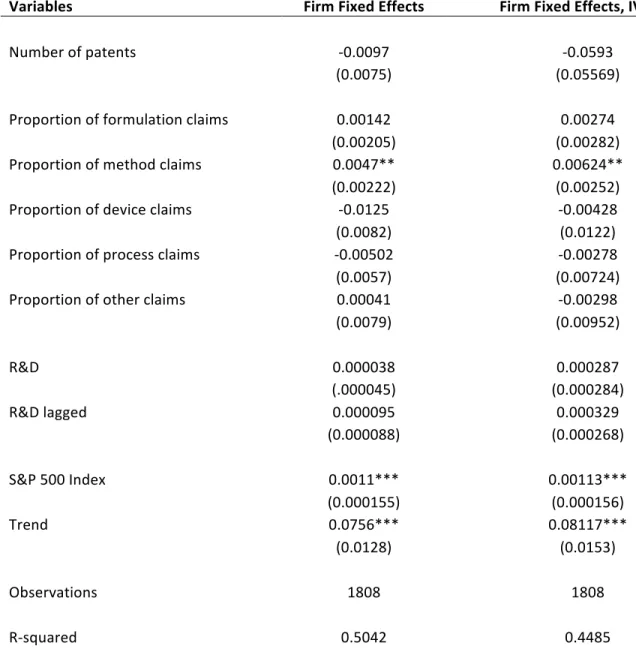
VII. Fixed Effects and Instrumental Variables Regression Results
In this section, we will explain our findings using the fixed effects and instrumental
variable approaches. Using our full data set, including consumer-based companies, we clearly
see that in both regressions with and without the four instruments, there is a statistically
significant relationship between method claims and market value (Table 1). Using only firm
fixed effects, we see that an increase in the proportion of method claims by 1 percent would
result in an increase in market value by 0.47 percent as compared to compound claims. (In all of our regressions and results tables we use compound claims as the base as it is the most easily
defined category of the six. Also, we hope to interpret our results in a way that allows us to
compare these forms of secondary innovation to primary innovation.) Using both firm fixed
effects and the four policy instruments, we see that an increase in the proportion of method
claims by 1 percent would result in an increase in market value by 0.624 percent as compared to
compound claims. (Overall, we find that employing instrumental variables do not drastically
change our results. However, they are included in all regressions in order to account for these
important policy changes). Looking at Table 1, we see that both of these findings are significant
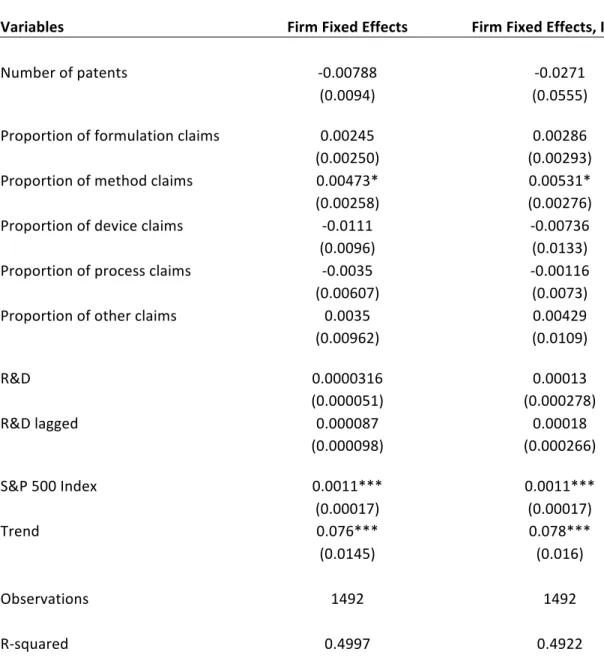
at a p<0.05 level. After creating a subset of the data and including only firms labeled as “Biotech
& Pharma,” we run the regressions again. As seen in Table 6, method claims now show
significance at a p<0.10 level. An increase in the proportion of method claims by 1 percent
would result in an increase in market value by 0.473 percent as compared to compound claims
to compound claims when using both firm fixed effects and the four policy instruments. Through
these results, we can conclude that a change in method claims would contribute more to a firm’s
market value than would a change in compound claims. This could be understood in the context
of recent shifts in patent portfolios as firms are now more often filing for claims on new “uses”
of already existing innovation rather than searching for new drugs.
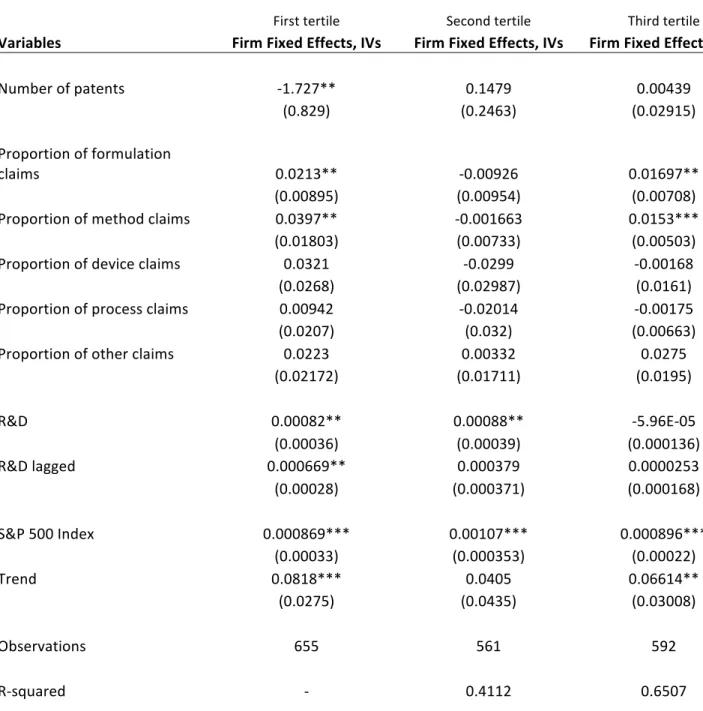
In order to examine the data further, we divide it into tertiles based on the maximum
amount of patents that a firm has ever held in a given year. We consider the first tertile the least
innovative group (has held less than 5 patents in a specific year). The second tertile consists of
firms that have held a maximum of anywhere in between 5 and 17 patents. The third tertile,
considered highly innovative, consists of firms that have held more than 17 patents in a given
year. Running fixed effects regressions with instrumental variables on these three categories of
firms allows us to get a better understanding of how the market value of highly innovative firms
may be affected differently by secondary innovation than the market value of lesser innovative
firms. Looking at Table 2, we see that both lesser innovative (first tertile) and highly innovative
firms (third tertile) show statistically significant results. In fact, we find that for lesser innovative
firms, specifically for those that belong in the first tertile, this effect is much stronger. We see
that an increase in either formulation or method claims of 1 percent would result in an increase
of market value by 2.13 or 3.97 percent as compared to compound claims, respectively. For
those firms in the second tertile, there is no significant relationship between claims and market
value.
It also seems as though the relationship between the number of patents and market value
is negative for less innovative firms at a p<0.05 level (Table 2). We see this result because our
Since we created the tertiles based on the number of patents, this negative relationship is
probably caused by those consumer-based companies. We explore this further by running the
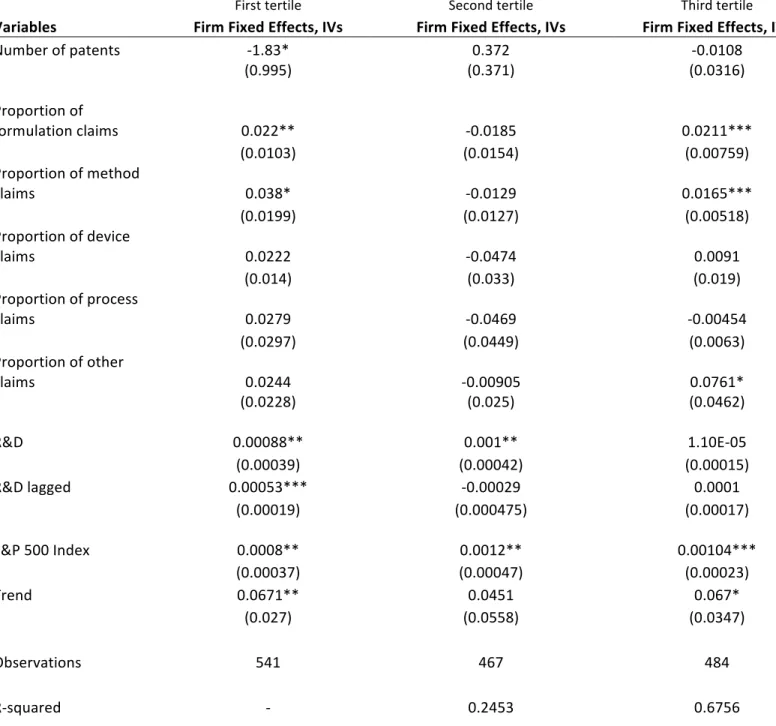
same regressions on our innovative subset. As shown in Table 7, we see similar results, as even
some innovative firms may hold a few patents and have high market capitalization. We also
notice stronger relationships between formulation or method claims and market value for lesser
innovative firms as compared to highly innovative firms. This implies that those firms at the
lower and the upper ends of the innovation spectrum have a statistically significant positive
relationship between secondary innovation and market value as compared to the relationship
between compound claims (primary innovation) and market value. The firms in the middle do
not show such a clear relationship.
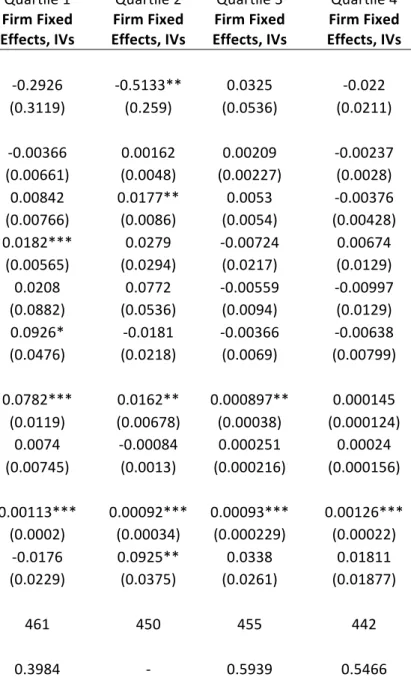
Other than organizing by the number of patents, we organize the firms by their R&D
expenditures. We divide the firms into quartiles, where quartile 1 refers to firms that spend less
than $16 million on Research and Development, quartile 2 refers to firms that spend between $16
and $68 million, quartile 3 refers to firms that spend between $68 and $577 million, and quartile
4 refers to firms that spend between $577 million and $6.86 billion. We run regressions with firm
fixed effects and instrumental variables I-IV on our full data set and show the results in Table 3.
Organizing our data in this way allows for another method of interpretation. We could base our
argument on different levels of R&D expenditures since the range of expenditure is quite large in
the industry. Looking at our results, however, we do not see many obvious or clear relationships
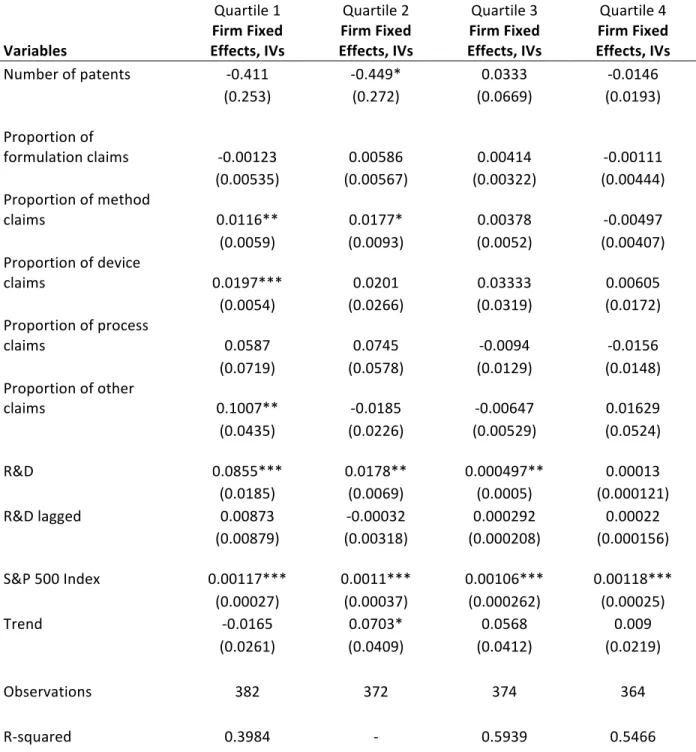
for secondary innovation. Firms that spend the least amount of money on R&D show a strong
relationship between device and method claims and market value (Table 8). As compared to a
traditional compound claim, an increase in method (or device) claims by 1 percent would result
some significance (p<0.10), arguing that a 1 percent increase in other claims would result in a 10
percent increase in market value, compared to compound claims. However, after looking at Data
Table 8, we can see that this large coefficient may be explained by the fact that “other” claims
for category 1 firms account for only 0.44 percent of their entire patent portfolios. Quartiles 2, 3,
and 4 (high-spenders) do not show statistically significant results for any of the types of claims.
This result follows along with the story of declining productivity in R&D spending. As firms
spend billions of dollars on research and development costs, productivity or efficiency may not
be as high as those firms that only invest a few million.
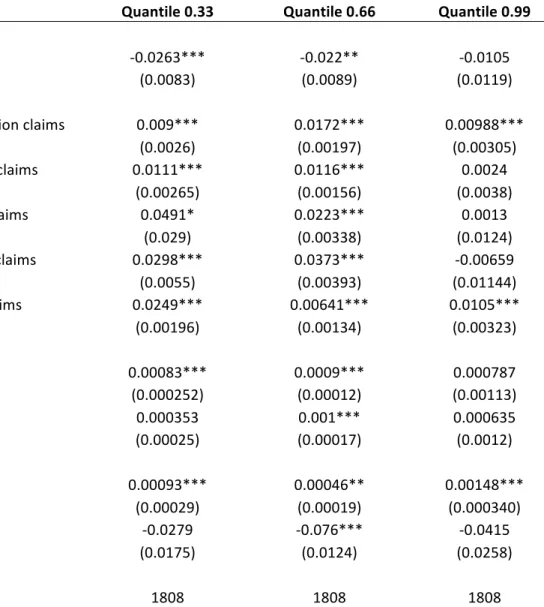
VIII. Quantile Regression Results
In this section, we analyze the results of our quantile regressions at multiple points within
our data (quantiles are based on our dependent variable, market capitalization). Looking at Table
4, we see many variables with statistically significant coefficients. Specifically, the regressions
for the 33rd quantile show very strong results, indicating that formulation, method, process, and
other claims all have a more positive impact on market value as compared to compound claims.
An increase in either formulation or method claims of 1 percent would result in an increase of
market value by 0.90 and 1.11 percent, respectively. We see that formulation claims have
approximately the same impact for firms at the 99th quantile and is also statistically significant at
a p<0.01 level. Overall, these results show that changes in the patent portfolio from compound
claims to the other 5 types of claims more strongly affect market value for firms at the 33rd
percentile than those at the 99th percentile. Although larger firms display a vague relationship for
most of the types of claims, formulation claims continue to be statistically significantly positive
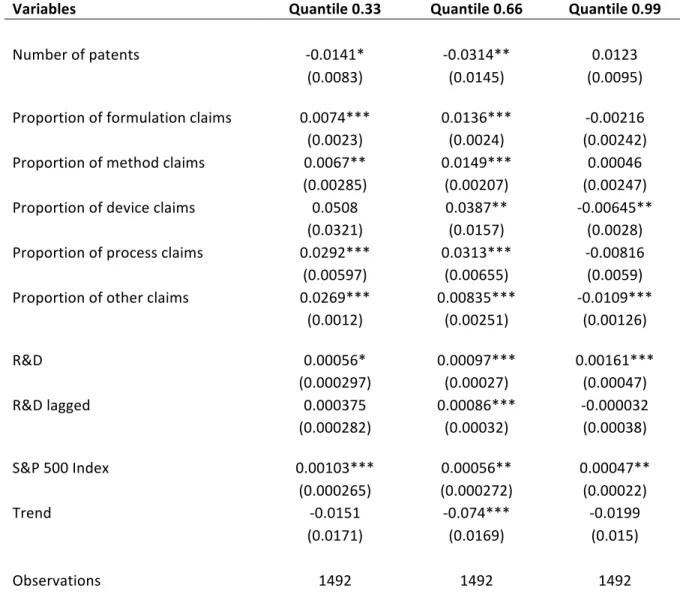
Once we remove non-innovative firms from our data and run quantile regressions again,
we see that most claims are statistically significant for firms at the 33rd and 66th percentiles, but
again remain unclear for firms at the 99th percentile. Looking at Table 9, we see that the
relationship is overall stronger for firms at the 66th percentile. Interestingly, firms at the 99th
percentile show a statistically significantly negative relationship between device and other claims
(as compared to compound claims). The statistically significant positive relationship between
formulation claims and market value disappears for firms at the 99th percentile once we eliminate
the non-innovative firms, implying that these five other types of claims are not statistically more
positive than compound claims in their relationships with firm market value. Smaller firms show
clearer and stronger results, as shown in Table 9.
In order to understand these results visually, we include Figures 8-10, where we can see
the 95 percent confidence interval and regression coefficient at each percentile. Interestingly,
formulation claims show an S-shaped trend in Figure 8, and the confidence interval seems to get
smaller, as well. The effect of an increase in formulation claims as compared to compound
claims is slightly higher for firms near the 60th percentile, and although firms near the upper
percentiles still exhibit a positive relationship (with a much tighter confidence interval), the
impact may not be as high as for those firms located just above the median. Figure 9 shows an
interesting trend for method claims as it displays an inverted-U. This graph shows that this
coefficient is higher for firms near the median rather than for firms near the lower and upper
percentiles. Lastly, Figure 10 shows a fascinating trend. The downward slope indicates that firms
in the upper percentiles of market capitalization values actually benefit the least from this
category of “other” claims. This trend, along with the trends in Figures 8 and 9, could be
values, an increase in method, formulation, or other claims by one percent (as opposed to
compound claims) may not be as effective in raising market capitalization. This could also be
due to the fact that these large firms may have diversified their portfolios and focus on much
more than simply pharmaceutical innovation.
IX. Conclusion
This study analyzes the impact of secondary innovation in the pharmaceutical industry on
firm market capitalization values. We use patent data collected from 1987-2010 in order to
examine changes in patenting behavior and patent portfolios, and then we try to measure the
impact of secondary innovation (a fairly new trend in the pharmaceutical industry) on market
value and compare it with the impact of primary innovation. While analyzing patent data, we
notice heterogeneity on several levels within the industry. Some firms have very few patents and
very high market capitalization, while some firms have over 100 patents yet very low market
capitalization. In order to account for heterogeneity within the industry and specifically analyze
the innovative sector, we drop non-innovative firms, use firm fixed effects to account for
differences between firms, and employ four instrumental variables that represent changes in the
incentives to patent.
Interestingly enough, we get many different results from analyzing the data through
multiple perspectives. Overall, we find that method and formulation claims do show significance
in their larger contribution to market value as compared to the contribution of compound claims.
This interesting finding can be explained by the recent surge in secondary innovation (refer to
Data Table 3). For both our full data set and our innovative subset, we find that increasing
to a one percent increase in compound claims. Once we break down our data into categories
based on levels of innovation, we find that this coefficient, for both method and formulation
claims, is much higher for lesser innovative firms (3.8 percent for method claims and 2.2 percent
for formulation claims). For highly innovative firms, the coefficients are 1.6 percent and 2.1
percent – indicating that positive impacts of changes in method claims are substantially stronger
for lesser innovative firms, and the impacts of changes in formulation claims are roughly the
same for both lesser and highly innovative firms. These results may be explained by the fact that
lesser innovative firms usually hold fewer method claims (refer to Data Table 6) than do highly
innovative firms – therefore, a one percent increase in method claims may seem to significantly
influence the market value of these firms.
Finally, we also see that firms that spend the least on research and development show
significant results for device and method claims (Tables 3 and 8). This story stems from the
previously identified issue of declining research productivity, and could potentially lead to an
area for further research. Furthermore, future studies could analyze patent citations in hopes of
better understanding firm behavior. By introducing the number and types of patent citations into
the model, we might be able to distinguish between firms that are simply innovating for the sake
of the patent/profitability and the firms that are innovating for the sake of research. An additional
unexplored topic relating to our paper could focus on answering questions about mergers and
acquisitions. In the past decade, mergers and acquisitions in the pharmaceutical industry have
been making headline news as multi-million dollar deals have begun to occur regularly. These
findings, along with our own, could lead to many useful policy implications relating to the
pharmaceutical industry and industrial organization. Based on our results that pharmaceutical
to primary innovation, perhaps the patenting system or related policies should be reorganized
again in order to boost incentives. Pushing firms to focus on primary innovation in order to find
Data Table 1: Variable Descriptions
Short Name Variable Name Variable Description
marketcap Market Capitalization Value The market capitalization value of each firm on the first day of the year in which stocks are trading. Market Capitalization equals the number of shares outstanding times the day average price of the stock.
nopatents Number of Patents The number of patents held by each firm in each year. If a patent expires in a given year, the patent count for the following year will not count it.
prop_claim_compound Proportion of compound claims Compound claims contain new compounds or compositions.
prop_claim_form Proportion of formulation claims Formulation claims contain new formulations of already existing compounds and deal with active and inactive ingredients in a drug.
prop_claim_method Proportion of method claims Method claims contain new methods of using a drug.
prop_claim_device Proportion of device claims Device claims contain new medical devices (from complicated devices used in surgery to small syringes).
prop_claim_process Proportion of process claims Process claims contain new processes for manufacturing a drug.
prop_claim_other Proportion of other claims Other claims contain: designs/sizing of drugs, improvement in devices, improvement in dosage form, creating substances that resemble human DNA so that it could be used for lab testing of other drugs, etc.
xrd R&D Expenditure R&D Expenditure is given for each firm in each year. Units: millions of dollars.
xrdlag1 R&D Expenditure lagged once R&D Expenditure from the previous year.
spindx S&P 500 Index The S&P 500 Index is a general average measure of the U.S. stock market.
trend Trend The number of years since the beginning of our data set.
PDUFA PDUFA2 URAA URAA2 FDMA_AIPA FDMA_AIPA2 FTC FTC2
Prescription Drug User Fee Act (1992)
Prescription Drug User Fee Act (1992)
Uruguay Rounds Agreement Act (1995)
Uruguay Rounds Agreement Act (1995)
Food and Drug Administration Modernization Act (1999) and American Investors Protection Act (1999)
Food and Drug Administration Modernization Act (1999) and American Investors Protection Act (1999)
Supreme Court Case: FTC v. Schering-Plough (2002)
Supreme Court Case: FTC v. Schering-Plough (2002)
IV: Years since Prescription Drug User Fee Act (1992).
IV: Binary indicator for Prescription Drug User Fee Act (1992).
IV: Years since Uruguay Rounds Agreement Act (1995).
IV: Binary indicator for Uruguay Rounds Agreement Act (1995).
IV: Years since Food and Drug Administration Modernization Act (1999) and American Investors Protection Act (1999).
IV: Binary indicator for Food and Drug Administration Modernization Act (1999) and American Investors Protection Act (1999).
IV: Years since Supreme Court Case: FTC v. Schering-Plough (2002).
Data Table 2: Firms in Data
Firm Name Industry Classification
AKORN INC Biotech & Pharma
GENZYME CORP Biotech & Pharma
AMAG PHARMACEUTICALS INC Biotech & Pharma
DURAMED PHARMACEUTICALS INC Biotech & Pharma
AGOURON PHARMACEUTICALS INC Biotech & Pharma
CELGENE CORP Biotech & Pharma
DENTSPLY PHARMACEUTICAL Medical Equipment & Devices
GE HEALTHCARE Medical Equipment & Devices
COLUMBIA LABORATORIES INC Biotech & Pharma
NOVEN THERAPEUTICS LLC Biotech & Pharma
MALLINCKRODT MEDICAL INC Biotech & Pharma
AMGEN INC Biotech & Pharma
WYETH AYERST LABORATORIES Biotech & Pharma
INTENDIS INC Health Care Facilities & Services
SAVIENT PHARMACEUTICALS INC Biotech & Pharma
PROCTER AND GAMBLE PHARMACEUTICALS INC SUB PROCTER
AND GAMBLE CO Biotech & Pharma
PHARMACIA CORP Biotech & Pharma
COLGATE PALMOLIVE Consumer Products
BRISTOL MYERS SQUIBB CO PHARMACEUTICAL RESEARCH
INSTITUTE Biotech & Pharma
ABBOTT PRODUCTS INC Medical Equipment & Devices
DOW PHARMACEUTICAL SCIENCES Biotech & Pharma
SCIOS INC Biotech & Pharma
PFIZER PHARMACEUTICALS LTD Biotech & Pharma
ORTHO MCNEIL JANSSEN PHARMACEUTICALS INC Biotech & Pharma
3M PHARMACEUTICALS INC Materials
MERCK SANTE SAS Biotech & Pharma
LEDERLE LABORATORIES DIV AMERICAN CYANAMID CO Materials
PARKE DAVIS DIV WARNER LAMBERT CO Biotech & Pharma
SCHERING PLOUGH CORP Biotech & Pharma
BAUSCH AND LOMB INC Medical Equipment & Devices
BAXTER HEALTHCARE CORP Medical Equipment & Devices
ELAN DRUG DELIVERY INC Biotech & Pharma
FISONS CORP Biotech & Pharma
GENENTECH INC Biotech & Pharma
AH ROBINS CO Medical Equipment & Devices
CYPRESS BIOSCIENCE INC Biotech & Pharma
FOREST LABORATORIES INC Biotech & Pharma
TYCO HEALTHCARE GROUP LP Medical Equipment & Devices
ELI LILLY CO Biotech & Pharma
MGI PHARMA INC Biotech & Pharma
PAR PHARMACEUTICAL INC Biotech & Pharma
PHARMOS CORP Biotech & Pharma
NOVO NORDISK INC Biotech & Pharma
ALZA CORP Biotech & Pharma
ALPHARMA US PHARMACEUTICALS DIVISION Biotech & Pharma
UDL LABORATORIES Medical Equipment & Devices
SB PHARMCO PUERTO RICO INC Biotech & Pharma
IVAX RESEARCH INC Biotech & Pharma
ALLERGAN Biotech & Pharma
SMITHKLINE BEECHAM CORP DBA GLAXOSMITHKLINE Biotech & Pharma
TEVA PARENTERAL MEDICINES INC Biotech & Pharma
GENSIA AUTOMEDICS INC Medical Equipment & Devices
MEDICIS PHARMACEUTICAL CORP Biotech & Pharma
CEPHALON INC Biotech & Pharma
MEDIMMUNE Biotech & Pharma
ALKERMES INC Biotech & Pharma
SEPRACOR INC Biotech & Pharma
GENTA INC Biotech & Pharma
PERRIGO NEW YORK INC Biotech & Pharma
AMYLIN PHARMACEUTICALS INC Biotech & Pharma
GILEAD SCIENCES INC Biotech & Pharma
DUSA PHARMACEUTICALS INC Biotech & Pharma
QUESTCOR PHARMACEUTICALS INC Biotech & Pharma
QLT INC Biotech & Pharma
ACTAVIS ELIZABETH LLC Biotech & Pharma
ASTRAZENECA LP Biotech & Pharma
BIOVAIL LABORATORIES INTERNATIONAL SRL Biotech & Pharma
VIVUS INC Biotech & Pharma
PHARMACIA AND UPJOHN CO Biotech & Pharma
CONNETICS CORP Biotech & Pharma
NYCOMED US INC Biotech & Pharma
MILLENNIUM PHARMACEUTICALS INC Biotech & Pharma
ANDRX LABS LLC Health Care Facilities & Services
SPECTRUM PHARMACEUTICALS INC Biotech & Pharma
FRESENIUS MEDICAL CARE NORTH AMERICA Health Care Facilities & Services
CUBIST PHARMACEUTICALS INC Biotech & Pharma
PERNIX THERAPEUTICS LLC Biotech & Pharma
WARNER CHILCOTT CO LLC Biotech & Pharma
DEPOMED INC Biotech & Pharma
SHIRE DEVELOPMENT INC Biotech & Pharma
SKYEPHARMA AG Health Care Facilities & Services
UNITED THERAPEUTICS CORP Biotech & Pharma
WOMEN FIRST HEALTHCARE INC Consumer Products
BIOMARIN PHARMACEUTICAL INC Biotech & Pharma
IMCOR PHARMACEUTICALS CO Medical Equipment & Devices
ALLOS THERAPEUTICS INC Biotech & Pharma
NOVARTIS CONSUMER HEALTH INC Biotech & Pharma
AXCAN PHARMA US INC Biotech & Pharma
INSMED INC Biotech & Pharma
EMD SERONO INC Biotech & Pharma
ENDO PHARMACEUTICALS INC Biotech & Pharma
INSPIRE PHARMACEUTICALS INC Biotech & Pharma
ISTA PHARMACEUTICALS Biotech & Pharma
THE MEDICINES CO Biotech & Pharma
ADOLOR CORP Biotech & Pharma
SALIX PHARMACEUTICALS INC Biotech & Pharma
ORION CORP Consumer Products
APP PHARMACEUTICALS LLC Health Care Facilities & Services
ALCON LABORATORIES INC Medical Equipment & Devices
SAVAGE LABORATORIES INC DIV ALTANA INC Biotech & Pharma
SANOFI AVENTIS US LLC Biotech & Pharma
NITROMED INC Biotech & Pharma
EYETECH INC Biotech & Pharma
ANESIVA INC Biotech & Pharma
GTX INC Biotech & Pharma
MEDICURE INTERNATIONAL INC Biotech & Pharma
TERCICA INC Biotech & Pharma
HOSPIRA INC Biotech & Pharma
CORNERSTONE BIOPHARMA INC Biotech & Pharma
AUXILIUM PHARMACEUTICALS Biotech & Pharma
SANTARUS INC Biotech & Pharma
THERAVANCE INC Biotech & Pharma
ACORDA THERAPEUTICS INC Biotech & Pharma
VANDA PHARMACEUTICALS INC Biotech & Pharma
NEUROGESX INC Biotech & Pharma
JAZZ PHARMACEUTICALS Biotech & Pharma
ULURU INC Biotech & Pharma
SUCAMPO PHARMACEUTICALS INC Biotech & Pharma
ABRAXIS BIOSCIENCE LLC Biotech & Pharma
Data Table 3: Patent portfolio of claims (average percentages) over time (Full Data)
Compound Formulation Method Device Process Other
Year=1987 15.6 14.8 12.4 0.38 1.02 0.23
Year=2000 10.8 22.8 21.3 1.83 2.11 0.56
Year=2010 5.8 38.9 40.2 4.72 5.7 0.95
Data Table 4: Patent portfolio of claims (average percentages) over time (Innovative Subset)
Compound Formulation Method Device Process Other
Year=1987 15.07 13.7 9.36 0.34 0.83 0.04
Year=2000 11.56 22.16 19.4 2.19 2.1 0.47
Year=2010 6.5 35.1 43 4.8 5.6 0.56
Data Table 5: Patent portfolio of claims (average percentages) by max number of patents category (Full Data)
Compound Formulation Method Device Process Other
Category 1 8.35 19 18.1 0.53 1 2
Category 2 7 26.6 27.2 1.7 2.8 0.62
Data Table 6: Patent portfolio of claims (average percentages) by max number of patents category (Innovative Subset)
Compound Formulation Method Device Process Other
Category 1 8.1 18.7 15.5 0.28 0.85 2.45
Category 2 7.7 25.6 28.6 2 3 0.84
Category 3 14.5 33.4 28.2 3.34 4.65 0.85
Data Table 7: Patent portfolio of claims (average percentages) by R&D category (Full Data)
Compound Formulation Method Device Process Other
Category 1 8.2 20.1 22 0.72 1.44 0.44
Category 2 5.2 20.2 22.4 1.24 2.45 0.45
Category 3 9.3 30.8 26.4 1.16 3.34 3.27
Category 4 15.6 35.5 25.4 3.88 4.33 1.7
Data Table 8: Patent portfolio of claims (average percentages) by R&D category (Innovative Subset)
Compound Formulation Method Device Process Other
Category 1 9.2 19.3 22.6 0.81 1.2 0.49
Category 2 5 19.3 20.6 1.42 2.55 0.57
Category 3 8.55 30 25.4 1.26 3.22 3.82
Table 1: Fixed Effects Regression with and without Instrumental Variables (Full Data)
Variables Firm Fixed Effects Firm Fixed Effects, IVs I-‐IV
Number of patents -‐0.0097 -‐0.0593
(0.0075) (0.05569)
Proportion of formulation claims 0.00142 0.00274
(0.00205) (0.00282)
Proportion of method claims 0.0047** 0.00624**
(0.00222) (0.00252)
Proportion of device claims -‐0.0125 -‐0.00428
(0.0082) (0.0122)
Proportion of process claims -‐0.00502 -‐0.00278
(0.0057) (0.00724)
Proportion of other claims 0.00041 -‐0.00298
(0.0079) (0.00952)
R&D 0.000038 0.000287
(.000045) (0.000284)
R&D lagged 0.000095 0.000329
(0.000088) (0.000268)
S&P 500 Index 0.0011*** 0.00113***
(0.000155) (0.000156)
Trend 0.0756*** 0.08117***
(0.0128) (0.0153)
Observations 1808 1808
R-‐squared 0.5042 0.4485
Significantly different from zero at *90 percent confidence, **95 percent confidence, ***99 percent confidence.
Notes: This table provides firm fixed effects regression results with and without all four instrumental variables for the full data set. These variables are regressed on the log of market capitalization. Proportion of compound claims is left out since it is the base for this regression. Standard errors given in parenthesis are robust.
Table 2: Fixed Effects Regression with Instrumental Variables based on tertiles of the maximum of number of patents (Full Data)
First tertile Second tertile Third tertile
Variables Firm Fixed Effects, IVs Firm Fixed Effects, IVs Firm Fixed Effects, IVs
Number of patents -‐1.727** 0.1479 0.00439 (0.829) (0.2463) (0.02915)
Proportion of formulation
claims 0.0213** -‐0.00926 0.01697** (0.00895) (0.00954) (0.00708) Proportion of method claims 0.0397** -‐0.001663 0.0153***
(0.01803) (0.00733) (0.00503) Proportion of device claims 0.0321 -‐0.0299 -‐0.00168 (0.0268) (0.02987) (0.0161) Proportion of process claims 0.00942 -‐0.02014 -‐0.00175 (0.0207) (0.032) (0.00663) Proportion of other claims 0.0223 0.00332 0.0275
(0.02172) (0.01711) (0.0195)
R&D 0.00082** 0.00088** -‐5.96E-‐05 (0.00036) (0.00039) (0.000136) R&D lagged 0.000669** 0.000379 0.0000253 (0.00028) (0.000371) (0.000168)
S&P 500 Index 0.000869*** 0.00107*** 0.000896*** (0.00033) (0.000353) (0.00022)
Trend 0.0818*** 0.0405 0.06614**
(0.0275) (0.0435) (0.03008)
Observations 655 561 592
R-‐squared -‐ 0.4112 0.6507
Significantly different from zero at *90 percent confidence, **95 percent confidence, ***99 percent confidence.
Table 3: Fixed Effects Regression with Instrumental Variables based on quartiles of R&D expenditure (Full Data)
Quartile 1 Quartile 2 Quartile 3 Quartile 4
Variables Effects, IVs Firm Fixed Effects, IVs Firm Fixed Effects, IVs Firm Fixed Effects, IVs Firm Fixed
Number of patents -‐0.2926 -‐0.5133** 0.0325 -‐0.022 (0.3119) (0.259) (0.0536) (0.0211)
Proportion of formulation claims -‐0.00366 0.00162 0.00209 -‐0.00237 (0.00661) (0.0048) (0.00227) (0.0028) Proportion of method claims 0.00842 0.0177** 0.0053 -‐0.00376 (0.00766) (0.0086) (0.0054) (0.00428) Proportion of device claims 0.0182*** 0.0279 -‐0.00724 0.00674
(0.00565) (0.0294) (0.0217) (0.0129) Proportion of process claims 0.0208 0.0772 -‐0.00559 -‐0.00997 (0.0882) (0.0536) (0.0094) (0.0129) Proportion of other claims 0.0926* -‐0.0181 -‐0.00366 -‐0.00638 (0.0476) (0.0218) (0.0069) (0.00799)
R&D 0.0782*** 0.0162** 0.000897** 0.000145 (0.0119) (0.00678) (0.00038) (0.000124) R&D lagged 0.0074 -‐0.00084 0.000251 0.00024
(0.00745) (0.0013) (0.000216) (0.000156)
S&P 500 Index 0.00113*** 0.00092*** 0.00093*** 0.00126*** (0.0002) (0.00034) (0.000229) (0.00022) Trend -‐0.0176 0.0925** 0.0338 0.01811
(0.0229) (0.0375) (0.0261) (0.01877)
Observations 461 450 455 442
R-‐squared 0.3984 -‐ 0.5939 0.5466
Significantly different from zero at *90 percent confidence, **95 percent confidence, ***99 percent confidence.
Notes: This table provides firm fixed effects regression results with all four instrumental variables for the full data set. The data set was divided into quartiles based on average R&D expenditure during this 23-‐year period. These variables are regressed on the log of market capitalization. Proportion of compound claims is left out since it is the base for this regression. Standard errors given in parenthesis are robust.
Table 4: Quantile Regressions (Full Data)
Variables Quantile 0.33 Quantile 0.66 Quantile 0.99
Number of patents -‐0.0263*** -‐0.022** -‐0.0105 (0.0083) (0.0089) (0.0119)
Proportion of formulation claims 0.009*** 0.0172*** 0.00988*** (0.0026) (0.00197) (0.00305) Proportion of method claims 0.0111*** 0.0116*** 0.0024
(0.00265) (0.00156) (0.0038) Proportion of device claims 0.0491* 0.0223*** 0.0013
(0.029) (0.00338) (0.0124) Proportion of process claims 0.0298*** 0.0373*** -‐0.00659 (0.0055) (0.00393) (0.01144) Proportion of other claims 0.0249*** 0.00641*** 0.0105***
(0.00196) (0.00134) (0.00323)
R&D 0.00083*** 0.0009*** 0.000787 (0.000252) (0.00012) (0.00113) R&D lagged 0.000353 0.001*** 0.000635 (0.00025) (0.00017) (0.0012)
S&P 500 Index 0.00093*** 0.00046** 0.00148*** (0.00029) (0.00019) (0.000340) Trend -‐0.0279 -‐0.076*** -‐0.0415
(0.0175) (0.0124) (0.0258)
Observations 1808 1808 1808
Significantly different from zero at *90 percent confidence, **95 percent confidence, ***99 percent confidence.
Notes: This table provides quantile regressions at the 33rd, 66th, and 99th quantiles (based on market capitalization)
Table 5: Instrumental Variable First Stage Least Squares (Innovative Subset)
Number of Patents Coefficients Robust F-‐value (1,1481) Proportion of formulation claims 0.0225*
(0.0117) Proportion of method claims 0.028** (0.013) Proportion of device claims 0.2001* (0.111) Proportion of process claims 0.109 (0.073) Proportion of other claims 0.0485 (0.044)
R&D 0.0049***
(0.00068) R&D lagged 0.0046*** (0.00083) S&P 500 Index -‐0.00134 (0.000986)
Trend -‐0.317**
(0.147)
FTC -‐0.412 0.0032
(0.379)
FTC2 0.095 3.39
(0.71)
FDMA_AIPA -‐0.193 1.93
(0.369)
FDMA_AIPA2 0.303 6.66
(0.435)
URAA 1.095*** 7.86
(0.35)
URAA2 -‐0.953* 0.497
(0.49)
PDUFA -‐0.131 10.37
(0.28)
PDUFA2 0.313 5.92
(0.298)
Significantly different from zero at *90 percent confidence, **95 percent confidence, ***99 percent confidence.
Table 6: Fixed Effects Regression with and without Instrumental Variables (Innovative Subset)
Variables Firm Fixed Effects Firm Fixed Effects, IVs I-‐IV
Number of patents -‐0.00788 -‐0.0271
(0.0094) (0.0555)
Proportion of formulation claims 0.00245 0.00286
(0.00250) (0.00293)
Proportion of method claims 0.00473* 0.00531*
(0.00258) (0.00276)
Proportion of device claims -‐0.0111 -‐0.00736
(0.0096) (0.0133)
Proportion of process claims -‐0.0035 -‐0.00116
(0.00607) (0.0073)
Proportion of other claims 0.0035 0.00429
(0.00962) (0.0109)
R&D 0.0000316 0.00013
(0.000051) (0.000278) R&D lagged 0.000087 0.00018
(0.000098) (0.000266)
S&P 500 Index 0.0011*** 0.0011***
(0.00017) (0.00017)
Trend 0.076*** 0.078***
(0.0145) (0.016)
Observations 1492 1492
R-‐squared 0.4997 0.4922
Significantly different from zero at *90 percent confidence, **95 percent confidence, ***99 percent confidence.
Notes: This table provides firm fixed effects regression results with and without all four instrumental variables for the innovative subset. These variables are regressed on the log of market capitalization. Proportion of compound claims is left out since it is the base for this regression. Standard errors given in parenthesis are robust.
Table 7: Fixed Effects Regression with Instrumental Variables based on tertiles of the maximum of number of patents (Innovative Subset)
First tertile Second tertile Third tertile
Variables Firm Fixed Effects, IVs Firm Fixed Effects, IVs Firm Fixed Effects, IVs Number of patents -‐1.83* 0.372 -‐0.0108
(0.995) (0.371) (0.0316)
Proportion of
formulation claims 0.022** -‐0.0185 0.0211***
(0.0103) (0.0154) (0.00759)
Proportion of method
claims 0.038* -‐0.0129 0.0165***
(0.0199) (0.0127) (0.00518)
Proportion of device
claims 0.0222 -‐0.0474 0.0091
(0.014) (0.033) (0.019)
Proportion of process
claims 0.0279 -‐0.0469 -‐0.00454
(0.0297) (0.0449) (0.0063)
Proportion of other
claims 0.0244 -‐0.00905 0.0761*
(0.0228) (0.025) (0.0462)
R&D 0.00088** 0.001** 1.10E-‐05
(0.00039) (0.00042) (0.00015)
R&D lagged 0.00053*** -‐0.00029 0.0001
(0.00019) (0.000475) (0.00017)
S&P 500 Index 0.0008** 0.0012** 0.00104***
(0.00037) (0.00047) (0.00023)
Trend 0.0671** 0.0451 0.067*
(0.027) (0.0558) (0.0347)
Observations 541 467 484
R-‐squared -‐ 0.2453 0.6756
Significantly different from zero at *90 percent confidence, **95 percent confidence, ***99 percent confidence. Notes: This table provides firm fixed effects regression results with all four instrumental variables for the
Table 8: Fixed Effects Regression with Instrumental Variables based on quartiles of R&D expenditure (Innovative Subsets)
Quartile 1 Quartile 2 Quartile 3 Quartile 4
Variables Effects, IVs Firm Fixed Effects, IVs Firm Fixed Effects, IVs Firm Fixed Effects, IVs Firm Fixed Number of patents -‐0.411 -‐0.449* 0.0333 -‐0.0146
(0.253) (0.272) (0.0669) (0.0193)
Proportion of
formulation claims -‐0.00123 0.00586 0.00414 -‐0.00111 (0.00535) (0.00567) (0.00322) (0.00444) Proportion of method
claims 0.0116** 0.0177* 0.00378 -‐0.00497 (0.0059) (0.0093) (0.0052) (0.00407) Proportion of device
claims 0.0197*** 0.0201 0.03333 0.00605 (0.0054) (0.0266) (0.0319) (0.0172) Proportion of process
claims 0.0587 0.0745 -‐0.0094 -‐0.0156 (0.0719) (0.0578) (0.0129) (0.0148) Proportion of other
claims 0.1007** -‐0.0185 -‐0.00647 0.01629 (0.0435) (0.0226) (0.00529) (0.0524)
R&D 0.0855*** 0.0178** 0.000497** 0.00013 (0.0185) (0.0069) (0.0005) (0.000121) R&D lagged 0.00873 -‐0.00032 0.000292 0.00022
(0.00879) (0.00318) (0.000208) (0.000156)
S&P 500 Index 0.00117*** 0.0011*** 0.00106*** 0.00118*** (0.00027) (0.00037) (0.000262) (0.00025) Trend -‐0.0165 0.0703* 0.0568 0.009
(0.0261) (0.0409) (0.0412) (0.0219)
Observations 382 372 374 364
R-‐squared 0.3984 -‐ 0.5939 0.5466
Significantly different from zero at *90 percent confidence, **95 percent confidence, ***99 percent confidence.