Abstract
Chemicals used as flavorings, such as diacetyl, cinnamaldehyde, benzaldehyde, and vanillin, are FDA approved products for ingestion, but are now being added into the liquid of e-cigarettes and have recognized associations with respiratory disease when inhaled.1 A common method used for detection and quantification of harmful carbonyl compounds involves
derivatization of the aldehyde or ketone in conjunction with chromatographic separation prior to mass analysis.2 Derivatization reactions have been integral for chemical analysis of molecules that do not readily ionize and thus are not detected by mass spectrometry (MS).3 Specific
derivatization reactions can be utilized to add a permanent charge to the analyte, thus improving MS limits of detection.4, 5 One example of analyte derivatization involves using Girard’s
reagents.6 Girard’s Reagent T (GirT) and Girard’s Reagent P (GirP) undergo a Schiff-base formation with a carbonyl compound and provide the analyte with a permanent, positive charge that increases ionization efficiency and sensitive detection by MS.7 Typically, derivatization reactions are run for hours at elevated temperatures to get efficient conversion to products.3 Thus, utilizing conventional derivatization and chromatographic techniques limits high throughput analyses.8 However, recently it has been demonstrated that reactions can be completed on-line on a microsecond timescale in a microdroplet generated through
Introduction
Chemicals used as flavorings in e-cigarettes, such as diacetyl, cinnamaldehyde,
benzaldehyde, and vanillin, have recognized associations with respiratory disease when inhaled. Diacetyl is associated with bronchiolitis obliterans, more commonly known as “popcorn lung”.10 Exposure to cinnamaldehyde has been shown to compromise the functionality of immune cells.11 Benzaldehyde has been found to have cytotoxic and apoptotic effects.1 Vanillin has led to altered airway epithelial response on a cellular level.12, 13
The rapid derivatization reaction of Girard’s reagents with carbonyl compounds (Scheme 1) has been utilized for direct qualitative and quantitative analysis of these harmful carbonyl compounds commonly added as flavorings in various e-liquids. This method utilizing derivatization reactions with nESI-MS allows for high-throughput screening of harmful carbonyls in various e-liquids and rapid quantification of these flavorings to aid in assessing inhalation toxicology.
Scheme 1. Reaction schemes for derivatization reactions of carbonyl compounds with (a) Girard’s Reagent T and (b) Girard’s Reagent P
Nano-electrospray ionization is a smaller-scale version of regular electrospray ionization
(ESI), wherein an analyte is transferred from the solution phase to the gas phase. Charged
droplets are produced from the tip of the glass capillary and solvent evaporates until the particle
enters the gas phase.14 As the charged microdroplet moves along the voltage gradient toward the
entrance of the mass spectrometer, desolvation continues and the surface area to volume ratio
mixing of reagents, and an increased rate of product formation.Droplet sizes produced by nESI are smaller than those produced by ESI, offering an advantage of increased concentration of reagents in the microdroplet and thus increased mixing.9
The goal of this project is to study the kinetics of the derivatization reaction of carbonyl
compounds with GirT and GirP in the microdroplets generated by nESI. Theta capillaries
provide a way to perform these kinetic studies. A theta capillary is a borosilicate glass capillary
divided into two separate barrels by a central glass wall.9 This dividing wall prevents the mixing
of reagents in opposite barrels from occurring until electrospray when they meet in the Taylor
cone, rather than mixing prior to electrospray, as occurs in regular nanocapillaries. Thus, theta
capillaries allow for these derivatization reactions to be studied in the microdroplet.
Materials & Methods
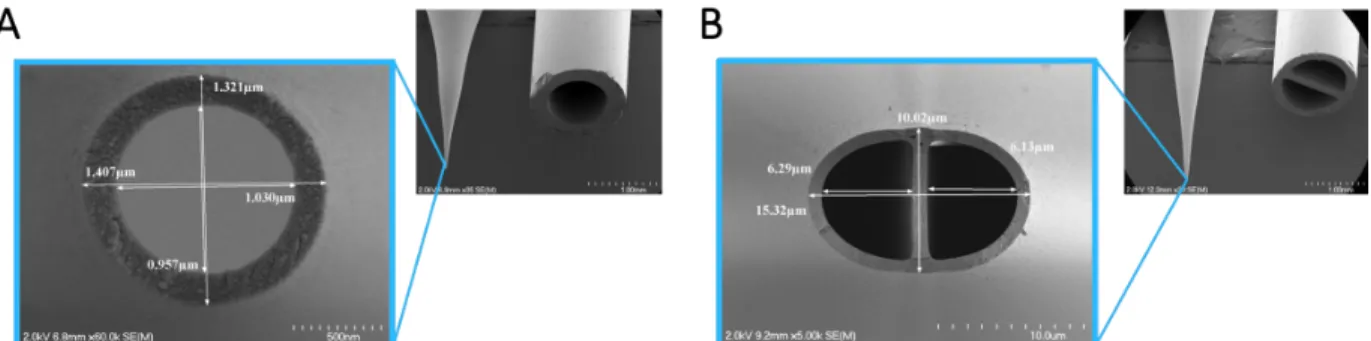
Capillary Pulling & SEM Images
Borosilicate glass nanocapillaries (Kimble Chase, 1.5-1.8 mm x 90 mm) and theta capillaries (Sutter Instruments, 1.5 mm x 100 mm) were pulled into tips using a model PC-10 Narishige Dual-Stage Glass Micropipette Puller (Heat settings: Steps 1 & 2: 24.8 ℃, No. 1 Heater: 60 ℃, No. 2 Heater: 45 ℃). Scanning electron microscopy (SEM) images of the pulled
capillaries were taken by UNC CHANL using a Hitachi S-4700 Cold Cathode Field Emission Scanning Electron Microscope to obtain dimensions of the pulled ends of both types of
Figure 1. Scanning electron microscopy (SEM) images of an overview of pulled and non-pulled ends of borosilicate glass (a) nanocapillary and (b) theta capillary
Sample Preparation
Cinnamaldehyde, benzaldehyde, and vanillin standards, as well as their respective internal standards (IS) of 2-methoxycinnamaldehyde, benzaldehyde-d5, and vanillin-(methoxy-d3), were obtained from Sigma-Aldrich. Methanol and Optima-grade water were from Fisher Scientific. GirT, GirP, 2,6-dichloroindophenol (DCIP), and L-Ascorbic acid (L-AA) were
obtained from Sigma-Aldrich. All solutions were prepared in nESI solvent, which was composed of methanol: water: acetic acid in a 70:30:1 ratio. Carbonyl standards, IS, GirT, and GirP were diluted separately in this solvent prior to being mixed. Three times excess of Girard’s reagents was used, since this ratio of Girard’s reagents to analyte was shown to provide high
derivatization efficiency.
Nano-Electrospray Ionization
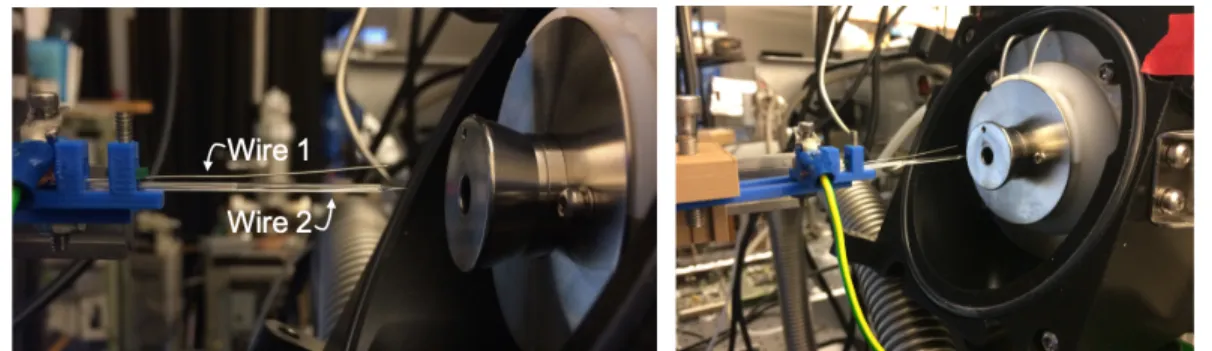
setups, capillaries were used as the sprayer for a custom-built nESI source. The capillaries were held at ground with 28-gauge stainless steel wire, secured with copper tape, and a negative voltage was applied to the MS inlet. A single wire was used for experiments using
nanocapillaries. Two wires were used for experiments using theta capillaries, unless otherwise stated. The decision to use two wires for theta capillaries was based upon previous literature.9
Figure 2. Instrumental setup of nESI with (a) nanocapillary and (b) theta capillary.
Figure 3. Instrumental setup of nESI with backing pressure
shield of the mass spectrometer. A Bruker HCTultra ion trap mass spectrometer was used for all experiments. Ions were detected using positive ion mode for all experiments.
Figure 4. Experimental setup of nESI without backing pressure that was used for both nanocapillaries (shown above) and theta capillaries (not shown above)
Signal Intensity vs. Distance
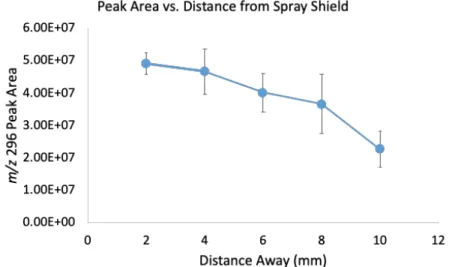
Experiments were conducted to optimize the distance of the glass capillary away from the spray shield. A solution of 2-methoxycinnamaldehyde (50 µM) and GirP (150 µM) was prepared and loaded into a nanocapillary. Calipers were used to measure the distance between the tip of the capillary and the front of the spray shield. nESI-MS was conducted at various distances ranging from 2 mm to 10 mm away, with MS measurements conducted every 2 mm. This process was repeated in triplicate, and average peak areas of m/z 296, derivatized 2-methoxycinnamaldehyde, were plotted (Figure 5).
Optimizing nESI Voltages
Voltages for nESI-MS of the carbonyl standards were optimized using nanocapillaries. A solution of cinnamaldehyde (20 µM) and GirP (90 µM) as well as a second solution of
were prepared. The capillary voltage was ramped from -1500 V to -5000 V in increments of 500 V and nESI-MS was conducted. Triplicate runs were conducted for the solutions containing IS. Average peak areas were found for the analyte and IS of interest in each run and plotted (Figure 6).
Characterizing Theta Capillaries
A series of experiments were conducted to characterize theta capillaries and validate the experimental setup (Figure 4). The first experiment was done to ensure that both of the wires gave the same signal response. A solution of benzaldehyde (20 µM), benzaldehyde-d5 (10 µM), and GirP (90 µM) was prepared. This pre-mixed solution was then added to a single barrel of a theta capillary. Wire 1 was placed in the barrel containing sample and nESI-MS was conducted to obtain a ratio of analyte: IS peak areas (Table 1). This process was repeated with Wire 1 in the empty barrel of the theta capillary. Then the same process was repeated for Wire 2, both in the sample barrel and empty barrel, and ratios were obtained (Table 1). These measurements were repeated with a solution containing GirT instead of GirP (Table 2). This experiment was run in triplicate.
Another experiment was conducted to ensure that both of the theta capillary barrels—one filled with sample and the other empty—gave the same signal response. A solution of
Comparing Nanocapillaries and Theta Capillaries
An experiment was conducted to compare the derivatization efficiency of nanocapillaries and theta capillaries. Vanillin-(methoxy-d3) was derivatized with GirP in bulk to be used as an IS. An IS was necessary to include to account for fluctuation in signal response, but the
derivatization of the IS itself was a factor that needed to be controlled. A solution of vanillin (20 µM), derivatized vanillin-(methoxy-d3) (10 µM), and GirP (90 µM) was prepared and injected into a nanocapillary. A solution of vanillin (20 µM) was injected into one barrel of a theta capillary. A solution of derivatized vanillin-(methoxy-d3) (10 µM) and GirP (90 µM) was injected into the other barrel of the theta capillary. The derivatized IS was added to the GirP solution rather than the analyte solution to prevent the remaining GirP from the derivatization reaction from mixing with the analyte before electrospray. Triplicate runs of nESI-MS were conducted to obtain peak area ratios of vanillin: vanillin-(methoxy-d3) parent ions and product ions using multiple reaction monitoring (MRM) (Figure 7).
Flow Rate Measurements
wires in regular nESI-MS with theta capillaries. The length of each flow rate run was determined by measuring the amount of time until the injected solvent had been sprayed completely and signal was lost. Flow rates were determined by dividing the volume of solvent injected by the length of time of the flow rate run (Table 4, 5). All flow rate measurements reported were conducted in triplicate.
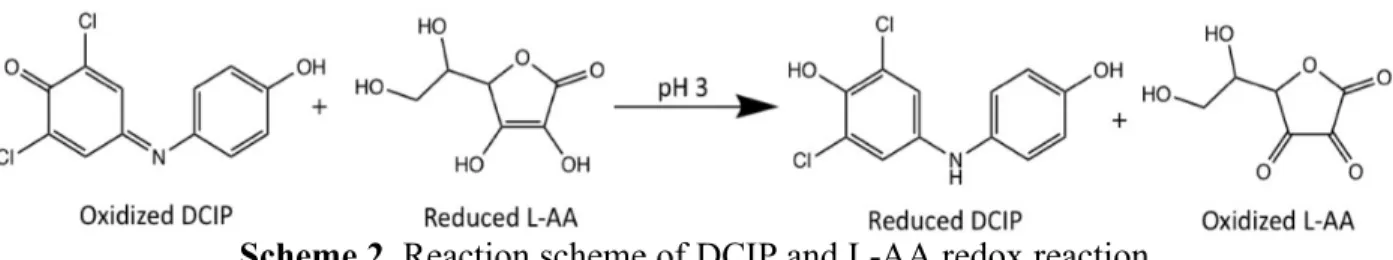
Microdroplet Lifetime Reaction
To study the reduction of 2,6-dichloroindophenol (DCIP) by L-Ascorbic acid (L-AA) in theta capillaries, oDCIP (1 µM) and L-AA (100 µM) were added to separate barrels of a theta capillary. nESI-MS was conducted and peak areas of both oxidized and reduced forms of DCIP and L-AA were found. The identity of each compound in its reduced and oxidized states was confirmed by MS/MS. The experiment was repeated in triplicate (Table 6).
Results & Discussion Signal Intensity vs. Distance
The optimal distance between the pulled end of the glass capillary and the front of the spray shield of the mass spectrometer seemed to be 2 mm based off the results of this experiment (Figure 5). When at a distance of 2 mm, the signal intensity was highest and there was the least amount of run-to-run variation over three runs. However, these results were not conclusive and a clear trend was not observed because the error bars at many of the distances overlapped (Figure 5). Additionally, it was challenging to be at a very close distance like 2 mm for all
it sprayed perpendicularly rather than straight-on, as in the nESI setup without backing pressure (Figure 2). It was found that 5 mm away was a more easily reproducible distance to set up, and it was important to stay the same distance away for all measurements, regardless of which nESI spray system was being utilized, in order to reduce confounding variables. Thus, for all future experiments, the pulled end of the glass capillary was kept at a distance approximately 5 mm from the front of the spray shield of the mass spectrometer.
Figure 5. Plot of derivatized 2-methoxycinnamaldehyde peak area versus distance of borosilicate glass capillary from spray shield of mass spectrometer
Optimizing nESI Voltages
Voltages for nESI-MS were optimized for cinnamaldehyde and vanillin (Figure 6).
The optimal voltage was determined to be -2500 V for both cinnamaldehyde and vanillin since it resulted in good signal and the most reproducible spray. For both of the plots with IS, the ratio of analyte: IS should be 2:1 due to the ratio of their concentrations in solution. However, these ratios were well below 2:1 for both carbonyls (Figure 6B, D). This ratio was further from 2:1 for cinnamaldehyde: 2-methoxycinnamaldehyde. This may have been due to some
differences in the chemical structures of the analyte and IS that led to differential derivatization or ionization. Another source of error may have arisen in sample preparation that became cumulative in serial dilutions.
Figure 6. Peak area of derivatized (a, b) cinnamaldehyde and (c, d) vanillin, (a, c) without internal standards and (b, d) with internal standards. (Note: Absolute values of voltages are
Characterizing Theta Capillaries
To ensure that both of the wires in the setup (Figure 4) gave the same response in signal, the two wires’ analyte: IS peak area ratios were compared for runs with each wire in the empty barrel and in the sample barrel of a theta capillary with GirP as the derivatizing reagent (Table 1). To compare the difference in these peak area ratios to determine if the two wires were statistically different, a one-way ANOVA was conducted with an α= 0.05. The p-values found were 0.24 and 0.07, both of which are greater than 0.05. Thus, it can be said with a 95%
confidence level that with GirP the two wires were not statistically different. The same analysis was conducted for GirT (Table 2). The p-values found were 0.43 and 0.10, both of which are greater than 0.05, so it can be said with a 95% confidence level that with GirT the two wires were not statistically different. Thus, the two wires were found to give a statistically similar response in signal.
Table 1. Ratios of analyte: IS peak areas with GirP for the wires in both the sample and empty barrels, along with their p-values
GirP
Analyte: IS (m/z 240: m/z 245) Peak Area Ratio Wire in Empty Barrel Wire in Sample Barrel
Wire 1 1.45 ± 0.08 1.59 ± 0.07
Wire 2 1.55 ± 0.11 1.44 ± 0.11
p-value 0.24 0.07
Table 2. Ratios of analyte: IS peak areas with GirT for the wires in both the sample and empty barrels, along with their p-values
GirT Analyte: IS (m/z 220: m/z 225) Peak Area Ratio Wire in Empty Barrel Wire in Sample Barrel
Wire 1 1.58 ± 0.09 1.86 ± 0.11
Wire 2 1.63 ± 0.03 1.66 ± 0.12
To ensure that both of the theta capillary barrels, whether they contained sample or were empty, gave the same response in signal, the average peak areas in the empty barrel and sample barrel were compared for both of the wires. To determine whether the response from the two barrels was statistically different, a one-way ANOVA was conducted with an α= 0.05. The resulting p-values were both equal to 0.96, which is greater than 0.05. Thus, it can be said with a 95% confidence level that the two barrels were not statistically different and gave a similar response in signal intensity.
Table 3. Average analyte peak areas with GirP for the sample and empty barrels with both wires, along with their p-values
Average Peak Area (m/z 296) (x107)
Wire 1 Wire 2
Empty Barrel 2.44 ± 0.17 1.21 ± 0.76 Sample Barrel 2.41 ± 0.86 1.18 ± 0.51
p-value 0.96 0.96
Comparing Nanocapillaries and Theta Capillaries
ratio of analyte: IS for nanocapillaries did not change much from the parent ion to product ion ratio. However, the standard deviation did increase for the product ion ratio for nanocapillaries (Figure 7B).
Figure 7. Plots of Analyte: IS peak area ratios of (a) parent ions and (b) product ions for nanocapillaries and theta capillaries
Mixing Time in the Taylor Cone
Mixing time of reactants in the Taylor cone was calculated using Equation 1.9
Table 4. Flow rates and Taylor cone mixing time for nanocapillaries at 0 psi and 8 psi backing pressure
Backing Pressure (psi) Flow Rate (nL/min) Mixing Time (µs)
0 9.67 ± 2.20 65.9 ± 15.8
8 15.35 ± 2.89 41.5 ± 8.1
Table 5. Flow rates and Taylor cone mixing time for both barrels of theta capillaries Theta Barrel Flow Rate (nL/min) Mixing Time (µs)
Barrel 1 58.99 ± 11.94 144.3 ± 36.6
Barrel 2 55.90 ± 12.09 152.3 ± 42.0
The mixing time in the Taylor cone for nanocapillaries was determined to be 65.9 ± 15.8 µs with 0 psi backing pressure and 41.52 ± 8.11 µs with 8 psi backing pressure. This made sense, as adding a backing pressure was expected to speed up the flow rate and thus decrease the
amount of time for mixing within the Taylor cone. The mixing times found for each barrel of theta capillaries with 0 psi backing pressure were 144.3 ± 36.6 and 152.3 ± 42.0, which were noticeably higher than those of nanocapillaries. The increased flow rates found with theta capillaries and the difference in O.D. dimensions between nanocapillaries and theta capillaries account for this difference in Taylor cone mixing time.
Microdroplet Lifetime
Scheme 2. Reaction scheme of DCIP and L-AA redox reaction
When L-AA is present in excess, the reaction follows pseudo-first order kinetics.9, 15 The integrated rate law for this reaction is shown in Equation 2, where kf is the forward rate
constant15 (s-1), t is the time of the reaction, [oDCIP]o is the initial concentration of oxidized DCIP, and [oDCIP]t is the amount of oxidized DCIP at time t.
To calculate [oDCIP]t, the abundances of oxidized and reduced DCIP were used in Equation 3, where AoDCIP is the abundance of oxidized DCIP, ArDCIP is the abundance of reduced DCIP, and iDCIP is the relative ionization efficiency of oDCIP relative to rDCIP.
The microdroplet lifetime was calculated by combining Equations 2 and 3 into Equation 4 (Table 6).
Table 6. Experimentally determined ionization efficiency and the forward rate constant15 used to determine microdroplet lifetime
Thus, the mixing time in the microdroplet was determined to be 6.31 ± 0.88 µs (Table 6). This value was less than the Taylor cone mixing time calculated for both nanocapillaries and theta capillaries (Table 4, 5). Although there is a greater amount of time available for mixing of reagents within the Taylor cone, this does not necessarily correlate to reaction time. It is not certain whether the rate of product formation is greater in the Taylor cone or microdroplet.
Conclusions and Summary
In summary, an optimal distance and voltage were chosen for nESI-MS of carbonyl compounds. The nESI setup was validated by showing that there was not a statistically significant difference between the response of the two wires nor the two barrels of theta capillaries. The derivatization efficiency was studied for nanocapillaries and theta capillaries, and this experiment demonstrated that nanocapillaries provided much higher derivatization ratios for analytes when compared to theta capillaries.
Flow rate measurements were conducted to calculate the mixing time of reagents in the Taylor cone during electrospray. The reduction of 2,6-dichloroindophenol by L-Ascorbic acid in theta capillaries was used determine microdroplet lifetime. The mixing time in the Taylor cone was found to be greater than the mixing time in the microdroplet.
From these results, it is clear that the reaction of Girard’s reagents with carbonyl
compounds in-situ occurs on a microsecond timescale within the Taylor cone and microdroplet.
Acknowledgements
Glish for imparting his knowledge and expertise throughout this project. I would like to thank Tavleen Kochar for mentoring me throughout my research and for teaching me a tremendous amount about mass spectrometry. I would like to thank James Keating for providing the nESI setup with backing pressure. I would also like to thank all members of the Glish Group for providing useful scientific discussion and advice that has helped me grow as a scientist.
References
1. Behar, R. Z.; Luo, W.; Lin, S. C.; Wang, Y.; Valle, J.; Pankow, J. F.; Talbot, P. Tob. Control 2016, 25 (Suppl 2), ii94-ii102.
2. Osório, V. M.; Cardeal, Z. L. J. Braz. Chem. Soc. 2013, 24 (11), 1711–1718.
3. Knapp, D. R. Handbook of Analytical Derivatization Reactions; Wiley: New York, 1979. 4. Suelter, C. H.; Watson, J. T. Biomedical applications of mass spectrometry; John Wiley
& Sons, 1990.
5. Santa, T.; Al-Dirbashi, O. Y.; Fukushima, T. Drug Discov Ther 2007, 1 (2), 108–118. 6. Wheeler, O. H. J. Chem. Educ. 1968, 45 (6), 435.
7. Vojinović, L. S.; Leovac, V. M.; Novaković, S. B.; Bogdanović, G. A.; Csanádi, J. J.; Češljević, V. I. Inorg. Chem. Commun. 2004, 7 (12), 1264–1268.
8. Naushad, M.; Khan, M. R. Ultra performance liquid chromatography mass spectrometry: evaluation and applications in food analysis.; Taylor and Francis, 2014.
9. Mortensen, D. N.; Williams, E. R. Anal. Chem. 2014, 86 (18), 9315–9321.
10.Popcorn Lung: A Dangerous Risk of Flavored E-Cigarettes | American Lung Association
http://www.lung.org/about-us/blog/2016/07/popcorn-lung-risk-ecigs.html?referrer=https://www.google.com/ (accessed Mar 17, 2019).
11.Clapp, P. W.; Pawlak, E. A.; Lackey, J. T.; Keating, J. E.; Reeber, S. L.; Glish, G. L.; Jaspers, I. Am. J. Physiol. - Lung Cell. Mol. Physiol. 2017, ajplung.00452.2016.
12.Tierney, P. A.; Karpinski, C. D.; Brown, J. E.; Luo, W.; Pankow, J. F. Tob. Control 2016, 25 (e1), e10-5.
13.Sherwood, C. L.; Boitano, S. Respir. Res. 2016, 17.
14.Banerjee, S.; Mazumdar, S. Int. J. Anal. Chem. 2012, 2012, 1–40.
15.Lee, J. K.; Kim, S.; Nam, H. G.; Zare, R. N. Proc. Natl. Acad. Sci. U. S. A. 2015, 112 (13), 3898–3903.