Sharif University of Technology
Scientia IranicaTransactions B: Mechanical Engineering http://scientiairanica.sharif.edu
Improving heat transfer in a triplex tube heat
exchanger containing phase-change materials by
modications of length and position of ns
M.M. Hosseini and A.B. Rahimi
Faculty of Engineering, Ferdowsi University of Mashhad, Mashhad, Iran.
Received 18 November 2017; received in revised form 18 August 2018; accepted 3 December 2018
KEYWORDS Phase change material; Triplex tube; Heat transfer enhancement; Fins arrangements.
Abstract.Heat thermal energy storage is a technique used to improve thermal eciency by reducing the discrepancy between energy demand and supply. Latent heat thermal energy storage as a kind of the thermal energy storage method has drawn considerable attention from researchers due to its high thermal energy density and a constant operating temperature. This study numerically investigated the melting process in a triplex tube heat exchanger containing Phase-Change Material (PCM) RT82. A two-dimensional numerical model was generated using the Ansys Fluent 16 software program to simulate the melting process. In this study, conduction and natural convection were considered. Certain arrangements of rectangular ns including lengths and positions were selected according to heat distribution, while the total area of ns was kept constant. This new strategy was done to improve heat transfer in PCM, which would result in decreasing its melting time. The selected optimized model in this article reduced the melting time to 28.4% in comparison with the model in [Mat, S., Al-Abidi, A.A., Sopian, K., et al. \Enhance eat transfer for PCM melting in triplex tube with internal-external ns", Energy Conversion and Management, 74, pp. 223{236 (2013)]. Numerical results were in agreement with the numerical and experimental results of the above-mentioned reference, thus verifying the validity of the obtained results.
© 2020 Sharif University of Technology. All rights reserved.
1. Introduction
Most clean kinds of energy are naturally unsteady and require facilities to store them. For instance, solar energy is an intermittent energy source that causes mismatch between energy supply and demand for solar thermal energy applications. In order to solve this *. Corresponding author.
E-mail addresses: mohammad [email protected] (M.M. Hosseini); [email protected] (A.B. Rahimi)
doi: 10.24200/sci.2018.5604.1369
issue, Latent Heat Thermal Energy Storage (LHTES) is employed to improve the eciency of solar energy systems. From an environmental viewpoint on a global scale, LHTES is acceptable and enhances the energy ef-ciency of the systems. LHTES provides high thermal energy density per unit volume/mass and has many applications in dierent engineering elds in broad temperature ranges. Mat et al. [1] numerically studied the melting process of RT82 as a phase-change material in a Triplex Tube Heat Exchanger (TTHX). Results showed that the application of a TTHX with internal-external ns reduced the melting time to 43.3% in comparison with the TTHX without ns. Thermal
Energy Storage (TES) using Phase Change Materials (PCMs) can store 5 to 14 times more energy than using sensible storage materials for the same volume [2]. Furthermore, latent heat storage has greater potential to store heat of fusion at a nearly constant temperature, which is consistent with the phase-change temperature [3]. Depending on the application and operating conditions, particularly operation in the temperature range, there are wide-ranging phase-change materials that have various melting temperatures. Absorption or release of energy during the phase transition from solid to liquid (and vice versa) is the foundation of PCM thermal energy storage. PCM thermal energy can be stored during the o-peak load period and, then, released during the peak period. LHTES applications are observed in various engineering elds including thermal storage of building structures [4,5], building equipment such as domestic hot water, heating, and cooling systems [6{8], electronic products [9,10], waste heat recovery [11], refrigeration, cold storage [12,13], and solar cookers [14,15]. Low thermal conductivity is the major weakness of phase-change materials that leads to a reduction in heat transfer and, consequently, prolonging the melting time. This can limit the use of these materials for TES. Several methods used for boosting heat transfer in phase-change materials have been studied in recent years. These methods include increasing the heat transfer surface area using nned tubes [16,17], improving thermal conductivity of the phase-change material by inserting metal foam into it [18], and dispersing nanoparticles with high thermal conductivity in PCMs [19,20]. The application of ns to enhance heat transfer in phase-change materials is a sensible and benecial method because of its simplicity, convenience, and low production cost. Various kinds of ns such as annular, tapered, pin, and rectangular are applied to PCMs. Recently, research studies have attempted to reduce the melting time so as to improve system performance. The eect of longitudinal ns in a double pipe heat exchanger in the charging process was studied experimentally and numerically by Hosseini et al. [21]. Their results maintained that an increase in ns' length led to a shorter amount of melting time and a deeper heat penetration. Al-Abidi et al. [22] experimentally studied melting and solidication of PCM in a TTHX with ns. Their results indicated that the Heat Transfer Fluid (HTF) inlet temperature had more eect on the PCM melting process than the HTF mass ow rate. Esapour et al. [23] investigated the eect of the number of inner tubes as a geometrical parameter during the charging process in a multi-tube heat exchanger. By increasing the number of inner tubes from 1 to 4 on the shell side of the multi-tube heat exchanger, the melting region expanded and its vortices strengthened, resulting in dominated convective heat transfer and, consequently, a higher melting rate. An
increase in the number of tubes leads to a 29% decrease in the melting time. Ho et al. [24] and Siao et al. [25] studied experimentally and numerically the transient TES characteristics across an air-saturated enclosure packed with microencapsulated phase-change material (MEPCM) particles. Moreover, Ho et al. [26] investigated numerically the melting process of a phase-change material placed within a vertical rectangular enclosure with a free-moving ceiling for dierent enclo-sure aspect ratios. They concluded that the eect of the Rayleigh number on the displacement of the mov-able ceiling and the average Nusselt number over the isothermally heated wall considerably reduced when the aspect ratio increased. Darzi et al. [27] numeri-cally studied the melting and solidication of a PCM within three various horizontal annulus congurations in a circular cylinder. Results showed that natural convection played an important role in the melting process. Furthermore, it was demonstrated that the melting rate in the bottom section of the tube was lower than that in the top section, and they concluded that the melting rate increased by using a vertical-oriented tube instead of a circular one. Mahdi and Nsofor [28] studied three heat transfer enhancement methods such as ns, nanoparticles, and a combination of both. It was found that the utilization of ns alone was superior to using either nanoparticles alone or a combination of ns and nanoparticles. Therefore, the use of longer ns with less thicknesses was advised so as to improve heat transfer in PCMs. Al-Abidi et al. [29] numerically investigated heat transfer enhancement methods during the melting time using internal and external ns in a TTHX. The n length, n thickness, number of ns, Stefan number, TTHX material, and the PCM unit geometry in the TTHX were studied in order to nd their eects on the melting time. The TTHX due to having a greater heat transfer surface than a double tube heat exchanger is relevant and is of higher eciency. Eslamnezhad and Rahimi [30] considered dierent n angles and the eect of eccentric tubes on heat transfer. Their best presented model, with no change in the total ns' surface area, decreased the melting time to 17.9% in comparison with the initial model in [1].
In this article, the melting process of PCMs inside a triplex heat exchanger using longitudinal ns of rectangular prole is studied. An attempt is made here to increase the rate of PCM melting in the model presented by Mat et al. [1] by changing the length and the location of the ns, while the total surface area of the ns is kept constant. This work is done based on the fact that melting occurs quicker if heat distributes uniformly throughout the cross-section area of the annulus. At the end, the optimized model, which is obtained through the modications of length and distance of ns, is presented.
Figure 1. Physical model of a Triplex Tube Heat Exchanger (TTHX) with 8 ns [1].
2. Numerical analysis 2.1. Physical model
The cross-section surface of a TTHX is depicted in Figure 1, as in [1]. The model has an inner tube radius of 25.4 mm (ri) and a thickness of 1.2 mm. In this
model, the radii of the middle tube (rm) and outer tube
(r0) are 75 and 100 mm, respectively, with a thickness
of 2 mm. It is preferred to use copper for pipes' material so as to assure high thermal conductivity. Eight ns with a length of 42 mm and a thickness of 1 mm are placed on middle and inner tubes according to this gure. The HTF (water) is placed inside the outer and the inner tubes, while the phase-change material, whose commercial name is RT82, is put in the middle tube. Physical and thermodynamic properties of the PCM (RT82) and cooper used in this study are shown in Table 1.
2.2. Governing equations
The uid motion and the temperature distribution within the annulus are described by the standard Navier-Stokes and energy equations. The ow is assumed to be laminar, incompressible, and transient with very low viscosity. Therefore, thermo-physical properties of the PCM including thermal capacity,
conductivity, and viscosity are supposed to be in-variant. The eect of natural convection based on the Boussinesq approximation is considered. Only density variation of the PCM related to force term in the momentum equation is considered and dened as follows:
=((T Tl
l) + 1); (1)
where lis the density of the PCM at the melting
tem-perature Tl, and is its thermal expansion coecient.
The continuity, momentum, and the thermal energy equations are respectively presented as follows: Continuity equation:
@t() + @i(ui) = 0: (2)
Momentum equation:
@t(ui) + @j(uiuj) = @jjui @ip + gi+ Si: (3)
Energy equation:
@t(h) + @t(H) + @i(uih) = @i(k@iT ); (4)
where is the density of the phase-change material, ui is the uid velocity, is the dynamic viscosity,
p is pressure, g is the gravity acceleration, k is the thermal conductivity, T is the uid temperature, and h is the sensible enthalpy of the PCM (RT82). Sensible enthalpy is dened as follows:
h = href + T
Z
Tref
cT: (5)
The total enthalpy is expressed as follows:
H = h + H; (6)
where href is the reference enthalpy at the reference
temperature (Tref = 273 K), C is the specic heat,
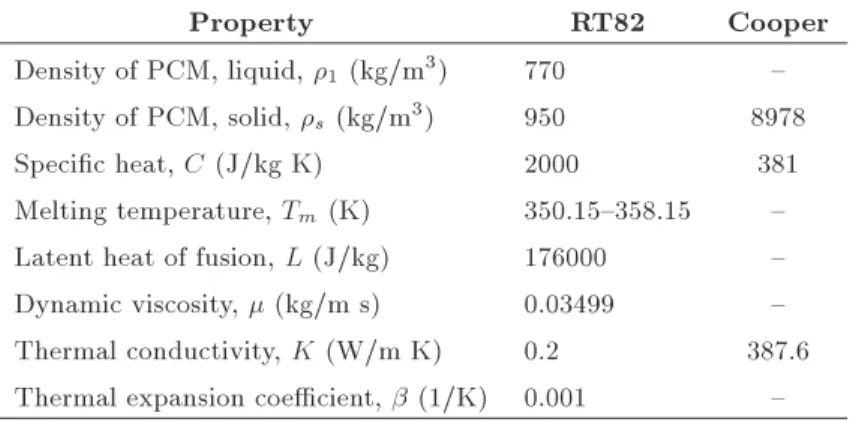
Table 1. Thermo-physical properties of phase-change material (RT82) and copper.
Property RT82 Cooper
Density of PCM, liquid, 1 (kg/m3) 770 { Density of PCM, solid, s (kg/m3) 950 8978
Specic heat, C (J/kg K) 2000 381
Melting temperature, Tm(K) 350.15{358.15 { Latent heat of fusion, L (J/kg) 176000 { Dynamic viscosity, (kg/m s) 0.03499 { Thermal conductivity, K (W/m K) 0.2 387.6 Thermal expansion coecient, (1/K) 0.001 {
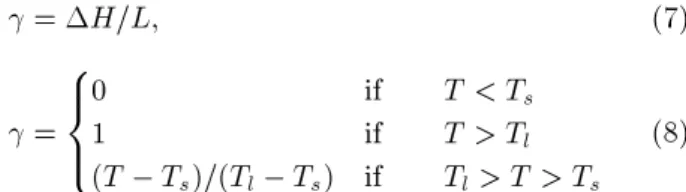
and H is the latent heat of PCM. The quantity is the liquid fraction that is generated during the melting process and can be written as follows:
= H=L; (7)
= 8 > < > :
0 if T < Ts
1 if T > Tl
(T Ts)=(Tl Ts) if Tl> T > Ts
(8) The phase-change process occurs when the temperature is Tl T Ts. The source term Si in momentum
equation, Eq. (3), is Darcy's Law damping term added to the momentum equation due to phase-change eect on convection and is dened as follows:
Si= C(1 )23u+ "i ; (9)
which is named \porosity function", as dened by Brent et al. [31]. This quantity enables the momentum equations to mimic Carman-Kozeny equations for ow in porous media. C is the mushy zone constant describing how steeply the velocity decreases to zero when the material solidies. A previous parametric study has discussed the inuence of C on the melting process of PCM by comparing the simulation results using three values, namely 105, 106, and 107, to the
experimental results, and has shown that, with a mushy zone constant of 106, the melt interface correlates well
with the experimental results up to an elapse time of 60 minutes. Although the solid PCM shape begins to square o near the nal stages of the simulation, the prediction of the total melting is reasonable and, here, the value of this constant is considered to be 106. In
addition, " is a small number (0.001) used in order to prevent division by zero, as introduced in [32].
Some simulation procedures at the solid-liquid interface to obtain the location of the melting front include transformed coordinate, deformed grid, en-thalpy method, heat capacity method, ultrafast laser heating, and Lattice Boltzman method, which have been employed by many researchers. The application of these methods, one way or another, has been employed in the studies of the references [33,34].
2.3. Initial and boundary conditions
The PCM initial temperature is 300.15 k (27C) and
is in the solid phase at this temperature. The temper-ature of the inner surface of the inner tube and that of the outer surface of the middle tube are supposed to be the same as the HTF, which is 363.15 k (90C). The
temperatures of the walls and the ns are not assumed constant and, consequently, walls and ns zones are solved too. In this study, heat transfer from both inner and outer tubes is considered. Therefore, the boundary conditions are expressed as follows:
r = 25:4 mm ! T = THT F; (10)
r = 77 mm ! T = THT F: (11)
2.4. Numerical simulation
In this study, the melting process was simulated us-ing ANSYS Fluent V16. The mesh was generated by the aid of GAMBIT software after drawing the selected geometry. The modeling was done based on the enthalpy-porosity technique and nite volume method, as described by Patankar [35]. The shape of the elements of the grid was chosen as triangular in GAMBIT software. Then, the two-dimensional model was selected. Moreover, a transient pressure-based model was used because the ow was of low velocity. The momentum and energy equations were discretized with second-order accuracy, and the PRESTO scheme was used for the pressure correction equation. The under- relaxation factors for pressure, velocity, energy, and volume fraction were selected as 0.4, 0.2, 1, and 0.9, respectively. The convergence criterion to terminate iteration was set to 10 3for continuity and momentum
equations and 10 6 for the energy equation.
2.5. Mesh independency and time step independency
The mesh independency and time-step independency have been considered to ensure the uniqueness of the results in this article. For mesh independency, the model [1] was simulated for a time step of 0.5 using dierent mesh sizes. The volume fraction is a measured parameter, which is shown in Table 2, at three dierent times. It is seen that 24,358 and 38,156 elements produce close values for volume fraction. Therefore, in order to reduce the burden of calculations, the number of elements was selected as 24,358. Time step independency was examined for dierent time steps including 0.1, 0.5, and 1 using 24,358 elements. These values are shown in Table 3. It can be seen that
Table 2. Liquid fraction values for grid size independency. Grid size Time (s)
500 1500 2500 13,344 0.2251 0.6324 0.9722 24,358 0.2291 0.6387 0.9789 38,156 0.2295 0.6388 0.9792 52,396 0.2398 0.6391 0.9792 Table 3. Time step independency. Time step(s) Time (s)
500 1500 2500 0.1 0.2314 0.6418 0.9795 0.5 0.2306 0.6387 0.9791 1 0.2269 0.6262 0.9728
time steps of 0.1 and 0.5 provide approximately close results. Therefore, the time step 0.5 is employed so as to decrease the load of calculations.
2.6. Validation
Some of the results of the model presented in [1] have been obtained again so as to validate the obtained numerical results. Streamline, isothermal contour for the TTHX with internal-external ns at a 30 min interval (Figure 14 of Ref. [1]) shown on the left-hand side of Figure 2 was reproduced, which is depicted on the right-hand side of this gure. The other comparison is indicated in Figures 3 and 4. As is observed in these gures, the obtained numerical results are in acceptable agreement with the numerical results of [1].
3. Results and discussions
3.1. Initial study for improving heat transfer As is shown in Figure 5, because of the distance existing between the ns in the TTHX in the model in Ref. [1], heat cannot quickly spread through the areas far from the ns and, thus, the phase-change material in these areas melts slower and remains in the solid phase for a longer time of period than that in the areas near the ns. Therefore, this structure of the ns is not suitable to distribute heat uniformly throughout the cross-section surface of the tube. To solve this deciency, the length of the ns is shortened
Figure 2. Comparison of streamline, isothermal contours for TTHX n in 30 minutes.
Figure 3. Comparison of the present numerical result and numerical results of [1].
Figure 4. Comparison of the present numerical result and numerical and experimental results of [1].
Figure 5. Melting fraction contours for dierent cases at three selected times.
and, instead, their numbers increase, while the total area of the ns remains unchanged. This is done by dividing the length of the ns by dierent factors, which are mentioned in Table 4. In each case, all the ns are situated at the same distance from each other. As is indicated in the contours of Figure 5, with a gradual reduction in the length of the ns and an increase in their numbers, heat is distributed more uniformly between the ns and the phase-change material than that in the referenced model. However, by continuing this work, the melting rate decreases due
Table 4. Successive divisions of the ns for selected division factors. Division
factor
Length of the ns (mm)
Number of the ns
Total melting time (min)
Model in [1] 1 42 8 47.5
Case 1 2 21 16 38.2
Case 2 3 14 24 39.4
Case 3 4 10.5 32 44.1
Case 4 5 8.4 40 51.6
Case 5 10 4.2 80 70.4
Figure 6. Comparison of liquid fraction between the dierent cases and the model in [1].
to the creation of a gap between the ns of the inner and the outer tubes. In Figure 6, liquid fraction curves for dierent cases of this model are indicated.
According to the results shown in Figure 5, the best heat distribution, which makes the best melting rate possible, is observed in Case 1 that consists of 16 ns with a length of 21 mm and placed at positions with a dierence of 22.5 degrees. This case is named Model #1. This case provides the shortest melting time among the rest of the cases and has a melting time of 38.2 minutes, which is shorter than the melting time of both of the models in [1,30]. Although the Case 2 yields approximately the same time for complete melting, its production is costlier due to having a greater number of ns. Therefore, in the following studies, only Model #1 will be optimized geometrically in order to increase its heat transfer and, thus, reduce its total melting time. It is important to mention that all the ns are perpendicular to the tubes throughout this study.
As is seen in Model #1 in Figure 5, the amount of phase-change materials in the solid phase in the lower
half of the tube is more than that in the upper half. The reason for this phenomenon is the buoyancy force, which causes the liquid material to move upward and the solid one to move downward. It is implied that the liquid part with a higher temperature and lower density moves up, and the solid part that has a lower temperature and higher density goes down. Hence, in this model, changing the position and length of the ns in a way that brings about a rise in the heat transfer in the lower half of the tube makes it possible to shorten the total melting time of the phase-change material and, thus, improve the eciency of the heat exchanger. Changing the arrangement of ns in this model causes solid materials to turn into liquid at the same rate and time both in the top and bottom half of the tube. Dierent variations in the length and position of the ns, which are two inuencing parameters for heat transfer, in the triplex heat exchanger will be introduced thoroughly in the following next sections.
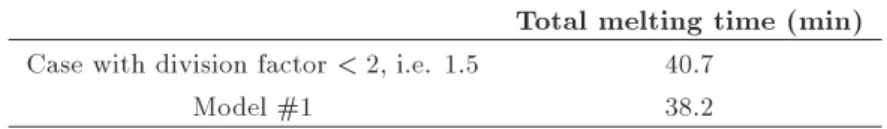
It should be mentioned that selecting any cases with a division factor less than 2 produces a model with a melting time longer than that of Model #1. For example, a division factor of 1.5 produces the following results in comparison with this model (Tables 5{6 and Figure 7).
3.2. The eect of dierent distances between ns on the melting rate
In this section, the distances between the ns are changed in order to improve the melting time of the phase-change material. This study starts with Model #1 that involves 16 ns, 8 of them on the outer tube and 8 on the inner tube, each at 45 away from each
other centrally, as shown in Figure 8. According to the upward movement of liquids with a higher temperature (less density) and the downward movement of solids with a lower temperature (more density), heat is
Table 5. Comparison of melting time for cases with division factor < 2, i.e. 1:5. Total melting time (min) Case with division factor < 2, i.e. 1.5 40.7
Table 6. Successive divisions of the ns for selected division factors < 2. Division
factor
Length of ns (mm)
Number of ns
Model in [1] 1 42 8
Case with division factor < 2, i.e. 1.5 1.5 28 12
Model #1 2 21 16
Figure 7. Melting fraction contours for dierent cases with division factor < 2 at three selected times.
Figure 8. The geometry of Model #1 and dierent distances between ns specied by angels.
trapped in the upper half of the tube, whereas a considerable quantity of solids remain in the lower half of the tube, causing an increase in the total melting time. Therefore, to raise the melting rate in the lower half of the tube, angular distances between ns of lower half of the tube (1; 2) gradually decrease and, instead,
are added to the angular distances between ns of the upper half of the tube (3; 4).
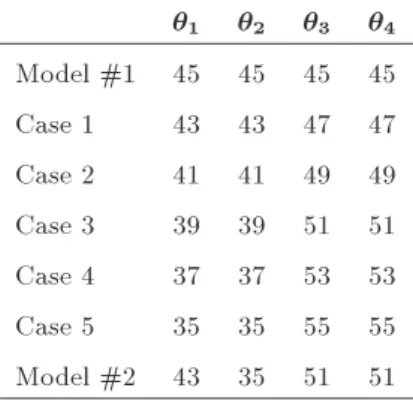
According to Table 7 and Figure 8, the central angles between the lower half ns of the tube decrease gradually by a step size of 2 and increase the same
Table 7. The values of the dierent angles between ns for showing distances.
1 2 3 4
Model #1 45 45 45 45 Case 1 43 43 47 47 Case 2 41 41 49 49 Case 3 39 39 51 51 Case 4 37 37 53 53 Case 5 35 35 55 55 Model #2 43 35 51 51
amount between the ns in the upper half section. As can be seen in Figure 9, this gradual change causes an increase in the melting rate in the lower half of the tube and, simultaneously, this quantity decreases in the upper half. This gradual change continues until the quantity of solids in the lower half section becomes negligible. Then, by comparing contours of Cases 1 to 5 with dierent angular distances between the ns, Model #2 that has the minimum total melting time among others is selected, which is 34.283 minutes. The optimization procedure is done by considering the point that all solid phase-change materials must become liquid at the same time in both of the top and bottom half of the tube. This optimized model is shown in Figure 9 as Model #2. In this model, heat is distributed as uniformly as possible, and its accumulation in the upper half of the tube decreases considerably.
3.3. The eect of dierent lengths of ns on the melting rate
In this section, the lengths of the ns are changed unequally in order to improve the melting time of the phase-change material. This study starts again with Model #1 that involves 16 ns of 21 millimeters each (see Figure 10). Further to that, in order to raise the melting time in the bottom half of the tube, the lengths of all ns in the upper half are shortened with the increment of 1 millimeters and are added to the lengths of the lower ns with the two ns situated in the horizontal state (L5) kept unchanged. These changes
Figure 9. Contours of melting fraction for dierent cases at three dierent times.
Figure 10. The geometry of ns' lengths for dierent cases.
As is shown in the contours of Figure 11, the gradual increase of the lengths of the ns in the lower half zone causes an increase in the heat transfer surface and, consequently, boosts the melting rate in the bottom half of the tube. According to this gure, the comparison of the contours for dierent lengths of the ns in the top and bottom half of the tube leads
Figure 11. Contours of melting fraction for dierent cases at three dierent times.
to a new model called Model #3. The optimization procedure is done by considering the point that all solid-phase change materials must become liquid at the same time in both top and bottom half of the tube. This optimized model is shown in Figure 11 as Model #3 with the melting time of 34.150 minutes. This optimized model is able to spread heat uniformly throughout the cross-section surface of the tube and provides a minimum total melting time.
3.4. Combination cases of ns arrangement to increase the melting rate
Combination cases of the lengths and distances of ns are considered in this section in order to further improve the melting time. Here, the combination of Model #1 and Model #2 is considered with the extreme cases of every 16 ns of Model #1 rstly placed on the outer tube (called Case A), as shown in Figure 12. As is seen from the contours in this gure, the amount of solid materials in the upper half of the tube is greater than that in the lower half section. Secondly, all of the ns in Model #1 are placed on the inner tube (called Case B) and the results are almost
Table 8. The values of ns' length for dierent cases.
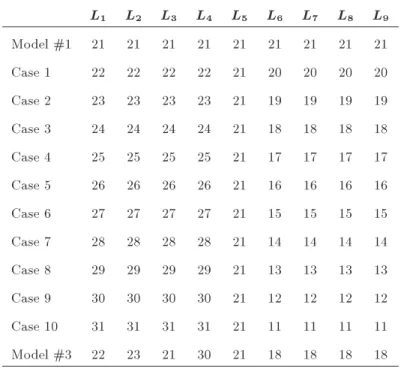
L1 L2 L3 L4 L5 L6 L7 L8 L9
Model #1 21 21 21 21 21 21 21 21 21
Case 1 22 22 22 22 21 20 20 20 20
Case 2 23 23 23 23 21 19 19 19 19
Case 3 24 24 24 24 21 18 18 18 18
Case 4 25 25 25 25 21 17 17 17 17
Case 5 26 26 26 26 21 16 16 16 16
Case 6 27 27 27 27 21 15 15 15 15
Case 7 28 28 28 28 21 14 14 14 14
Case 8 29 29 29 29 21 13 13 13 13
Case 9 30 30 30 30 21 12 12 12 12
Case 10 31 31 31 31 21 11 11 11 11
Model #3 22 23 21 30 21 18 18 18 18
Figure 12. Mixed model of Cases A and B.
inverse, meaning that more solid materials remain in the bottom half of the tube than those in the top half. Then, the comparison of the contours of these two models results in a new mixed model, which has 7 ns on the inner tube in the top half section and the other 7 ns in the outer tube with the two remaining ns placed in the horizontal situation. This model is shown in Figure 13 as the mixed model of Cases A and B. As can be seen in Figure 12, this model benets from both its predecessors and increases the melting rate throughout the cross-section surface of the tube, except some parts at the bottom of the tube. For raising the melting rate in these regions, a new modied model (Model #4) is presented. Because of the upward movement of the heat, lengths of ns in the top half of the tube increase
Figure 13. Contours of melting fraction for dierent cases at three dierent times.
from the uppermost n to the lower ones. Moreover, in the bottom half section, lengths of the ns decrease from the lowest n to the upper one. The nal lengths of ns for this model are presented in Table 9. This is reached by trying to convert all the solid materials in both of the top and bottom half of the tube into liquid simultaneously. The resulting model called Model #4 is shown in Figure 12 with the melting time of 34.017
Table 9. The values of ns' length for dierent cases.
L1 L2 L3 L4 L5 L6 L7 L8 L9
Mixed model of Cases A and B 21 21 21 21 21 21 21 21 21
Model #4 26 26 24 23 20 24 16 15 14
Table 10. Comparison of complete melting time for dierent models.
Complete melting time (min)
Model in [1] 47.533 Model in [30] 39.017
Model #2 34.283
Model #3 34.150
Model #4 34.017
Figure 14. Comparison of melting fraction curves for dierent models.
minutes, which is the shortest amount of time among all the models introduced in this study, as well as the two models in [1] and [30]. This is shown in Table 10 and Figure 14.
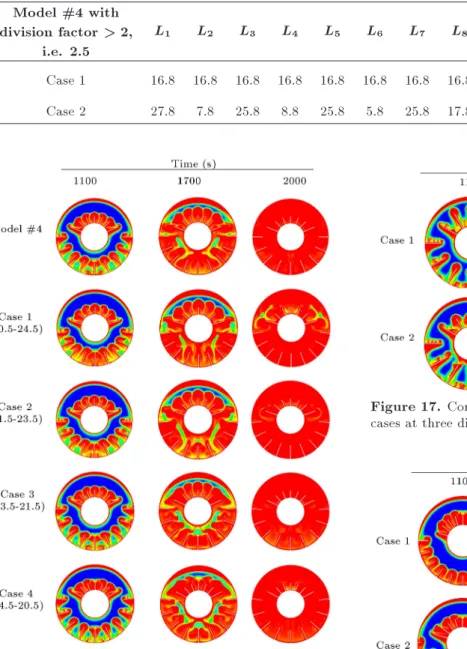
It should be mentioned that Model #4 is reached after considering the experience obtained in Sections 3.1{3.3 to reach Models #1, #2, and #3. The model investigates all possible kinds of changes in the lengths and distances (central angles) on the ns of these models. Some of the intermediate changes along with the obtained heat transfer and the corresponding melting time are shown in Figures 15{18 and Tables 11{13, respectively:
- Model #4 with central angles < 22:5 and/or > 22:5;
- Model #4 with division factor < 2, i.e. = 1:5;
- Model #4 with division factor > 2, i.e. = 2:5.
Table 11. The values of melting times for dierent cases. 1 2 Melting time (min) Model #4 22.5 22.5 34.017
Case 1 20.5 24.5 35.333
Case 2 21.5 23.5 34.583
Case 3 23.5 21.5 34.733
Case 4 24.5 20.5 34.816
Figure 15. The geometry of Model #4 and dierent distances between ns specied by angels.
4. Conclusions
Dierent models used to accelerate the melting process of RT82 as phase-change materials were investigated and introduced in this article. Three methods for optimizing the model in [1] were presented, resulting in three mixed models that provide considerably shorter melting time than the original model. For comparing the contours of melting fraction for the dierent cases and obtaining the optimized situation in each model, the ns' lengths and locations were selected in such a way that the melting of Phase Change Material (PCM) throughout the cross-section surface occurred uniformly and at the same time. Starting from the
Table 12. The values of ns' length for dierent cases. Model #4 with division
factor < 2, i.e. 1.5 L1 L2 L3 L4 L5 L6 L7
Melting time (min)
Case 1 28 28 28 28 28 28 28 35.65
Case 2 34 34 34 28 26 20 18 34.36
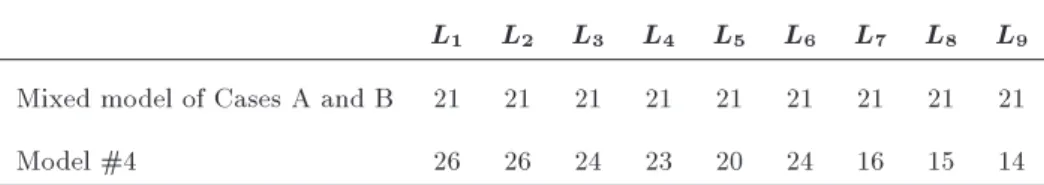
Table 13. The values of ns' length for dierent cases. Model #4 with
division factor > 2, i.e. 2.5
L1 L2 L3 L4 L5 L6 L7 L8 L9 L10 L11 Melting time
(min) Case 1 16.8 16.8 16.8 16.8 16.8 16.8 16.8 16.8 16.8 16.8 16.8 40.06 Case 2 27.8 7.8 25.8 8.8 25.8 5.8 25.8 17.8 14.8 14.8 13.8 34.665
Figure 16. Contours of melting fraction for dierent cases at three dierent times.
model in [1] and trying to improve the melting time of the PCM by equally optimizing the number and length of the ns, Model #1 was obtained. By completing the improvement process by optimizing the distances between the ns that are measured by the central angles, Model #2 was obtained. A combination of these two models as far as unequal n's lengths
Figure 17. Contours of melting fraction for dierent cases at three dierent times.
Figure 18. Contours of melting fraction for dierent cases at three dierent times.
and distances are concerned, considering all possible cases, enabled the introduction of Model #4 with the melting time of 34.017 minutes for PCM. This melting time achieved 28.4% and 12.8% improvement rates compared to the models in [1] and [30], respectively.
Nomenclature
Cp Specic heat of PCM (J/kg C)
G Gravity acceleration (m/s2)
H Sensible enthalpy (J/kg)
H Enthalpy (J/kg)
K Thermal conductivity (W/m K)
L Latent heat (W/m K)
P Pressure (Pa)
T Temperature (K)
ui Velocity component (m/s)
R Tube radius (m)
Si Momentum source term (Pa/m)
Ste Stefan number
C Mushy zone constant (kg/m3s)
Greek letters
Fluid density (kg/m3)
Liquid fraction coecient
Thermal expansion
Dynamic viscosity (kg/ms)
" Constant
Subscripts
i; j Components
int Initial
HT F Heat Transfer Fluid
m Melting
Ref Reference
s Solid
L Liquid
References
1 Mat, S., Al-Abidi, A.A., Sopian, K., et al. \Enhance heat transfer for PCM melting in triplex tube with internal-external ns", Energy Conversion and Man-agement, 74, pp. 223{236 (2013).
2 Ghoneim, A. \Comparison of theoretical models of phase-change and sensible heat storage for air and water-based solar heating systems", Solar Energy, 42, pp. 209{220 (1989).
3 Agyenim, F., Hewitt, N., Eames, P., et al. \A review of materials, heat transfer and phase change problem formulation for latent heat thermal energy storage sys-tems (LHTESS)", Renewable and Sustainable Energy Reviews, 14, pp. 615{628 (2010).
4 Caliskan, H., Dincer, I., and Hepbasli, A. \Thermo-dynamic analyses and assessments of various thermal energy storage systems for buildings", Energy Conver-sion and Management, 62, pp. 109{122 (2012).
5 Khudhair, A.M. and Farid, M.M. \A review on energy conservation in building applications with thermal storage by latent heat using phase change materials", Energy Conversion and Management, 45, pp. 263{275 (2004).
6 Mazman, M., Cabeza, L.F., Mehling, H., et al. \Uti-lization of phase change materials in solar domestic hot water systems", Renewable Energy, 34, pp. 1639{1643 (2009).
7 Zalba, B., Marn, J.M., Cabeza, L.F., et al. \Free-cooling of buildings with phase change materials", International Journal of Refrigeration, 27, pp. 839{ 849 (2004).
8 Benli, H. \Energetic performance analysis of a ground-source heat pump system with latent heat storage for a greenhouse heating", Energy Conversion and Management, 52, pp. 581{589 (2011).
9 Jaworski, M. \Thermal performance of heat spreader for electronics cooling with incorporated phase change material", Applied Thermal Engineering, 35, pp. 212{ 219 (2012).
10 Wang, Y.H. and Yang, Y.T. \Three-dimensional tran-sient cooling simulations of a portable electronic device using PCM (phase change materials) in multi-n heat sink", Energy, 36, pp. 5214{5224 (2011).
11 Pandiyarajan, V., Pandian, M.C., Malan, E., et al. \Experimental investigation on heat recovery from diesel engine exhaust using nned shell and tube heat exchanger and thermal storage system", Applied Energy, 88, pp. 77{87 (2011).
12 Tan, H., Li, C., and Li, Y. \Simulation research on PCM freezing process to recover and store the cold energy of cryogenic gas", International Journal of Thermal Sciences, 50, pp. 2220{2227 (2011).
13 Gin, B., Farid, M., and Bansal, P. \Eect of door opening and defrost cycle on a freezer with phase change panels", Energy Conversion and Management, 51, pp. 2698{2706 (2010).
14 Cakmak, G. and Yldz, C. \The drying kinetics of seeded grape in solar dryer with PCM-based solar integrated collector", Food and Bioproducts Processing, 89, pp. 103{108 (2011).
15 Buddhi, D., Sharma, S., and Sharma, A. \Thermal performance evaluation of a latent heat storage unit for late evening cooking in a solar cooker having three reectors", Energy Conversion and Management, 44, pp. 809{817 (2003).
16 Li, Z. and Wu, Z.G. \Analysis of HTFs, PCMs and ns eects on the thermal performance of shell-tube thermal energy storage units", Solar Energy, 122, pp. 382{395 (2015).
17 Agyenim, F. and Hewitt, N. \The development of a nned phase change material (PCM) storage system to take advantage of o-peak electricity tari for improvement in cost of heat pump operation", Energy and Buildings, 42, pp. 1552{1560 (2010).
18 Xiao, X., Zhang, P., and Li, M. \Preparation and thermal characterization of paran/metal foam com-posite phase change material", Applied Energy, 112, pp. 1357{1366 (2013).
19 Ali Rabienataj, D., Farhadi, M., Jourabian, M., et al. \Natural convection melting of NEPCM in a cavity with an obstacle using lattice Boltzmann method", Int. Journal of Numerical Methods for Heat & Fluid Flow, 24, pp. 221{236 (2013).
20 Fan, L. and Khodadadi, L.J. \An experimental in-vestigation of enhanced thermal conductivity and ex-pedited unidirectional freezing of cyclohexane-based nanoparticle suspensions utilized as nano-enhanced phase change materials (NePCM)", Int. Journal of Thermal Sciences, 62, pp. 120{126 (2012).
21 Hosseini, M., Ranjbar, A., Rahimi, M., et al. \Ex-perimental and numerical evaluation of longitudinally nned latent heat thermal storage systems", Energy and Buildings, 99, pp. 263{272 (2015).
22 Al-Abidi, A.A., Mat, S., Sopian, K., et al. \Experi-mental study of melting and solidication of PCM in a triplex tube heat exchanger with ns", Energy and Buildings, 68, pp. 33{41 (2014).
23 Esapour, M., Hosseini, M., Ranjbar, A., et al. \Phase change in multi-tube heat exchangers", Renewable Energy, 85, pp. 1017{1025 (2016).
24 Ho, C.R., Siao, Y.H., and Yan, W.M. \Thermal energy storage characteristics in an enclosure packed with MEPCM particles: An experimental and numerical study", Int. Journal of Heat and Mass Transfer, 73, pp. 88{96 (2014).
25 Siao, Y.H., Yan, W.M., and Lai, C.M. \Transient characteristics of thermal energy storage in an enclo-sure packed with MEPCM particles", Applied Thermal Engineering, 88, pp. 47{53 (2015).
26 Ho, C., Liu, K., and Yan, W.M. \Simulation on melting processes in a vertical rectangular enclosure with a free-moving ceiling", Int. Journal of Heat and Mass Transfer, 83, pp. 222{228 (2015).
27 Darzi, A.A.R., Jourabian, M., and Farhadi, M. \Melt-ing and solidication of PCM enhanced by radial con-ductive ns and nanoparticles in cylindrical annulus", Energy Conversion and Management, 118, pp. 253{ 263 (2016).
28 Mahdi, J.M. and Nsofor, E.C. \Melting enhancement in triplex-tube latent thermal energy storage system using nanoparticles-ns combination", Int. Journal of Heat and Mass Transfer, 109, pp. 417{427 (2017).
29 Al-Abidi, A.A., Mat, S., Sopian, K., et al. \Internal and external n heat transfer enhancement technique for latent heat thermal energy storage in triplex tube heat exchangers", Applied Thermal Engineering, 53, pp. 147{156 (2013).
30 Eslamnezhad, H. and Rahimi, A.B. \Enhance heat transfer for phase-change materials in triplex tube heat exchanger with selected arrangements of ns", Applied Thermal Engineering, 113, pp. 813{821 (2017).
31 Brent, A., Voller, V., and Reid, K. \Enthalpy-porosity technique for modeling convection-diusion phase change: application to the melting of a pure metal", Numerical Heat Transfer, Part A Applications, 13, pp. 297{318 (1988).
32 Ye, W.B., Zhu, D.S., and Wang, N. \Numerical simulation on phase-change thermal storage/release in a plate-n unit", Applied Thermal Engineering, 31, pp. 3871{3884 (2011).
33 Ghaebi, H., Bahadori, M.N., and Saidi, M.H. \Para-metric study of the pressure distribution in a conned aquifer employed for seasonal thermal energy storage", Scientia Iranica, 22(1), pp. 235{244 (2015).
34 Sakhani, H., Ahmari, M., and Azadehfar, E. \Nu-merical study of conjugate heat transfer in laminar and turbulent nanouid ow in double pipe heat exchangers", Scientia Iranica, 23(5), pp. 2211{2219 (2016).
35 Patankar, S., Numerical Heat Transfer and Fluid Flow, CRC press, London, U.K. (1980).
Biographies
Mohammad M. Hosseini was born in Mashhad, Iran, 1990. He received his BS degree in Mechanical Engineering from Birjand University in 2014 and his MS degree in Mechanical Engineering from Ferdowsi University of Mashhad, Mashhad, Iran in 2018. Asghar Baradaran Rahimi was born in Mashhad, Iran, 1951. He received his BS degree in Mechanical Engineering from Tehran Polytechnic, 1974 and a PhD degree in Mechanical Engineering from the University of Akron, Ohio, U.S.A., 1986. He has been a Profes-sor at the Department of Mechanical Engineering at Ferdowsi University of Mashhad since 2001. His re-search and teaching interests include heat transfer and uid dynamics, gas dynamics, continuum mechanics, applied mathematics, and singular perturbations.