DIETARY RESTRAINT SCALES AND THEIR RELATIONSHIP TO GENERALIZED EXECUTIVE FUNCTIONING
Andrew David Thompson, Jr.
Honors Essay Department of Nutrition University of North Carolina
2016
Approved:
______________________________ Advisor
ii ABSTRACT
Andrew David Thompson, Jr.; Dietary Restraint Scales and Their Relationship to Generalized Executive Functioning
(Under the direction of Kyle Burger)
iii
TABLE OF CONTENTS
LIST OF TABLES ... v
LIST OF FIGURES ... vi
LIST OF ABBREVIATIONS ... vii
CHAPTER 1: STUDY AIMS AND HYPOTHESES ... 1
CHAPTER 2: INTRODUCTION ... 3
2.1 Dietary Restraint ... 4
2.2 Impulsivity ... 5
2.3 Summary ... 6
CHAPTER 3: METHODS ... 7
3.1 Participants ... 7
3.2 Measures of Dietary Restraint ... 7
3.2.1 Dutch Restrained Eating Scale (DRES) ... 7
3.2.2. Three Factor Eating Questionnaire – Restraint Subscale (TFEQ-R) ... 8
3.3 Measures of Impulsivity ... 8
3.3.1 Explicit Impulsivity, Barratt Impulsiveness Scale (BIS-15) ... 8
3.3.2 Implicit Impulsivity ... 8
3.4 Body Mass ... 9
3.5 Statistical Analyses ... 9
iv
4.1 Participant Characteristics ... 11
4.2 Results of Statistical Analyses ... 11
CHAPTER 5: DISCUSSION ... 13
APPENDIX A: DATA TABLES... 18
APPENDIX B: SCATTERPLOTS ... 19
v
LIST OF TABLES
vi
LIST OF FIGURES
Figure 1 – Scatterplot showing association between DRES and TFEQ-R ...19 Figure 2 – Scatterplot showing association between DRES and commission error rate ...20
vii
LIST OF ABBREVIATIONS
BIS-15 Barratt Impulsiveness Scale BMI Body Mass Index
DRES Dutch Restrained Eating Scale
1
CHAPTER 1: STUDY AIMS AND HYPOTHESES
Obesity is a major issue in the United States due to its rising prevalence and association with numerous diseases (Calle & Thun, 2004). Dietary restraint, or the deliberate restriction of caloric intake, may reduce obesity by enabling weight loss or maintenance in spite of the
availability of pleasing foods (Lowe & Levine, 2005). However, many studies have failed to find significant correlations between self-report dietary restraint scales and caloric intake (Stice, Sysko, Roberto, & Allison, 2010). Individuals who are categorized as effective restrained eaters have been found to be less impulsive on a behavioral task (Leitch, Morgan, & Yeomans, 2013; Williamson et al., 2007). Generalized impulsivity, as measured by self-report and behavioral data, has been found to be associated with BMI (Babbs et al., 2013). Despite what is known about dietary restraint, data are mixed whether self-reported dietary restraint relates to decreased food intake. Furthermore, little is known about how restraint scores relate to facets of impulsivity and neural markers of executive functioning. Therefore we will examine the relationship among these measures in 20 healthy weight individuals.
2
3
CHAPTER 2: INTRODUCTION
Obesity has become a major issue in the United States due to its rising prevalence and association with numerous diseases, including cancers such as those of the colon and liver, type II diabetes mellitus, and cardiovascular disease (Calle & Thun, 2004). In theory, dietary restraint – deliberate restriction of caloric intake – can reduce or prevent obesity by allowing individuals to lose or maintain weight in a constant environment of appealing foods (Lowe & Levine, 2005). However, many studies have failed to find significant correlations between self-report dietary restraint scales and caloric intake (Stice et al., 2010). For example, a study which investigated caloric intake in women across four sessions did not find that differences in dietary restraint was related to caloric intake (Martin et al., 2005). It has been suggested that the chronic hunger implicit in sustaining a diet can promote episodes of binge eating, leading to weight gain
(Delinsky & Wilson, 2008; Polivy & Herman, 1985). This may lead to counterintuitive findings that individuals reporting high dietary restraint consume as many or more calories than others.
Individuals who are categorized as effective restrained eaters have been found to be less impulsive on a generalized behavioral task (Leitch et al., 2013; Williamson et al., 2007).
4
intake. Furthermore, little is known about how restraint scores relate to behavioral and self-reported facets of general impulsivity.
Some researchers have found that certain measures of impulsivity may be related to measures of dietary restraint (Guerrieri, Nederkoorn, Schrooten, Martijn, & Jansen, 2009). It has been found that individuals scoring higher on a self-report measure of dietary restraint were better able to successfully inhibit responses on an implicit impulsivity task (Leitch et al., 2013). Thus, the researchers suggest that successful restrained eaters tend to score low on impulsivity, whereas unsuccessful restrained eaters tend to score high on impulsivity (Leitch et al., 2013). It has been found that combinations of high self-reported dietary restraint and impulsivity are associated with episodes of binge eating (Racine, Culbert, Larson, & Klump, 2009). As previously discussed, binge eating may be a reaction to the chronic hunger associated with attempts to limit food intake. Individuals’ levels of impulsivity thus may be related to whether or not attempts to restrain eating will be successful.
2.1 Dietary Restraint
5
(Stice et al., 2010); as a result, dietary restraint has been associated with both weight gain and weight loss (Delinsky & Wilson, 2008; Stice et al., 2010).
It is worth noting that episodes of binge eating are, by definition, not in line with a restrained diet. Some have questioned the validity of scales used to measure dietary restraint because of the association between binge eating and high reported dietary restraint (e.g. Stice, Fisher, & Lowe, 2004). In clinical settings, practicing dietary restraint has been associated with weight loss, but not risk of future binge eating (Johnson, Pratt, & Wardle, 2012). Scales
attempting to measure dietary restraint have failed to accurately reflect caloric intake (Stice et al., 2010). However, some researchers assert that restraint scales intend to measure attempts at restricting intake, rather than the realization of these attempts in the form of reduced caloric intake (Larsen, van Strien, Eisinga, Herman, & Engels, 2007). We assert that a scale purporting to measure dietary restraint should measure the extent to which individuals actually restrict their intake, not the extent to which they try to restrict.
2.2 Impulsivity
Impulsivity is a trait that has been associated with obesity, and the presence of binge eating in particular (Leitch et al., 2013; Nederkoorn, Jansen, Mulkens, & Jansen, 2007).
Impulsivity, as measured by a behavioral stop signal task, has been associated with a decrease in effectiveness of obesity treatments in children (Nederkoorn et al., 2007); Nederkoorn et al. (2007) found more impulsive children in treatment for obesity have been found to lose less weight than less impulsive children. Further research has associated greater impulsivity, as measured by a behavioral go/no-go task, and reduced inhibitory activation in the frontal lobe, as measured by fMRI, with greater BMI (Batterink, Yokum, & Stice, 2010). That is, more
6
(2013) have found that impulsivity, as measured by behavioral tasks and self-report, is related to overeating. This provides a potential mechanism for obesity related to impulsivity.
2.3 Summary
An ability to refrain from indulging oneself is vital for the promotion of weight loss or prevention of excess weight gain in an environment with frequent access to highly-palatable foods. Given the epidemic status of obesity and its multitude of accompanying complications, understanding the factors that promote successful dietary restraint is a must. However, research has failed to support the notion that high reported dietary restraint is associated with a decrease in caloric intake. Rather, it has been reported that, in some individuals, greater dietary restraint is associated with greater intake. Some studies have found that successful dietary restraint is
associated with low impulsivity, while others have implicated an association between high impulsivity and high dietary restraint in the occurrence of episodes of binge eating. Still, the association between self-reported dietary restraint and intake is unclear. To clarify this relationship, here we administer two self-report measures of dietary restraint – the Dutch
Restrained Eating Scale and the Three Factor Eating Questionnaire-Restraint subscale and assess impulsivity using explicit and implicit measures – the Barratt Impulsiveness Scale and a Go/No Go task. We will examine the relationship between these measures of dietary restraint,
7
CHAPTER 3: METHODS 3.1 Participants
Data were collected from participants in a cross-sectional study involving the administration of dietary restraint and impulsivity measures and a behavioral task. Twenty healthy-weight, young adults (10 female, 10 male; x̅ age = 23.3 ± 3.4; x̅ BMI = 22.1 ± 1.9; 5% Hispanic, 10% Asian/Pacific Islanders, 85% European Americans) completed the protocol. Exclusion criteria were body mass index (BMI; kg/m2) <18.5 or >26.5, nicotine use > 6 times/week, psychoactive medications or drugs more than > 1 time/month, pregnancy, head injury with a loss of consciousness, significant cognitive impairment, major medical problems, and endorsement of disordered eating or current Axis I psychiatric disorder. Participants provided written informed consent; methods and procedures were approved by University of North Carolina at Chapel Hill’s Institutional Review Board.
3.2 Measures of Dietary Restraint
3.2.1 Dutch Restrained Eating Scale (DRES)
The Dutch Restrained Eating Scale (DRES; Van Strien et al., 1986) assesses dietary behaviors designed to produce weight loss and weight maintenance (sample item: Do you deliberately eat less in order not to become too heavy?). This scale has shown internal
8
3.2.2. Three Factor Eating Questionnaire – Restraint Subscale (TFEQ-R)
The TFEQ-restraint subscale (Stunkard & Messick, 1985) will be used to assess dietary behaviors designed to produce weight loss or maintenance, monitoring of body shape, and importance of thinness. This scale has shown internally consistent (M a = .89) and temporally reliability (1-month test-retest = .98) (French et al., 1994; Stunkard & Messick, 1985).
3.3 Measures of Impulsivity
3.3.1 Explicit Impulsivity, Barratt Impulsiveness Scale (BIS-15)
The Barratt Impulsiveness Scale assesses impulsive personality traits (Patton & Stanford, 1995). Participants are asked a series of fifteen questions regarding the frequency of impulsive behaviors with four options ranging from “rarely/never” to “almost always/always” (sample item: I act on the spur of the moment). Six items are reverse-scored. It has shown internal consistency (α = .79 - .83), 2-week test-retest reliability (r = .88), and discriminates between psychiatric patients and controls (Patton & Stanford, 1995; Suris et al., 2004). Individuals with inhibitory control deficits show elevated future weight gain (Francis & Susman, 2009;
Kishinevsky et al., 2012; Seeyave et al., 2009) and poorer response to weight loss treatment (Nederkoorn et al., 2007; Pauli-Pott, Albayrak, Hebebrand, & Pott, 2010). Lastly, recent data indicate that altered reward responses to food intake commonly associated with obesity may reflect greater impulsivity (Babbs et al., 2013).
3.3.2 Implicit Impulsivity
9
a keyboard press when shown the target logo, but withhold their responses during presentation of other logos. Participants performed the task twice, each time depicting one of the beverage logos as the ‘target’ logo at both the pre- and post-intervention assessments. The order of which logo was the ‘target’ logo was in a counterbalanced. Each task consisted of 48 trials. For each trial, a picture of the target logo (go trial, 75% occurrence) or a similar logos (no-go trial, 25%
occurrence) was presented for 500 ms. Trials were separated by a fixation cross that was presented at intervals ranging from 2-6 seconds. Stimuli were presented and reaction times, commission and omission errors were recorded using the Presentation software package (Version 9, Neurobehavioral Systems, Davis, CA). Commission errors refer to instances in which the participant responds with a keyboard press when a non-target stimulus is presented; higher rates are thought to indicate higher impulsivity. Omission errors are instances in which participants withhold their responses when the target stimulus is presented; higher rates are thought to indicate higher inhibition.
3.4 Body Mass
Body mass index (BMI; kg/m2) was used to reflect adiposity. After removal of shoes and coats, height was measured to the nearest millimeter using a stadiometer and weight was
assessed to the nearest 0.1 kg using a digital scale. Measures of height and weight were obtained pre-/post-intervention and at each of the 9 intervention assessments.
3.5 Statistical Analyses
Behavioral and perceptual measures were analyzed using Pearson’s correlations
10
correlated with dietary restraint, we performed analyses on the correlations between BMI and the two dietary restraint scales and between the dietary restraint scales and the measures of
11
CHAPTER 4: RESULTS 4.1 Participant Characteristics
Within our sample, we observed a mean BMI of 22.24 ± 1.63 kg/m2, with a range of 19.9 kg/m2 to 25.2 kg/m2. With the exception of one individual with a BMI of 25.2 kg/m2, all
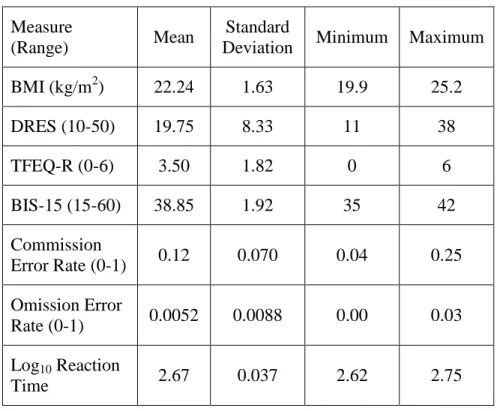
participants were found to be within the healthy-weight range of 18.5 to 24.9 kg/m2. We found a mean DRES score of 19.75 ± 8.33, within a possible range of 10 to 50. Participants scored within a range of 11 to 38. Higher scores on the DRES indicate higher levels of dietary restraint. The mean TFEQ-R score was found to be 3.50 ± 1.82, within a possible range of 0 to 6, with higher scores indicating higher dietary restraint. Participants’ scores ranged from 0 to 6. We observed a mean score on the BIS-15 of 38.85 ± 1.92 out of a possible range of 15 to 60, with higher scores indicating higher impulsivity. Individual scores on the BIS-15 fell between 35 and 42. The mean commission error rate observed was 0.0052 ± 0.0088. The mean omission error rate observed was 0.12 ± 0.07. The mean log-transformed reaction time observed was 2.67 ± 0.037; lower reaction times are thought to indicate higher impulsivity. A summary of these scores can be seen in Table 1.
4.2 Results of Statistical Analyses
12
differences by gender were observed in BMI, t(18) = 1.151, p = 0.265, BIS-15 score, t(18) = 0.578, p = 0.572, commission error rate, t(18) = 1.43, p = 0.168, omission error rate, t(18) = 1.152, p = 0.268, or log-transformed reaction time, t(18) = 0.105, p = 0.918.
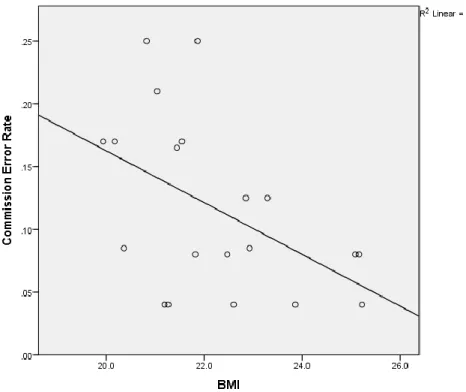
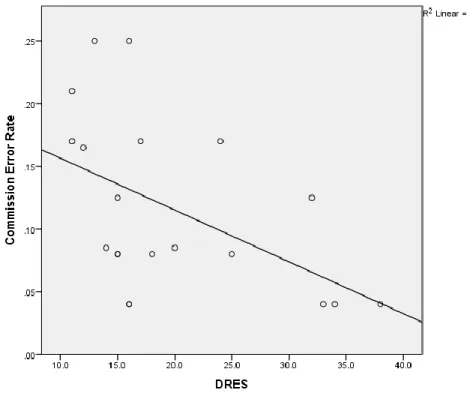
Pearson’s correlations were used to assess associations between all of the measures used. Significant correlations were observed between BMI and commission error rate, DRES score and TFEQ-R score, and DRES score and commission error rate. No other correlations were observed to be significant at the P < 0.05 level. A negative correlation was observed between BMI and commission error rate, r(18) = -0.482, p = 0.031, as seen in Figure 1. Figure 2 shows the negative correlation observed between DRES score and TFEQ-R score, r(18) = -0.789, p < 0.001. The correlation between DRES score and commission error rate was also negative, r(18) = -0.495, p = 0.027; this association is shown in Figure 3. All observed correlations may be seen in Table 2.
13
CHAPTER 5: DISCUSSION
The ability to maintain dietary restraint – the deliberate restriction of caloric intake – may be an important factor for reducing obesity rates in the United States. Actual dietary restraint, however, is a difficult concept to measure; individuals may alter caloric intake for a variety of reasons – intentional restraint, drug use, pregnancy, and disease are just a few of the potential causes of change in intake. Thus, self-report data must be used to determine whether any caloric restriction is the result of conscious action, or whether it is a side effect of some other condition. However, self-reported dietary restraint often fails to correspond with actual intake, even
predicting increased intake in some samples (Stice et al., 2004). It has been suggested that attempts at dietary restraint may result in chronic hunger, which promotes overeating and binge eating, thus leading to increased intake and weight gain (Polivy & Herman, 1985). Because dietary restraint scales attempt to measure the extent to which individuals limit their caloric intake, and reduced caloric intake should result in lower weight, we hypothesized that reported dietary restraint would be negatively associated with BMI. However, we did not find any association between either measure of dietary restraint and BMI, so this hypothesis was not supported.
14
interventions (Nederkoorn et al., 2007), while low impulsivity has been found to predict more successful dietary restraint (Williamson et al., 2007). If dietary restraint scales represent actual caloric restriction, it would be expected that those scoring high on these scales would score low on impulsivity. Thus, we hypothesized that dietary restraint, as measured by the DRES and TFEQ-R, would be negatively correlated with impulsivity, as measured by the BIS-15 and a Go/No-Go task. This hypothesis was partially supported, as individuals’ scores on the DRES were found to be negatively correlated with their commission error rates. That is, individuals who reported higher dietary restraint committed fewer commission errors, which is a behavioral measure of impulsivity. However, none of the other factors of the Go/No-Go task was associated with either measure of dietary restraint. Furthermore, no significant correlation was observed between the DRES and the BIS-15 or the TFEQ-R and any of the measures of impulsivity. Additionally, after controlling for gender and BMI, the correlation between the DRES and commission error rate was found to no longer be significant, suggesting that these factors may have influenced the observed association.
15
differences on dietary restraint scores nor weight status was responsible for the observed association. Interval validity and temporal reliability are high for both measures, so it is not expected that momentary states affected responses (Allison, Kalinsky, & Gorman, 1992; Bardone-Cone & Boyd, 2007). The measures may, however, assess somewhat different factors of dietary restraint, producing effects in this sample which are not observed in others.
Alternatively, there may have been errors in administering or scoring one of the scales.
The negative association between commission error rate and BMI was also unexpected. Commission error rate on the Go/No-Go task is thought to be reflective of impulsivity. However, impulsivity, as measured both by self-report measures and behavioral tasks including the Go/No-Go, has been associated with elevated BMI (Batterink et al., 2010). This effect was, however, attenuated after controlling for gender, although no significant difference in BMI or commission error rate was observed based on gender. This observed association may have been an effect of the characteristics of the sample used in this study which are not typical of other samples, such as the lean BMI range.
16
observed when individuals with higher BMIs are excluded. Furthermore, successful dietary restraint may not translate directly into reduced BMI. Individuals may deliberately limit their caloric intake below what they might otherwise consume without losing weight; this may depend on how much individuals would consume in an unrestrained condition and the extent to which they restrict their calories. Thus, the lean sample used may be a limitation of this study.
An additional limitation of this study is its small sample size of 20. Some correlations which were approaching significance may have been found to be significant with a greater sample size. Additionally, with a larger sample size, some findings may have remained
significant after controlling for other factors; the association between BMI and commission error rate was no longer significant after controlling for gender and the association between DRES score and commission error rate was no longer significant after controlling for gender and BMI. Controlling for additional factors in a statistical analysis can result in small changes in
correlation. With a small sample size, these changes have larger effects on significance.
Thus, we would suggest that future studies use both a larger sample size and an expanded BMI range. Relationships between BMI, dietary restraint, and impulsivity may be more
representative of the general population when overweight and obese individuals are not
excluded. Increasing the sample size could result in additional findings and reduce the effect of control variables which do not play a role in the relationship between other variables.
We would also suggest that future studies measure caloric intake. As has previously been mentioned, BMI may not directly reflect attempts at dietary restraint. Because dietary restraint is the deliberate restriction of caloric intake, the calories an individual consumes should be
17
Furthermore, if impulsivity is expected to interfere with attempts at dietary restraint, it may be useful to assess individuals’ ability to restrict intake when participants are enrolled in an intervention intended to reduce impulsivity. Mindfulness training may be of particular interest. Interventions intended to improve mindfulness have found reduced frequencies of impulsive behavior in ADHD, high-anxiety, and non-clinical populations (Haydicky, Wiener, Badali, Milligan, & Ducharme, 2012; Heeren, Van Broeck, & Philippot, 2009). Furthermore,
mindfulness interventions have been associated with decreases in food cravings, binge eating, emotional eating, and external eating (Alberts, Thewissen, & Raes, 2012; O’Reilly, Cook, Spruijt‐Metz, & Black, 2014). Reducing impulsivity in such a manner may enable researchers to determine the effect it has on dietary restraint within subjects.
18
APPENDIX A: DATA TABLES
Table 1. Descriptive statistics for measures used Measure
(Range) Mean
Standard
Deviation Minimum Maximum
BMI (kg/m2) 22.24 1.63 19.9 25.2
DRES (10-50) 19.75 8.33 11 38
TFEQ-R (0-6) 3.50 1.82 0 6
BIS-15 (15-60) 38.85 1.92 35 42
Commission
Error Rate (0-1) 0.12 0.070 0.04 0.25
Omission Error
Rate (0-1) 0.0052 0.0088 0.00 0.03
Log10 Reaction
Time 2.67 0.037 2.62 2.75
Table 2. Pearson’s correlations between measures used
(1) (2) (3) (4) (5) (6) (7)
(1) BMI -
(2) DRES 0.19 -
(3) TFEQ-R -0.09 -0.79* -
(4) BIS-15 -0.09 0.20 -0.22 -
(5) Commission Error Rate -0.48* -0.50* 0.18 -0.11 -
(6) Omission Error Rate -0.08 -0.25 0.32 0.14 0.24 -
19
APPENDIX B: SCATTERPLOTS
Figure 1. Scatterplot showing association between BMI and Commission Error Rate
20
21
REFERENCES
Alberts, H., Thewissen, R., & Raes, L. (2012). Dealing with problematic eating behaviour. The effects of a mindfulness-based intervention on eating behaviour, food cravings,
dichotomous thinking and body image concern. Appetite, 58(3), 847–851.
Allison, D. B., Kalinsky, L. B., & Gorman, B. S. (1992). A comparison of the psychometric properties of three measures of dietary restraint. Psychological Assessment, 4(3), 391. Babbs, R. K., Sun, X., Felsted, J., Chouinard-Decorte, F., Veldhuizen, M. G., & Small, D.
(2013). Decreased caudate response to milkshake is associated with higher body mass index and greater impulsivity. Physiology & Behavior.
Bardone-Cone, A. M., & Boyd, C. A. (2007). Psychometric Properties of Eating Disorder
Instruments in Black and White Young Women : Internal Consistency , Temporal Stability , and Validity, 19(3), 356–362. http://doi.org/10.1037/1040-3590.19.3.356
Batterink, L., Yokum, S., & Stice, E. (2010). Body mass correlates inversely with inhibitory control in response to food among adolescent girls: an fMRI study. Neuroimage, 52(4), 1696–1703. Retrieved from
http://www.ncbi.nlm.nih.gov/pmc/articles/PMC2910204/pdf/nihms208951.pdf Calle, E. E., & Thun, M. J. (2004). Obesity and cancer. Oncogene, 23(38), 6365–6378.
Delinsky, S. S., & Wilson, G. T. (2008). Weight gain, dietary restraint, and disordered eating in the freshman year of college. Eating Behaviors, 9(1), 82–90.
Francis, L. A., & Susman, E. J. (2009). Self-regulation and Rapid Weight Gain in Children From Age 3 to 12 Years. Archives of Pediatrics & Adolescent Medicine, 163(4), 297–302.
Retrieved from <Go to ISI>://WOS:000264924500002
French, S. A., Jeffery, R. W., & Wing, R. R. (1994). Food intake and physical activity: A comparison of three measures of dieting. Addictive Behaviors, 19(4), 401–409. Guerrieri, R., Nederkoorn, C., Schrooten, M., Martijn, C., & Jansen, A. (2009). Inducing
impulsivity leads high and low restrained eaters into overeating, whereas current dieters stick to their diet. Appetite, 53(1), 93–100.
Haydicky, J., Wiener, J., Badali, P., Milligan, K., & Ducharme, J. M. (2012). Evaluation of a mindfulness-based intervention for adolescents with learning disabilities and co-occurring ADHD and anxiety. Mindfulness, 3(2), 151–164.
Heeren, A., Van Broeck, N., & Philippot, P. (2009). The effects of mindfulness on executive processes and autobiographical memory specificity. Behaviour Research and Therapy, 47(5), 403–409.
22
Jasinska, A. J., Yasuda, M., Burant, C. F., Gregor, N., Khatri, S., Sweet, M., & Falk, E. B. (2012). Impulsivity and inhibitory control deficits are associated with unhealthy eating in young adults. Appetite, 59(3), 738–747.
Johnson, F., Pratt, M., & Wardle, J. (2012). Dietary restraint and self-regulation in eating
behavior. Int J Obes, 36(5), 665–674. Retrieved from http://dx.doi.org/10.1038/ijo.2011.156 Kishinevsky, F. I., Cox, J. E., Murdaugh, D. L., Stoeckel, L. E., Cook III, E. W., Weller, R. E.,
… Weller, R. E. (2012). fMRI reactivity on a delay discounting task predicts weight gain in obese women. Appetite, 58(2), 582–592. http://doi.org/10.1016/j.appet.2011.11.029
Laessle, R. G., Tuschl, R. J., Kotthaus, B. C., & Prike, K. M. (1989). A comparison of the validity of three scales for the assessment of dietary restraint. Journal of Abnormal Psychology, 98(4), 504.
Larsen, J. K., van Strien, T., Eisinga, R., Herman, C. P., & Engels, R. C. M. E. (2007). Dietary restraint: intention versus behavior to restrict food intake. Appetite, 49(1), 100–108. Leitch, M. A., Morgan, M. J., & Yeomans, M. R. (2013). Different subtypes of impulsivity
differentiate uncontrolled eating and dietary restraint. Appetite, 69, 54–63.
Lowe, M. R., & Levine, A. S. (2005). Eating motives and the controversy over dieting: eating less than needed versus less than wanted. Obesity Research, 13(5), 797–806.
http://doi.org/10.1038/oby.2005.90
Martin, C. K., Williamson, D. A., Geiselman, P. J., Walden, H., Smeets, M., Morales, S., & Redmann, S. (2005). Consistency of food intake over four eating sessions in the laboratory. Eating Behaviors, 6(4), 365–372.
Murphy, C. M., Stojek, M. K., & MacKillop, J. (2014). Interrelationships among impulsive personality traits, food addiction, and body mass index. Appetite, 73, 45–50.
Nederkoorn, C., Jansen, E., Mulkens, S., & Jansen, A. (2007). Impulsivity predicts treatment outcome in obese children. Behaviour Research and Therapy, 45(5), 1071–1075. Retrieved from http://www.sciencedirect.com/science/article/pii/S0005796706001173
Neumark-Sztainer, D., Wall, M., Guo, J., Story, M., Haines, J., & Eisenberg, M. (2006). Obesity, disordered eating, and eating disorders in a longitudinal study of adolescents: how do dieters fare 5 years later? Journal of the American Dietetic Association, 106(4), 559–568. O’Reilly, G. A., Cook, L., Spruijt‐Metz, D., & Black, D. S. (2014). Mindfulness‐based
interventions for obesity‐related eating behaviours: a literature review. Obesity Reviews, 15(6), 453–461.
Patton, J. H., & Stanford, M. S. (1995). Factor structure of the Barratt impulsiveness scale. Journal of Clinical Psychology, 51(6), 768–774.
23
control capacity and body weight in overweight and obese children and adolescents: dependence on age and inhibitory control component. Child Neuropsychology, 16(6), 592– 603.
Polivy, J., & Herman, C. P. (1985). Dieting and binging: A causal analysis. American Psychologist, 40(2), 193.
Racine, S. E., Culbert, K. M., Larson, C. L., & Klump, K. L. (2009). The possible influence of impulsivity and dietary restraint on associations between serotonin genes and binge eating. Journal of Psychiatric Research, 43(16), 1278–1286.
Seeyave, D. M., Coleman, S., Appugliese, D., Corwyn, R. F., Bradley, R. H., Davidson, N. S., … Lumeng, J. C. (2009). Ability to Delay Gratification at Age 4 Years and Risk of Overweight at Age 11 Years. Archives of Pediatrics & Adolescent Medicine, 163(4), 303–308.
Retrieved from <Go to ISI>://WOS:000264924500003
Stice, E., Fisher, M., & Lowe, M. R. (2004). Are dietary restraint scales valid measures of acute dietary restriction? Unobtrusive observational data suggest not. Psychological Assessment, 16(1), 51.
Stice, E., Sysko, R., Roberto, C. A., & Allison, S. (2010). Are dietary restraint scales valid measures of dietary restriction? Additional objective behavioral and biological data suggest not. Appetite, 54(2), 331–339.
Stunkard, A. J., & Messick, S. (1985). The three-factor eating questionnaire to measure dietary restraint, disinhibition and hunger. Journal of Psychosomatic Research, 29(1), 71–83. Suris, A., Lind, L., Emmett, G., Borman, P. D., Kashner, M., & Barratt, E. S. (2004). Measures
of aggressive behavior: Overview of clinical and research instruments. Aggression and Violent Behavior, 9(2), 165–227.
Van Strien, T., Frijters, J. E. R., Bergers, G., Defares, P. B., Strien, T. Van, Frijters, JER, B. G. P. a. and D. P. B., … Defares, P. B. (1986). The Dutch Eating Behavior Questionnaire (DEBQ) for assessment of restrained, emotional, and external eating behavior. International Journal of Eating Disorders, 5(2), 295–315.
http://doi.org/10.1002/1098-108X(198602)5:2<295::AID-EAT2260050209>3.0.CO;2-T