DETERMINING THE ROLE OF THE MACROPHAGE GLUT1 TRANSPORTER AND GLUCOSE METABOLISM IN OBESITY-ASSOCIATED INFLAMMATION
Maili Frances Lim
A thesis submitted to the faculty of the University of North Carolina at Chapel Hill in partial fulfillment of the requirements for the degree of Bachelor of Science in Public Health in the
Gillings School of Global Public Health (Nutrition).
Chapel Hill Spring 2015
Approved by: Dr. Liza Makowski
________________________________
Dr. Alex Freemerman
ACKNOWLEDGEMENTS
I would like to thank Dr. Liza Makowski for her ceaseless support and guidance throughout these past two years in the BSPH program, and Dr. Alex Freemerman for his outstanding mentorship over the course of this project. I would also like to thank the entire Makowski Lab for their assistance with my project.
ABSTRACT
Determining the role of the macrophage GLUT1 transporter and glucose metabolism in obesity-associated inflammation
(Under the direction of Liza Makowski, Ph.D.)
TABLE OF CONTENTS
LIST OF
FIGURES ………...5
Chapters I. SPECIFIC AIMS & HYPOTHESIS.………...6
II. INTRODUCTION……….11
III. METHODS………13
IV. BACKGROUND………...18
V. RESULTS………..21
VI. DISCUSSION ………27
LIST OF FIGURES
Figure
I. STUDY AIMS AND HYPOTHESIS
In the current study, we will investigate the role of GLUT1, the primary rate-limiting glucose transporter on macrophages, on the inflammatory response of macrophages in vivo and in vitro. We hypothesize that limiting glucose availability via GLUT1 knockout will result in a decreased inflammatory response. Past studies have shown that classically activated (M1) and alternatively activated (M2) macrophages preferentially utilize glucose and fatty acid substrates, respectively. Pro-inflammatory M1 macrophages are found in obese adipose tissue and are known to aggregate into crown-like structures (CLS) around dead or dying adipocytes. In contrast, anti-inflammatory M2 macrophages are found in lean tissue and participate in tissue remodeling, and maintain insulin sensitivity. We propose that reducing glucose availability will promote the use of fatty acids and β-oxidation for
fuel, i.e. a substrate switch, which will inhibit the ability of M1 macrophages to contribute to an inflammatory phenotype.
In order to test this hypothesis in vitro, a series of experiments will determine the inflammatory potential of bone marrow derived GLUT1-positive and GLUT1-deficient macrophages obtained from GLUT1-floxed (control) and macrophage-specific GLUT1 knockout mice. Gene expression will be quantified for several genes using quantitative polymerase chain reaction (qPCR). Macrophage markers F4/80 and CD11c will be
for inflammation. Arginase-1 (Arg1), interleukin-10 (IL-10), and mannose receptor C-1 (MRC-1) expression will serve as anti-inflammatory M2 markers.
In order to test this hypothesis in vivo, experiments will examine the inflammatory response of both control (GLUT1M+) and macrophage specific GLUT1-deficient (GLUT1M-) mice on low-fat and high-fat diets to observe differences in weight gain due to genotype. Gonadal fat from these mice will be fixed for immunohistochemistry and frozen for RNA. Tissue slides will be stained for F4/80, a macrophage marker for infiltration, and used to quantify crown-like structures (CLS) in adipose tissue. Gene expression in this same tissue (epididymal white adipose tissue, eWAT) will be quantified for the same genes studied in bone marrow derived macrophages (BMDM) using qPCR. These qPCR results in
SPECIFIC AIMS
AIM 1: BMDM polarized gene expression
To examine expression levels of inflammatory markers in unstimulated and M1 and M2 polarized BMDMs obtained from GLUT1M+ and GLUT1M- mice.
HYPOTHESIS: GLUT1M- BMDMs willexhibit decreased glucose metabolism and therefore decreased inflammation marked by decreased expression of inflammatory cytokines and inflammasome components, and increased expression of M2 markers in comparison to the GLUT1M+ BMDMs.
RATIONALE: Restricting glucose availability in BMDMs by knocking out GLUT1 will inhibit glucose metabolism favored by pro-inflammatory M1 macrophages, resulting in less
inflammation in GLUT1M- BMDMs compared to the control, and will be reflected in a decreased expression of pro-inflammatory markers.
EXPERIMENTAL DESIGN:
- Determine expression levels for pro-inflammatory cytokines MCP-1, iNOS, PAI-1, IL-6, and TNF-α using qPCR
- Determine expression levels for inflammasome components Caspase-1, Pycard, and NLRP3 using qPCR
AIM 2: eWAT gene expression
To examine expression levels of inflammatory markers in eWAT from GLUT1M+ and GLUT1 M-mice fed LFD and HFD.
HYPOTHESIS: Macrophages in the eWAT of HFD-fed GLUT1M- mice willexhibit decreased glucose metabolism and therefore decreased inflammation marked by decreased
expression of inflammatory cytokines and inflammasome components, and increased expression of M2 markers in comparison to the eWAT of HFD-fed GLUT1M+ mice. HFD-fed mice will also exhibit greater expression of inflammatory cytokines as compared to their LFD-fed counterparts.
RATIONALE: Restricting glucose availability in macrophages by knocking out GLUT1 will inhibit glucose metabolism favored by pro-inflammatory M1 macrophages, resulting in less inflammation in the eWAT of LFD- and HFD-fed GLUT1M- mice compared to similarly fed control mice, which will be reflected in a decreased expression of pro-inflammatory markers.
EXPERIMENTAL DESIGN:
- Determine expression levels for pro-inflammatory cytokines MCP-1, iNOS, PAI-1, IL-6, and TNF-α using qPCR
- Determine expression levels for inflammasome components Caspase-1, Pycard, and NLRP3 using qPCR
AIM 3: eWAT CLS and adipocyte size
To quantitate CLS and adipocyte size in eWAT from GLUT1M+ and GLUT1M- mice fed LFD and
HFD.
HYPOTHESIS: High-fat diet mice will exhibit greater numbers of CLS and larger adipocytes than their LFD counterparts, with GLUT1M- mice exhibiting lower numbers of CLS and smaller adipocytes compared to the control.
RATIONALE: The number of CLS present in adipose tissue and size of adipocytes are indicative of obesity-induced inflammation. Restricting glucose availability in macrophages will result in less adipose inflammation in HFD-fed GLUT1M -/-ϕ mice as marked by fewer CLS and smaller adipocytes.
EXPERIMENTAL DESIGN:
- Immunostain eWAT for F4/80 as a macrophage marker - Scan slidesusing an Aperio Scanscope
- Use ImageScope software to count CLS in 6 random sections per slide
II. INTRODUCTION
Obesity and diabetes are among the most prevalent of metabolic diseases in the United States, afflicting the majority of today’s adult population. The immune system is implicated in such diseases, which are indicative of severe energy imbalances within the body.
Macrophages and other immune cells found to reside in adipose tissue play a key role in promoting inflammation and the subsequent development of insulin resistance.
Macrophages are the immune cells most commonly associated with triggering inflammation in adipose tissue. They are phagocytic cells of the immune system and are derived from monocytes. Macrophages can be both pro-inflammatory as well as anti-inflammatory: type 2 macrophages (M2) are those found within adipose tissue and are involved in digestion, repair, and regeneration; the inflammation characteristic of obesity, however, is triggered by type 1 macrophages (M1), which have been found to secrete inflammatory cytokines. Previous studies have posited that obesity promotes the
polarization of macrophages from the anti-inflammatory M2 to pro-inflammatory M1. This shift may be influenced by fuel substrates in the microenvironment [1] due to fact that the types tend to utilize different pathways to obtain energy.
chemoattractant Protein-1 (MCP-1) in inflammation by demonstrating the lack of macrophage infiltration using both MCP-1 deficient mice and MCP-1 receptor
CCR2-deficient monocytes. Surrounding macrophages then secrete inflammatory cytokines such as TNF-α and IL-6, driving a pro-inflammatory response [3]. In the obese state,
macrophages increase from comprising 10% of all adipose tissue cells to over 50% [4]. The damage done to the tissue may also be a factor attracting macrophages to the site, as they have been observed to form crown-like structures (CLS) around dead or dying adipocytes [5].
One potential way in which the inflammatory response may be modulated is through metabolic programming via limited glucose availability. In highly glycolytic
III. METHODS
Animals and diets
GLUT1–floxed C57BL/6J mice were obtained from E. Dale Abel, MD, Ph.D. (University of Iowa). Mice used in this study were bred from C57BL/6J mice harboring 2 floxed GLUT1 alleles and one LysM-CRE recombinase allele (male and female). All resultant offspring harbored 2 floxed GLUT1 alleles and either 0, 1, or 2 CRE recombinase alleles. For this study, between 14 to 19 3-week old male GLUT1-floxed mice with either 0 CRE alleles (control mice, GLUT1M+) or 2 CRE alleles (GLUT1 macrophage knockout mice, GLUT1M-) were randomized to either a purified diet supplying 10% kcal from fat (Research Diets D12450B, LFD) or 45% kcal from fat (Research Diets D12451, HFD). Animals were housed in a climate-controlled Department of Laboratory Animals Medicine facility with a 12 hour light:dark cycle. Animals were given ad libitium access to food and water. All animal
procedures were approved by the University of North Carolina at Chapel Hill Institutional Animal Care and Use Committee.
Percent body fat
Body composition was measured at weaning, 4, 8, and 20 weeks on diet using magnetic resonance imaging (MRI, EchoMRI, Houston, TX).
each hind leg. After cutting the ends off the bones, the bone marrow was flushed from the bones using sterile PBS containing 2% fetal bovine serum. Bone marrow was pelleted by centrifugation at 1200 rpm for 5 minutes, the supernatant aspirated, and the pellet resuspended in Ammonium-Chloride-Potassium (ACK) buffer for 30 seconds. Then 13 ml RPMI-1640 complete media was added to the cells. The cells were again pelleted by centrifugation at 1200 rpm for 5 minutes, the supernatant aspirated and the cells
resuspended in complete RPMI-1640. Marrow was cultured in RPMI-1640 containing 30% L929 conditioned media supplemented with 10% FBS, 2mM glutamine, 100 IU/mL
penicillin and 100µg/mL streptomycin (Sigma-Aldrich, St. Louis, MO). BMDM were differentiated using 70% RPMI-1640/30% L929 conditioned media for 6 days with one change of media. BMDM were left as naïve unstimulated macrophages (M0), or polarized using 5ng/mL lipopolysaccharide (LPS) and 10ng/mL interferon- (IFN- ) (M1) or 10ng/γ γ
mL interleukin-4 (IL-4) (M2) for 24 hours (Vats et al., 2006). Cell densities and viability were determined by hematocytometer and trypan blue exclusion, respectively. Cell size, volume, and viability were determined using a Sceptor™ handheld automated cell counter (Millipore, Billerica, MA).
Tissue and blood collection
Gene expression analysis
RNA was isolated from BMDM cell pellets or eWAT using an RNeasy kit and protocol (Qiagen, Valencia, CA). The RNA quantity and quality was determined using Nanodrop (Thermo Fisher Scientfic, Inc., Waltham, MA) and reverse transcribed into cDNA using the iScript cDNA synthesis kit (Bio-Rad, Hercules, CA). Gene expression was quantitated by qPCR using either Universal Probe Libraries (Roche Diagnostics, Indianapolis, IN) or Assay-On-Demand (AOD) chemistries on an ABI 7900HT machine (Life Technologies, Grand Island, NY) (Qin et al., 2013). Expression levels of genes of interest were normalized to expression of 18S. All reactions had a volume of 10 µl. AOD reactions contained 1 µl cDNA (10 ng/µl), 3.5 µl deionized water, 0.25 µl 18s, 0.25 µl AOD, and 5 µl SsoAdvanced Universal Probes Supermix (Bio-Rad Laboratories). Universal probe library (UPL) reactions
contained 1 µl cDNA (10 ng/µl), 3.35 µl deionized water, 0.25 µl 18s, 0.2 µl UPL, 0.2 µl gene primer, and 5 µl Supermix. Reactions were run for one cycle at 95o C for 20 seconds then 40 cycles at 95o C for 5 seconds and 60o C for 20 seconds in a 7900HT Fast Real-Time PCR System (Life Technologies, Carlsbad, CA). Data were analyzed using SDS 2.4 software and the comparative ∆∆CT method. qPCR on BMDMs was performed on 3-5 separate
experiments each in triplicate and averaged. qPCR on eWAT was performed on RNA from 8 separate mice/group in triplicate and averaged.
Histological analysis
(Sundaram et al., 2013a). The number of crown-like structures (CLS) was counted in 6 randomly selected areas under 20X magnification for each slide of tissue from all mice in the study. Adipocyte diameters (longest axis) from one window per sample were measured using ScanScope Image Analysis Toolbox software and averaged to determine overall adipocyte diameter per sample.
Statistics
Statistical differences between experimental groups were determined by two-way ANOVA followed by multiple comparisons tests using statistics software within GraphPad Prism (GraphPad Software, Inc., La Jolla, CA).
IV. BACKGROUND
GLUT1 macrophage-specific knockout mouse
Mice floxed for both alleles of GLUT1 (flanking exons 1-8) were crossed with a mouse expressing LysM-CRE. The LysM promoter drives expression of CRE specifically in cells of monocytic lineage like macrophages, neutrophils, and dendritic cells. CRE in these cells recognizes the inserted LoxP sites flanking the GLUT1 gene and excizes that DNA,
effectively deleting GLUT1. GLUT1 knockout and control male mice were used as the source for BMDMs in order to study the impact of GLUT1 deletion on metabolism and gene
Metabolism in BMDM from GLUT1M+ and GLUT1M- mice.
BMDMs were generated from GLUT1M+ and GLUT1M- mice by incubating BM cells in L929 conditioned media for 6 days. BMDMs were then plated and either left unstimulated (M0), treated with 5ng/ml LPS and 10ng/ml IFNγ (M1), or 10ng/ml IL-4 (M2) for 24 hours. Glucose uptake, glucose oxidation, fatty acid uptake, and fatty acid oxidation were assessed. Glucose uptake in ko BMDMs is completely abolished in M0 and M2 cells with only a small amount of uptake in M1 cells (Figure 1). Glucose oxidation is depressed in ko M0, M1, and M2 cells with no M1 stimulation. Knockout macrophages (M0, M1, and M2) take up more fatty acid and also oxidize more fatty acid.
A. B.
D. C.
Figure 1. Glucose uptake (A) and oxidation (B); fatty acid uptake (C) and oxidation (D). (A) Glucose uptake was decreased for GLUT1M- BMDMs in the M0 (p<0.0001), M1 (p<0.0001), and M2 (p=0.017) groups, with M0 distinct from the M1 and M2 groups (p<0.0001).(B) Glucose oxidation was decreased for GLUT1M- BMDMs in the M0 (p=0.0036), M1 (p=0.0033), and M2 (p=0.00015) groups, with NS found between
Adipose tissue macrophages (ATM) from GLUT1M+ and GLUT1M- mice.
eWAT from chow-fed GLUT1M+ and GLUT1M- mice was pooled from 4 male mice and the tissue disassociated to isolate the stroal vascular fraction which contains the macrophages. These cells were immunostained for F4/80 (to identify macrophages), CD11c (M1 marker), and CD206 (M2 marker) and analyzed by flow cytometry (Figure 2). Gating on only F4/80 positive cells, the ko ATMs show a clear M2 shift with more CD206 labeling and less CD11c labeling.
HFD in GLUT1M+ and GLUT1M- mice.
Male GLUT1M+ and GLUT1M- mice (14-19 per group) were weaned onto LFD or HFD and fed for 20 weeks. Weights were measured weekly and body composition was determined by MRI at 0, 4, 8, and 20 weeks on diet (Figure 3). Although there is a clear diet effect, there is no significant effect on weight or percent body fat in the GLUT1M- mice. However, there is a consistent trend of the GLUT1M- mice being slightly heavier and with a higher percent body fat on both LFD and HFD. At the conclusion of the diet study, mice were sacrificed and tissues collected for histology and RNA.
M1
M2
V. RESULTS
IN VITRO
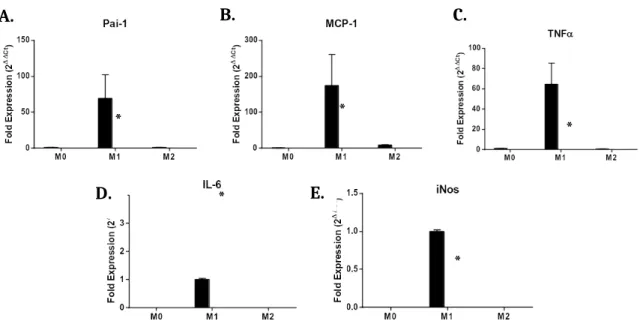
M1 markers in polarized BMDMs by qPCR
Expression was normalized to GLUT1M+ M0 macrophages for Pai-1, MCP-1, and
TNF-α; expression
was normalized to GLUT1M+ M1 macrophages for IL-6 and iNos because there was no detectable expression of these cytokines in M0 macrophages. Significantly reduced expression of
pro-inflammatory cytokines PAI-1, MCP-1, TNF- α, and iNos was observed in M1 ploarized
GLUT1M- BMDMs compared to M1 polarized controls (Figure 4). In contrast, expression of the pro-inflammatory cytokine IL-6 was observed to be increased in M1 polarized GLUT1M- BMDMs compared to M1 polarized controls.
Figure 3. Body Weight and Body Composition. HFD-fed mice began to show weight gain that was statistically higher than LFD-fed mice at 5 weeks
(p=0.016) (A). For both HFD and LFD groups, average weight in the GLUT1 M-group was found to be higher, however, there were no significant differences between genotypes. Body composition. HFD-fed mice were found to have a higher percentage of body fat compared to LFD-fed mice (p =0.025 by two-way ANOVA) at 4 weeks of age, but no genotype effect was found at the conclusion of the study.
Inflammasome markers in polarized BMDMs by qPCR
Expression was normalized to GLUT1M+ M0 macrophages. Significantly reduced expression for inflammasome markers Caspase-1 and NLRP-3 was observed in M1 polarized GLUT1 M-M1 BMDMs as compared to controls (Figure 5). There were no differences in Pycard expression.
M2 markers in polarized BMDMs by qPCR
Type I arginase (Arg1) is an enzyme involved in L-arginine/nitric oxide (NO) metabolism,
and is commonly used as a marker for the M2 anti-inflammatory phenotype [6]. Arg1 expression was increased in M2 macrophages, but was significantly lower in the GLUT1 M-M2 BMDMs as compared to M-M2 polarized controls (Figure 6). MRC-1 expression in GLUT1M- M0 BMDMs was significantly higher compared to the M0 control cells. MRC-1 expression is increased in M2 macrophages and decreased in M1 macrophages compared to M0 macrophages. IL-10 expression levels reflected a significant decrease in the GLUT1 M-M1 group from that of the control. Expression was normalized to GLUT1M+ M0
macrophages.
IN VIVO
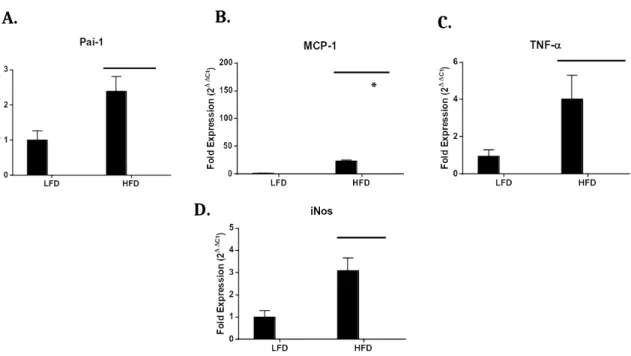
M1 marker expression in eWAT
Inflammasome markers in eWAT by qPCR
Expression of Caspase-1, Pycard, and NLRP3 all showed increased expression in the HFD groups compared to the LFD groups. Significant increases in expression were observed for Caspase-1 and Pycard in GLUT1M-eWAT from HFD-fed mice as compared to their HFD controls (Figure 8).
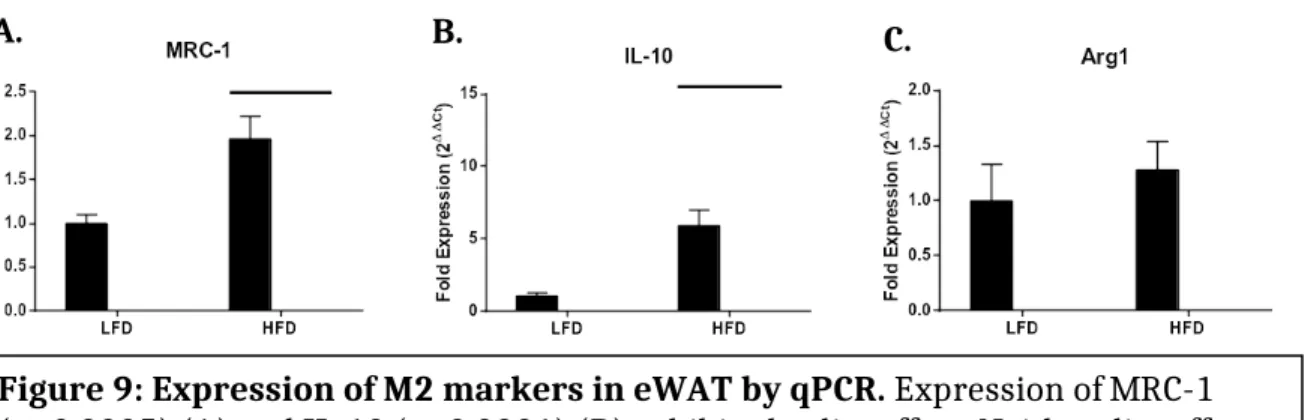
M2 markers in eWAT by qPCR
Expression of MRC-1 and IL-10 were both significantly increased by diet, but there were no differences in expression levels within diet groups. ARG-1 expression showed no differences in expression levels when comparing either diet or genotype (Figure 9).
Crown like structures (CLS) in eWAT
Crown-like structures were more abundant in both HFD groups in comparison to the two LFD groups, demonstrating a diet effect. While no genotype effects were found in LFD-fed mice, in the HFD groups, a genotype effect was observed, with the HFD GLUT1M- mice demonstrating higher numbers of CLS than the HFD GLUT1M+ mice (Figure 10A).
Adipocyte diameter
B.
A. C.
* *
*
*
* E.
D.
Figure 4. Expression of M1 markers in polarized BMDMs by qPCR.
Compared to GLUT1M+ mice, GLUT1M- mice showed a decrease in expression for M1 markers PAI-1 (p<0.05) (A), MCP-1 (p<0.05) (B), TNF (p<0.001) (C), α
and iNOS (p<0.0001) (E). An increase in expression was observed for IL-6 (p<0.0001) (D). All expression levels were normalized to the M0 control, except in cases where there was no M0 expression (IL-6, iNos).
C. B.
A.
* *
C. B.
A.
* *
*
Figure 6. Expression of M2 markers in polarized BMDMs by qPCR. Expression levels for MRC-1 decreased in the M1 group and increased in the M2 group (A), with expression increased for the M0 knockout (p=0.002). IL-10 expression was decreased in the M1 group (p=0.012) (B). Arg1 expression was decreased in the M2 group (p<0.0001) (C).
B. C.
A.
D.
*
Figure 7: Expression of M1 markers in eWAT by qPCR. Expression of MCP-1 revealed a genotype effect (p=0.0032) as well as a diet effect (p=0.0002) (B). Expression of PAI-1 (p=0.017) (A), TNF (p=0.0006) (C), and iNOS (p=0.0006)α
C. B.
A.
*
*
Figure 8: Expression of inflammasome components in eWAT by qPCR. Expression of Caspase-1(p=0.0007) (A) and Pycard (p=0.0001) (B) reflected both a genotype effect as well as a diet effect (p=0.0001) (A), (p=0.0001) (B). NLRP-3 expression exhibited a diet effect (p=0.0008) (C).
A. B. C.
Figure 9: Expression of M2 markers in eWAT by qPCR. Expression of MRC-1 (p=0.0005) (A) and IL-10 (p<0.0001) (B) exhibited a diet effect. Neither diet effect nor genotype effect was observed with regard to Arg1 expression (C)
A.
*
VI. DISCUSSION
Obesity is a chronic, low-grade state of inflammation in which macrophages play a crucial role. Weight gain induces the production of chemokines such as MCP-1 that recruit monocytes to adipose tissue. These monocytes then differentiate into pro-inflammatory M1 macrophages [7]. Indeed, obese adipose is often characterized by the infiltration and
activation of macrophages whereby they surround and consume dead and dying adipocytes forming numerous crown-like structures. Glucose is the primary energy substrate for M1 polarized macrophages, which is brought into the cell by GLUT1, the primary glucose transporter on macrophages [1]. Not surprisingly, GLUT1 is especially upregulated in M1 macrophages (data not shown). To examine the effects of limiting glucose availability on macrophage biology and diet-induced obesity, we created a novel murine model with a macrophage-specific GLUT1 deletion.
First, we established that BMDMs from these GLUT1M- mice were viable and did not take up glucose. Preliminary data also confirmed a substrate shift toward fatty acid utilization (Figure 1). Our gene expression results in BMDMs were consistent with our hypothesis that an energy substrate shift from glucose to fatty acids would impair the inflammatory response. BMDMs polarized to the M1 phenotype demonstrated significantly blunted upregulation of all M1 inflammatory markers with the exception of IL-6 (Figure 4D). The upregulation of inflammasome components Caspase-1 and NLRP-3 in M1 polarized
significantly elevated in unstimulated GLUT1M- BMDMs compared to control BMDMs. In fact, this agrees nicely with our preliminary flow data examining CD206 (MRC-1)
expression in ATMs from GLUT1M- and GLUT1M+ eWAT, which shows a greater percentage of CD206 expressing macrophages in the GLUT1M- eWAT. It is likely that a 24 hour in vitro polarization does not completely and faithfully recapitulate macrophage differentiation and polarization within the adipose tissue in vivo.
We also examined gene expression in obese and lean adipose from GLUT1M+ and GLUT1M- mice fed either HFD or LFD for 20 weeks. There were significant differences observed between the diet groups for body weight and fat composition but no differences between genotypes. With regard to gene expression data, a diet effect was again observed, demonstrating significantly greater expression of M1 markers in both HFD-fed genotypes. This discrepancy between our in vitro and in vivo gene expression results may be explained by the confounding contribution of the adipocytes when examining gene expression in an entire tissue and not just the macrophages. Interestingly, we did observe significant
increases in gene expression for MCP-1, Pycard, and Caspase-1 in HFD-fed GLUT1M- eWAT. Both Caspase-1 and Pycard are expressed by adipocytes as well as macrophages;
demonstrated that there was a marked shift from the pro-inflammatory M1 phenotype to the anti-inflammatory M2 phenotype in the eWAT of GLUT1M- mice (Figure 2). Taking into account the BMDM gene expression data, the increase in macrophage infiltration as
reflected by histological analysis, and our findings from flow cytometry, we can conclude that macrophage infiltration is occurring, although polarization to the pro-inflammatory M1 phenotype is inhibited. This inhibition is reflected in our expression data, which shows that in spite of the influx of macrophages into adipose tissue, HFD-fed GLUT1M- mice did not exhibit significant elevations in classic inflammatory cytokines such as iNOS, PAI-1, and TNF- . α
This study was designed to determine the role of the GLUT1 transporter in activation of the inflammatory response. It was hypothesized that limiting glucose availability via deletion of the main rate-limiting glucose transporter on macrophages would result in a less inflammatory phenotype. Based on combined data in vitro as well as in vivo, it is evident that there is some degree of attenuation of inflammation in the macrophages of GLUT1 deficient mice. However, further studies are needed to determine the entirety of the mechanism responsible for the hindered inflammatory response.
CONCLUSION
activation. Thus, further studies are needed to determine the role of GLUT1 in the mediation of local and systemic effects on diet-induced obesity.
VII. REFERENCES
[1]Freemerman, A. J., Johnson, A. R., Sacks, G. N., Milner, J. J., Kirk, E. L., Troester, M. A., ... & Makowski, L. (2014). Metabolic Reprogramming of Macrophages GLUCOSE TRANSPORTER 1 (GLUT1)-MEDIATED GLUCOSE METABOLISM DRIVES A PROINFLAMMATORY
PHENOTYPE. Journal of Biological Chemistry, 289(11), 7884-7896.
[2] Gregor, M. F., & Hotamisligil, G. S. (2011). Inflammatory mechanisms in obesity. Annual review of immunology, 29, 415-445.
[3] Tateya, S., Kim, F., & Tamori, Y. (2013). Recent advances in obesity-induced inflammation and insulin resistance. Frontiers in endocrinology, 4.
[4] Odegaard, J. I., & Chawla, A. (2013). Pleiotropic actions of insulin resistance and inflammation in metabolic homeostasis. Science, 339(6116), 172-177.
[5] Johnson, A. R., Justin Milner, J., & Makowski, L. (2012). The inflammation highway: metabolism accelerates inflammatory traffic in obesity. Immunological reviews, 249(1), 218-238
[6] Yang, Z., & Ming, X. F. (2014). Functions of arginase isoforms in macrophage inflammatory responses: impact on cardiovascular diseases and metabolic disorders. Frontiers in immunology, 5.
[7] Kraakman, M. J., Murphy, A. J., Jandeleit-Dahm, K., & Kammoun, H. L. (2014).