Introduction
The Galapagos Islands are located 600 miles off the west coast of Ecuador in the Pacific Ocean. There are approximately 28,000 people living on five inhabited islands in the Galapagos (Galapagos Conservancy, 2008). San Cristobal Island is one of the five inhabited islands in the archipelago, and all of the islands are part of Ecuador.
Residents of the Galapagos Islands are primarily people who have emigrated from mainland Ecuador. The primary industry in the Galapagos is tourism, which brings
approximately 150,000 people to the islands every year (Watkins, 2007). Because of the tourism industry, the socioeconomic status of Galapagos residents is higher than most other provinces of Ecuador, drawing people to the islands to live and work. However, the cost of living on the islands is high (Page, 2013).
In 1959, in response to human settlement on the Galapagos and concerns about environmental and wildlife conservation, the Ecuadorian government created the Galapagos National Park, which turned 97% of the land on the Galapagos into a protected conservation area, and restricted 3% of the land for human settlement. Since then, there has been more pressure to restrict human migration, land use, and agricultural production on the islands in order to protect
the natural environment (Watkins, 2007).
and disease. Additionally, farming is done in the highlands, and transportation into town to sell produce is burdensome for farmers. Because of the transportation costs and restrictions, food grown on the island is usually more expensive than food shipped in from mainland Ecuador. All of these factors have made the fishing and tourism industries more profitable than farming, and farming on the islands has steadily decreased (Watkins, 2007). Overall in Ecuador, agriculture makes up only 8% of the economy, with the largest economic sector being the service sector (68%) and industry making up the remaining 24% (Waters, 2006).
The Galapagos Islands are a somewhat vulnerable place to live, as nearly everything needed for human habitation on the island is shipped from mainland Ecuador. Food that is shipped from the mainland is subsidized, which is another reason why it is generally cheaper than food that is grown on the island (Watkins, 2007; Novy, 1999). However, the produce sometimes arrives over ripe or rotten, as it is generally uncovered on the boats and has to travel 600 miles to the islands. Additionally, ships may not make it to the island at all, if a ship has to skip one of the islands for some reason (Page, 2013). This may lead to island-wide food
insecurity because residents are unable to get the types of foods that they desire due to unavailability.
Most research to date in the Galapagos Islands has focused on the natural environment, resulting in permanent residents often feeling ignored. There has been one study prior to this one that has focused on the quality of life for human inhabitants of the Galapagos Islands (Page, 2013). This study of mother-child dyads took place on Isla Isabela. Evidence of the nutrition transition was found, as well as a high prevalence of other health-related issues, such as poor
water quality, lack of access to medical care, and depression. The nutrition transition is
high in fats, sweeteners and processed foods (Popkin, 2002). With this shift in dietary patterns comes a shift in disease burden, with increasing rates of overweight and obesity leading to noncommunicable diseases.
In this study, we aimed to characterize the current food environment on the island and determine how the nutritional health of mothers and children are affected. Problems associated with food access will hopefully shed light on barriers to food security on the island, and typical intakes of mothers and children as well as general weight patterns will be described. We will frame our findings in the context of the global nutrition transition.
Methods
To better understand the food environment on San Cristobal Island, we analyzed food access and typical dietary practices of mothers with children between one and six years of age. Two of our primary tools were the Spanish language United States Department of Agriculture (USDA) Household Food Security Questionnaire, and non-quantified 24-hour dietary recalls. We also collected anthropometric data to assess mother and child weight status.
Study Population
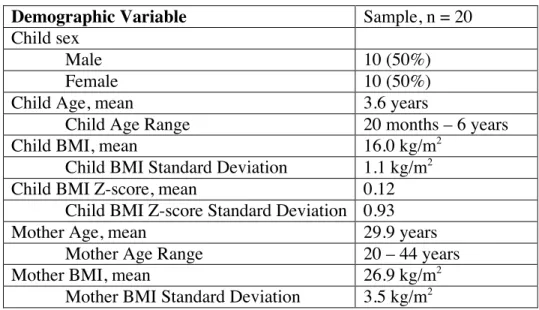
Table 1. Population demographics.
Demographic Variable Sample, n = 20
Child sex
Male 10 (50%)
Female 10 (50%)
Child Age, mean 3.6 years
Child Age Range 20 months – 6 years
Child BMI, mean 16.0 kg/m2
Child BMI Standard Deviation 1.1 kg/m2
Child BMI Z-score, mean 0.12
Child BMI Z-score Standard Deviation 0.93
Mother Age, mean 29.9 years
Mother Age Range 20 – 44 years
Mother BMI, mean 26.9 kg/m2
Mother BMI Standard Deviation 3.5 kg/m2
In-depth Interviews
A graduate student in Nutrition from the University of North Carolina at Chapel Hill, Beth Hopping, conducted the interviews in Spanish, and respondents dictated whether the interview took place in their homes or place of business. Interviews took approximately 45 minutes to complete and respondents were compensated US$10 for their time. Informed consent was obtained from each respondent prior to beginning participation. The interviews were audio recorded and were transcribed and translated into English by a third party. The Institutional Review Board of the University of North Carolina at Chapel Hill approved the study protocol.
Anthropometric Data
Height and weight were collected for each mother and child dyad. We used body mass index (BMI) to assess the prevalence of underweight, healthy weight, overweight and obesity in
the population. For mothers, a BMI of less than 18.5 kg/m2
is considered underweight,
18.5-25.00 kg/m2
is normal, 25.00-30.00 kg/m2
is overweight, and a BMI of greater than 30.00 kg/m2
is considered obese (WHO). For children, we used BMI z-scores and growth charts from the US
Centers for Disease Control and Prevention (CDC) to assess underweight, normal weight, overweight and obese status. A child whose BMI Z-score falls below the 5th percentile is considered underweight, a BMI Z-score between the 5th percentile and the 85th percentile is considered to be a healthy weight, 85th-95th percentile is classified at overweight, and above the 95th percentile is considered obese. Stunting, defined as a height-for-age that is at least two standard deviations below the mean on standard growth charts (UNICEF), was also used as a means to assess child nutrition status.
Food Security Questionnaire
Food security is the condition in which all people at all times have access to sufficient, safe, nutritious food to maintain a healthy and active life (Coleman-Jensen, 2013). The Spanish version of the USDA Household Food Security questionnaire was administered to each mother and scored according to USDA guidelines (Bickel, 2000). Using the USDA methodology, food security can be broken down into four levels: high food security, marginal food security, low
food security, and very low food security. High food security indicates no trouble accessing or
report no decreased food intake or compromised diet quality. Low and very low food security are defined as food insecure, and in both categories households experience reduced quality, variety, or desirability of diet. Very low food secure households report disrupted eating patterns and reduced food intake (Coleman-Jensen. 2013). Households are considered to be food secure if they fall into the high or marginal food security categories, and households are considered food insecure if they fall into the low or very low food security categories.
24-Hour Dietary Recalls
Non-quantified 24-hour dietary recalls were collected for each mother and child dyad. These were used to assess individual dietary diversity for mothers and children using the Food and Agriculture Organization of the United Nations (FAO) dietary diversity scoring guidelines (FAO, 2008). This methodology includes thirteen food group categories: cereals; vitamin A-rich vegetables and tubers; white tubers; dark leafy green vegetables; other vegetables; vitamins A-rich fruits; other fruits; organ meat; flesh meat; eggs; fish; legumes, nuts, and seeds; and milk and milk products. Dietary diversity scores are calculated as the sum of the number of food groups represented in an individual’s diet in the 24-hour period captured in the dietary recall. The FAO defines low dietary diversity as fewer than three of the thirteen food groups consumed in one day, medium dietary diversity as four or five food groups, and high dietary diversity as more than six food groups consumed. Using these categories, dietary diversity has been
Results
Anthropometric Analysis
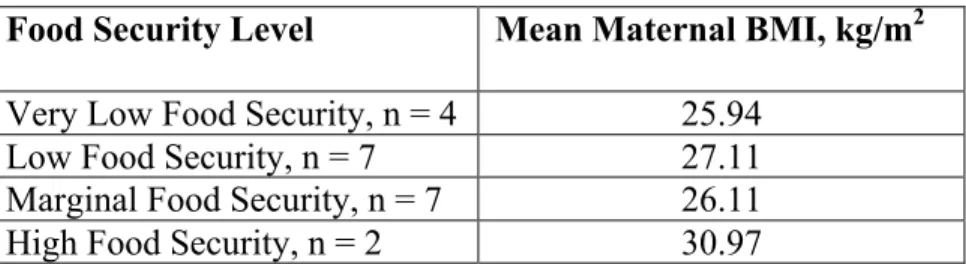
Most of the mothers interviewed were classified as overweight or obese. None of the mothers interviewed were classified as underweight, while 25% fell into the normal BMI category, 55% were overweight, and the remaining 20% of mothers were obese. Maternal BMI followed an upward trend with food security status (Table 2), with mothers from the least food secure households having the lowest mean BMI and mothers from the most food secure households having the highest mean BMI.
Table 2. Mean maternal BMI by food security level.
Food Security Level Mean Maternal BMI, kg/m2 Very Low Food Security, n = 4 25.94
Low Food Security, n = 7 27.11
Marginal Food Security, n = 7 26.11
High Food Security, n = 2 30.97
Of the twenty mothers interviewed, 75% reported trying to lose weight. Respondents who wanted to lose weight often referred to themselves as “plump” or “fat.” When asked if they would like to gain, lose or maintain their current weight, these mothers typically responded:
“I would like to lose some weight because I feel fat this way.” (31 years old, very low food security)
“I am always trying to lose weight. I have always been that way.” (39 years old, low food security)
“[I am] trying to lose weight, but it’s hard to keep with it but the temptation is still there; people around me eat yummy things, but yes, I would like to lose weight.”
Five of the mothers who were trying to lose weight reported thinking that their bodies were “fine” or “normal” sized. Only two mothers wanted to maintain their weight, and three mothers said they were trying to gain weight. One of these mothers was pregnant and was trying to gain weight for pregnancy. Only one mother reported that she felt too skinny, and she was from a food insecure household.
In this population, 85% of the children were a healthy weight. Only three children (15%) were classified as overweight, and there were no underweight or obese children. All three of the overweight children were from households that were food insecure, and two of them were from households with very low food security. Only one child was stunted, and the remaining 95% of the children in this population were at a normal height-for-age. Mothers often stated that their children were in good health, and related their good health to food:
“[His health is] good, I think…. It’s because of his nutrition and everything I give him. Lots of veggies and fruit smoothies.” (35 years old, marginal food security)
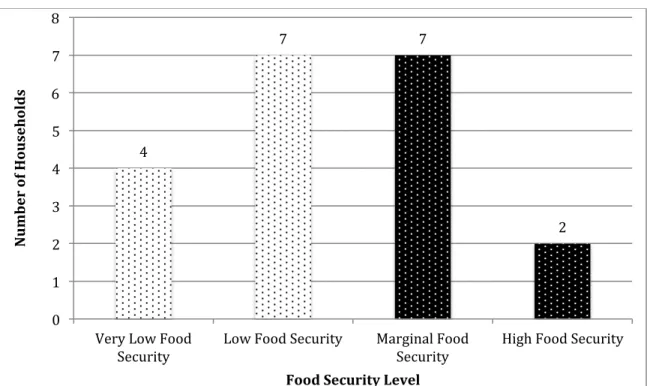
Food Security
Study participants reported high levels of food insecurity. Over half of the population
Figure 1. Household food security level distribution.
*Food insecure categories: light polka dots Food secure categories: dark polka dots
Limited availability of acceptable produce was cited as a problem on the island by 60% of mothers. In response to a question about the variety and types of food available on the island, one mother said:
“Well, it’s not because we don’t have enough for us specifically, it’s just that sometimes there is not enough on Galapagos. So sometimes yes, there was a time when all the food on the boats went bad, so there were no fruits and there were no veggies, so we could only get onion, tomato, and there was no variety. When there are boats there is enough of everything, but when there’s not, it’s bad.” (38 years old, marginal food security)
4
7 7
2
0 1 2 3 4 5 6 7 8
Very Low Food
Security Low Food Security Marginal Food Security High Food Security
N u m b er o
f H
ou
se
h
ol
d
s
Dietary Diversity
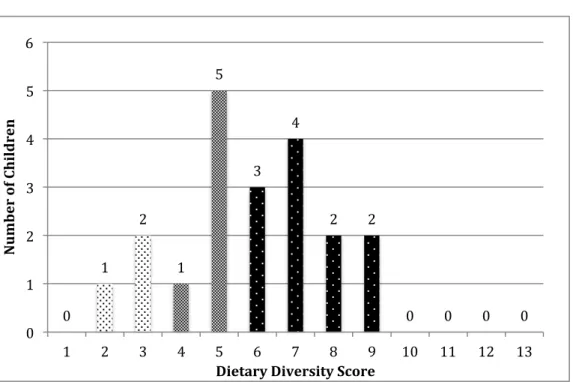
There was a wide range of dietary diversity on the island. For children, dietary diversity scores ranged from 2-9, with a mean of 5.85. Three children (15%) had low dietary diversity scores (<3 food groups), while more than half of children experienced high dietary diversity (≥6 food groups) (Figure 2). There were no trends observed between child age and dietary diversity.
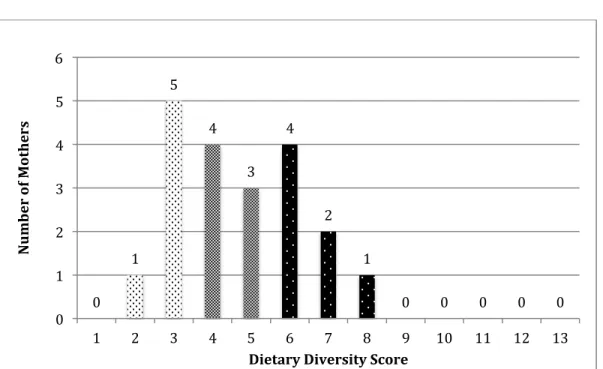
Maternal diets tended to be less diverse than their children’s; the mean dietary diversity score for mothers was 4.7, and only three mothers reported having more highly diverse diets than their children. One third of mothers reported highly diverse diets, as compared to over half of the children having highly diverse diets, and 30% of mothers reported low dietary diversity (Figure 3). Within the same household, it was not uncommon for mothers to report consuming three fewer food groups per day than their children.
Figure 2. Child dietary diversity score distribution (n = 20).
0 1
2
1 5
3 4
2 2
0 0 0 0 0
1 2 3 4 5 6
1 2 3 4 5 6 7 8 9 10 11 12 13
Number of Ch
ildren
Figure 3. Maternal dietary diversity score distribution (n = 20).
*Low dietary diversity: light spots Medium dietary diversity: medium spots High dietary diversity: dark spots
Child dietary diversity was related to household food security status. Children in
households with high food security consumed on average 3.5 more food groups than children in households with very low food security. Children in households that had low or marginal food security both consumed approximately six food groups per day, which is slightly higher than the overall dietary diversity average for this population. Maternal dietary diversity, however, did not appear to be impacted by food security status. Mean maternal dietary diversity did not fluctuate with food security level. Mothers experiencing the highest levels of food security reported less than one food group more on average than mothers experiencing the lowest food security (Figure 4).
0 1
5
4
3 4
2
1
0 0 0 0 0
0 1 2 3 4 5 6
1 2 3 4 5 6 7 8 9 10 11 12 13
N u m b er o
f M
ot
h
er
s
Figure 4. Mean dietary diversity by food security level.
Typical Dietary Intake
Among children, the most commonly consumed foods included cereals (consumed by 100% of children), milk and milk products (90%), and soup (90%). The soup was generally homemade, and the ingredients of the soup were counted in the dietary diversity analysis (i.e., chicken noodle soup was counted as both a meat and a grain, and vegetable soup was counted as a vegetable).
The majority (65%) of children consumed a snack, and 40% of children reported consuming fried foods. Soda and sweets were relatively uncommon; only 10% reported
consuming soda, and 25% consumed a dessert. These trends are represented visually in Figure 5.
4
6.3
6
7.5
4.25
5
4.57
5
0 1 2 3 4 5 6 7 8
Very Low Food
Security Low Food Security Marginal Food Security High Food Security
N u m b er o
f F
oo d G ro u p
s
Co n su m ed
Food Security Level
Mean Child Dietary Diversity
Figure 5. Combined mother and child 24-hour dietary recall “wordle”; the larger the word, the more often it was reported by both mothers and children.
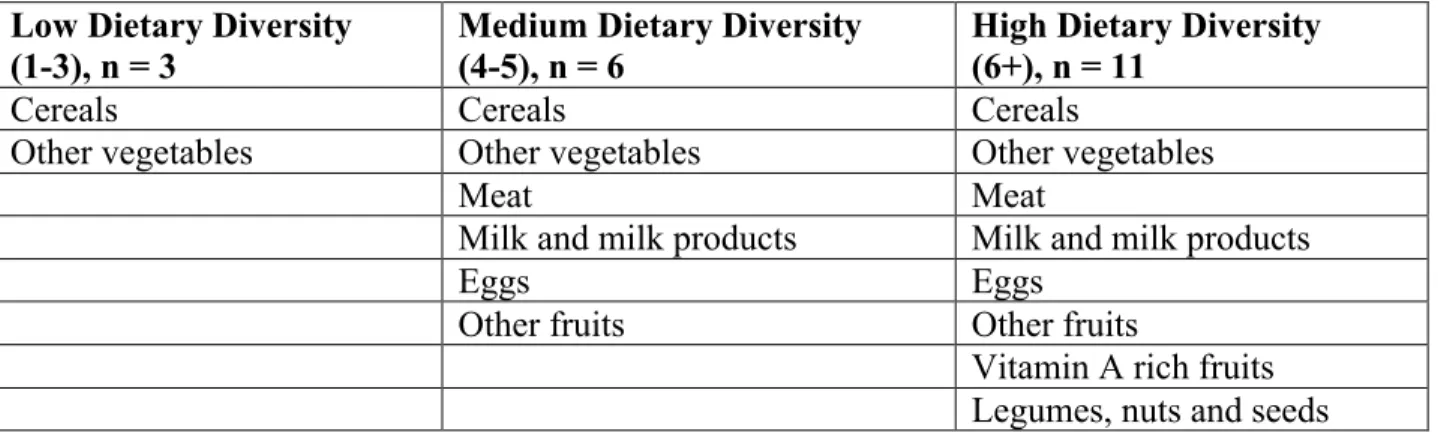
Table 3. Child commonly consumed foods.
Low Dietary Diversity (1-3), n = 3
Medium Dietary Diversity (4-5), n = 6
High Dietary Diversity (6+), n = 11
Cereals Cereals Cereals
Other vegetables Other vegetables Other vegetables
Meat Meat
Milk and milk products Milk and milk products
Eggs Eggs
Other fruits Other fruits
Vitamin A rich fruits Legumes, nuts and seeds
*Foods consumed by ≥50% of children in each category
Table 4. Maternal commonly consumed foods.
Low Dietary Diversity (1-3), n = 6
Medium Dietary Diversity (4-5), n = 7
High Dietary Diversity (6+), n = 7
Cereals Cereals Cereals
Other vegetables Other vegetables Other vegetables
Meat Meat Meat
Fish Fish
Milk and milk products Milk and milk products Vitamin A rich fruits Legumes, nuts and seeds
*Foods consumed by ≥50% of mothers in each category
A typical child breakfast consisted of bread, eggs, and a dairy product; lunch and dinner usually included soup, rice, a fruit or vegetable, and either fish, beans, or meat. Fruit, vegetables, chips, oatmeal or cereal, or sweets were typical snacks. Milk and juice would be consumed with meals. A typical maternal diet would be similar, with more fish consumed during lunch and dinner.
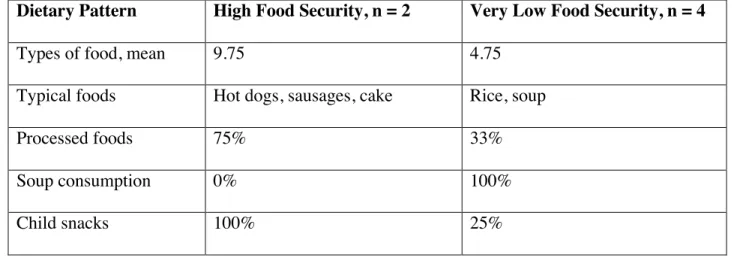
four children from the very low food secure households reported having a snack. Additionally, mothers and children in highly food secure households reported consuming many different types of food. On average, mothers and children in the high food security households consumed 9.75 different types of food per day, as opposed to an average of 4.75 food groups per day in the very low food security households. This is not reflected in dietary diversity, as the different types of food consumed in the high food security households did not necessarily come from a variety of food groups. Low food security households consistently reported consuming rice and soup, while the high food security households reported consuming foods like hot dogs, sausages, sandwiches, and more highly processed foods. These patterns are summarized in Table 5.
Table 5. Comparing dietary patterns of High and Very Low food security households
Dietary Pattern High Food Security, n = 2 Very Low Food Security, n = 4
Types of food, mean 9.75 4.75
Typical foods Hot dogs, sausages, cake Rice, soup
Processed foods 75% 33%
Soup consumption 0% 100%
Child snacks 100% 25%
Discussion
for produce on the island results in an uncertain food supply for this population. Mothers reported not always having access to the types and variety of food that they desired because the boats do not reliably ship acceptable produce to the island. Therefore, while there are high levels of food insecurity on San Cristobal, it is not necessarily because the people living there do not have enough money to buy food. Living on the island yields a baseline level of food insecurity because of the dependence on boats to bring produce.
In this population, food security was associated with dietary diversity in children; children in the most food secure households had the highest dietary diversity scores, while children in the households with very low food security reported the lowest dietary diversity. However, overall child dietary diversity on San Cristobal Island was high. Even children living in households with low food security tended to consume highly diverse diets, and children experiencing very low food security tended to consume diets classified as “medium” dietary diversity. Therefore, while food security and dietary diversity appear to be related on San Cristobal, the high rates of food insecurity do not seem to negatively impact overall dietary quality in children. Most children ate meat daily, as well as eggs and dairy products. Additionally, the vast majority of children were at a healthy weight, and there was only one case of stunting in this population. This is different from the rest of Ecuador, where the overall prevalence of stunting in children under 5 years old is 29% (WHO Global Heath Observatory). This suggests that on the whole children on San Cristobal are getting adequate nutrition, especially since overall mothers perceived their children to be healthy.
While child dietary diversity was associated with food security status, maternal dietary diversity did not fluctuate with food security status. Additionally, maternal dietary diversity was
mothers and children would have lower dietary diversity scores. Mothers reporting lower dietary diversity scores than their children in food insecure households might be due to mothers
attempting to protect their children from the effects of food insecurity; they may be consuming lower quality diets so that their children are able to maintain high quality diets. This phenomenon as has been described in previous studies (Hanson, 2007; Olson 2005).
However, it is strange that child dietary diversity increases with food security level and maternal dietary diversity does not. In households that are food secure, mothers having lower dietary diversity than their children might be due to maternal desires for weight loss. Of the nine food secure households, seven mothers reported that they wanted to lose weight. All seven of these mothers had lower dietary diversity scores than their children, while the other two mothers in this category (who did not report a desire to lose weight), had either the same or higher dietary diversity scores than their children. This suggests that the lower dietary diversity scores observed for mothers in the food secure households might be due to mothers dieting in an attempt to lose weight. This high rate of desired weight loss was also observed on Isla Isabela in the Galapagos Islands (Page, 2013).
Our study revealed an association between maternal BMI and food security status on San Cristobal Island; mothers in the highest food security level households were heavier than
food intake in order to make sure that their children get enough to eat, resulting in lower maternal BMI’s in food insecure households than in food secure households. If these mothers experienced decreased food intake while they were pregnant, it is possible that their children have a higher propensity to gain weight early in life (Hales, 2001), resulting in children from food insecure households being more likely to be overweight than children from food secure households. Decreased maternal intake during and after pregnancy in food insecure households could be the cause behind the opposing trends observed on San Cristobal Island.
Evidence of the nutrition transition can be found on San Cristobal Island when comparing the dietary patterns of the highest food security households with those of the lowest food security households. Mothers and children in households with high food security ate more processed foods, such as hot dogs and cake. Conversely, mothers and children experiencing very low food security consumed fewer processed foods, and overall their diets were more traditional, with soup, rice, vegetables and some protein being dietary staples. There was one mother and child dyad from a very low food secure household who both had high dietary diversity and consumed more traditional foods. This mother worked at a market and had access to lots of different foods, so even though the household was food insecure, they consumed high quality diets. In this population, the more food secure households seem to be shifting to western diets and away from traditional foods, while food insecure households appear to be maintaining more traditional diets.
Cristobal Island. Overall, the dietary recalls accurately reflect the types of foods consumed by mothers and children. Using dietary diversity scores to assess diet quality from a 24-hour recall has potential biases. An individual may not eat very many food groups on the day in question, but over the period of three days or a week they may consume a greater variety of foods. Therefore, it is possible that some respondents had higher-quality diets than their dietary diversity scores reflect. However, in this study dietary diversity scores were averaged and used as a basis of comparison between food security levels. For these purposes, the potential errors in dietary diversity are not of great concern. A final limitation of this study is the small sample size. While we were able to observe overall trends in food security status, dietary diversity, and BMI, our sample size does not allow for statistical analyses of significance. Therefore, it is possible that the trends we observed were due to chance. However, the interviews allowed us to go into depth with mothers on various topics, strengthening the dataset. Our sample size was sufficient for achieving our aim of qualitatively describing the food environment on San Cristobal Island.
Strengths of this study include mixed-methods analysis and in-depth interviews.
diversity between mothers and children. Our study is unique in that it is able to describe the food environment on San Cristobal Island both qualitatively and quantitatively.
Conclusion
The prevalence of food insecurity on San Cristobal Island is high among households with children under six years of age. However, this did not seriously impact the quality of children’s diets, and on the whole it appears that children on San Cristobal Island are healthy. Child dietary diversity was positively associated with food security status, but even children from food
insecure households consumed on average either medium or highly diverse diets. Maternal dietary diversity was not related to food security status, and this is likely due to dieting and the desire to lose weight. Children and mothers from food secure and food insecure households alike consumed diets that consisted of mostly rice, soup, vegetables, meat and milk. Food secure households generally reported more snacking and more processed foods than the most food insecure households. Finally, food insecurity appears to be an island-wide issue due to the uncertain quality of produce arriving from the mainland on boats.
Acknowledgements
Margaret Bentley, PhD, Faculty Advisor Beth Hopping, Graduate Student Advisor Rachel Page, Data Collection
Tom and Elizabeth Long Research Award
References
1. Bickel G, Nord M, Price C, Hamilton W, Cook J. Guide to Measuring Household Food
Security. United States Department of Agriculture, Food and Nutrition Service. 2000.
2. Centers for Disease Control and Prevention. About BMI for Children and Teens.
Accessed at: http://www.cdc.gov/healthyweight/assessing/bmi/childrens_ bmi/about_childrens_bmi.html
3. Coleman-Jensen A, Nord M, Singh A. Household Food Security in the United States in
2012. United States Department of Agriculture. 2013.
4. Daniels MC. Dietary Diversity as a measure of nutritional adequacy throughout
childhood. Dissertation, Department of Nutrition at UNC Chapel Hill. ProQuest: Ann Arbor, MI; 2006.
5. Galapagos Conservancy. 2008. Galapagos statistics. Available at:
http://www.galapagos.org/pdf/GalapagosMap.pdf
6. Guidelines for Measuring Household and Individual Dietary Diversity, version 4. FAO
Nutrition and Consumer Protection Division. 2008.
7. Hales CN, Barker DJP. The thrifty phenotype hypothesis. British Medical Bulletin.
8. Hanson KL, Sobal J, Frongillo EA. Gender and Marital Status Clarify Associations between Food Insecurity and Body Weight. American Society for Nutrition. 2007:1460-1465.
9. Isanaka S, Mora-Plazas M, Lopez-Arana S, Baylin A, Villamor E. Food Insecurity is
Highly Prevalent and Predicts Underweight but Not Overweight in Adults and School Children from Bogotá, Colombia. American Society for Nutrition. 2007 Sep:2747-2755.
10.Kant AK. Indexes of overall diet quality: A review. Journal of the American Dietetic
Association. 1996 Aug;96(8):785-791.
11.Novy JW. Incentive measures for conservation of biodiversity and sustainability: a case
study of the Galapagos Islands. UNEP, 1999.
12. Olson CM. Food insecurity in women: a recipe for unhealthy trade-offs. Topics in
Clinical Nutrition. 2005;20:321–8.
13.Page R, Bentley M, Waldrop J. People Live Here: Maternal and Child Health on Isla
Isabela, Galapagos. Social and Ecological Interactions in the Galapagos Islands. Springer Science, 2013.
14.Popkin BM. An overview on the nutrition transition and its health implications: the
Bellagio meeting. Public Health Nutr. 2002 Feb;5(1A):93–103.
15.Airmond M, Ruel MT. Dietary Diversity Is Associated with Child Nutritional Status:
Evidence from 11 Demographic and Health Surveys. The Journal of Nutrition. 2004:2579-2585.
16.UNICEF Definitions: Nutrition. Available at:
17.Waters WF. Globalization and local response to epidemiological overlap in 21st
century Ecuador. Globalization and Health. 2006;2(8):1-13.
18.Watkins G, Cruz F. Galapagos At Risk: A Socioeconomic Analysis of the Situation in the
Archipelago. Puerto Ayora, Province of Galapagos, Ecuador, Charles Darwin Foundation. 2007 May.
19.WHO BMI Guidelines. Available at:
http://apps.who.int/bmi/index.jsp?introPage=intro_3.html
20.WHO Global Health Observatory Data. Child malnutrition country estimates (WHO
global database): Children under 5 years stunted. Available at: http://apps.who.int/gho/data/node.main.1097?lang=en