by John D. Turner
A Master’s paper submitted to the faculty of the School of Information and Library Science of the University of North Carolina at Chapel Hill
in partial fulfillment of the requirements for the degree of Master of Science in
Information Science.
Chapel Hill, North Carolina November, 2000
Approved by:
November, 2000. 50 pages. Advisor: Barbara M. Wildemuth.
A survey of users of the storage request (closed stacks) service at the University of North Carolina at Chapel Hill provided data for an examination of the
differences between Internet users and in-library users of the service. Library services are being offered via the World Wide Web more frequently as the Internet becomes more popular. Libraries are faced with the challenge of
marketing Internet services so that patrons accept and use these new services as more traditional services are discontinued. Users were surveyed about their opinions and habits concerning the storage request service. The study found that while user sex did not indicate which method was used, age and access to the library were indicators of service method used. Additionally, promotion of service and user training were determined to be the most effective means of increasing Internet service use. Further study of specific strategies to increase adoption of Internet services is recommended.
Headings:
Accessibility Adoption - user
Introduction ... 1
Review of Previous Research... 3
Research Questions ... 8
Methodology... 10
Results ... 17
Discussion... 27
Conclusion... 32
Acknowledgements ... 34
References... 35
Appendices Appendix A: Survey Appendix B: Cover Letters Appendix C: Survey Response Details Appendix D: Responses Based on Request Method Appendix E: Open-ended Survey Responses Tables & Figures Table 1. Request Method Used... 18
Table 2. Sex by Request Method ... 20
Table 3. Mean Age by Request Method ... 20
Table 4. Catalog Search Location by Request Method... 21
Table 5. Frequency in the Library by Request Method... 22
Table 6. Reason for Using the Paper Form ... 23
Table 7. Reasons for Using the Internet Form... 25
Table 8. Reasons for Switching to Internet Form... 26
Figure 1. Number of Requests Made... 18
Introduction
Library services have changed greatly during the past two decades. Computers and network technology have played a major role in this
transformation. Examples of how this technology has effected library services are pervasive. Online public access catalogs (OPACs) have replaced the card catalog; librarians can answer reference questions via electronic mail as well as through more traditional communication; and requests for closed stacks and interlibrary loan items, once submitted using a paper form can now be submitted using the Internet and web accessible databases.
Mooer’s Law states that “an information retrieval system will tend not to be used whenever it is more painful and troublesome for a customer to have the information than for him not to have it” (1960, ii). This should also be true for library services offered via the World Wide Web (WWW).
Preferences and attitudes strongly influence whether a potential consumer opts to use a resource, or which one he chooses if there are several options
As new online services become available, libraries are faced with the challenge of promoting these systems and increasing their use as the traditional services and resources they replace are phased out. Failing to convince users to switch to new library services will result in unsatisfied patrons as traditional services are retired or no longer available. In addition, by persuading users to switch to online systems, libraries will be better able to maximize the utility of the funds spent to acquire and maintain these new resources.
Review of Previous Research
Many studies pertaining to user adoption of new technology exist in the library literature. This research can be divided into two broad areas, perceived accessibility and diffusion of innovations.
Perceived Accessibility
Accessibility can have many facets. McCreadie and Rice (1999) identified several influences of accessibility to information, including physical, cognitive, and affective (attitude, confidence) constraints. Each of these constraints play a role as the user determines if an information source is accessible.
The literature contains several studies of perceived accessibility and its effect on resources use. From the results of this research, it appears that measures to increase awareness of system capabilities, like promotion of services and training programs for users of electronic services, may help avoid a lack of use due to lack of knowledge and overestimation of system difficulty.
Culnan (1985) performed a field study of undergraduate students,
graduate students, and information professionals to determine the dimensions of perceived accessibility affecting these groups. The author concluded that
Abels, Liebscher, and Denman (1996) conducted an experiment examining the factors that contributed to the adoption (use versus non-use) of network services. The researchers distributed self-reporting questionnaires to faculty at small universities (defined as having an enrollment of less than 4,000
undergraduate students) with science or engineering programs and an existing Internet connection. After analyzing the questionnaires and conducting follow-up interviews, the authors found that access was the biggest determinant of network use, and that users were less likely to begin using a service if perceived accessibility was low.
Kaminer (1997) conducted a survey of university faculty comparing their Internet use with several variables including perceived skill using the Internet and perceived utility of the Internet. The results indicated that Internet usage was positively correlated to perceived expertise and perceived utility.
Loh and Ong (1998) studied adoption of an Internet-based stock trading in Singapore. The researchers were interested in potential users’ perceptions and attitudes toward the new system. They found that whether or not a user accepted the new system was dependent on his perceptions, such as ease of use, of the system.
perceived accessibility of the Internet was lowered due to a belief that they needed to possess a higher knowledge and understanding of the technology.
Diffusion of Innovation
There are also several use studies on the topic of use of new technology and user preferences. Most of these are based on diffusion theory (Rogers, 1995), which explains why certain innovations and new ideas become pervasive and others remain relatively unknown. Others compare use of the online resource and the system being replaced, or have tried to discover what factors, if any, contribute to underuse of online and network services.
Diffusion of innovation concerning library services does appear in the literature. Unfortunately, much of this research deals with the library as an organization and its adoption of new technologies rather than with patrons and their adoption of new services (Damanpour & Childers, 1985; Willard, 1991).
Starkweather and Wallin (1999) led focus group discussions and conducted interviews of faculty at the University of Nevada, Las Vegas in an attempt to understand the needs and viewpoints of that group in relation to their adoption of library technology. In their discussions, the participants suggested several ways that the library might increase use of new technology. Chief among these suggestions was training classes and web-based tutorials.
Alexander and Gyeszly (1991) examined the motives of library patrons at Texas A&M University who continued to use the traditional card catalog system even after the advent of an OPAC. They surveyed patrons asking questions about use habits and reasons for continuing to use the paper card system. A notable finding of the study was that the authors’ presumptions concerning use and user age were incorrect based on the results. Where they expected the oldest age group to be the largest users of only the traditional catalog system, they instead discovered that the 18-25 age group was the largest segment of card-catalog-only users. In addition, the authors discovered that the main reason for not using the OPAC was they did not have any OPAC instruction.
Savolainen (1999) surveyed WWW users in Finland about their work-related and leisure use and adoption of the Internet compared to other
Research Questions
This study seeks to shed light on user preference of service type by questioning patrons about their opinions and use of a library storage request service where requests can be made by submitting a paper form at the library or by submitting an electronic request over the Internet. Specifically, the research seeks to address the following questions:
Question 1: What are the demographics of those who prefer the Internet form (web-based service) vs. the paper form (in-library service)?
Question 2: Are patrons who have greater access to a particular request method more likely to use that method than an alternate method?
Question 3: For what reasons do patrons use one form of the service over the other?
The second question looks at accessibility and availability of the service. Faibisoff and Ely state that people with information needs will use what is most accessible to them (1976). Culnan identified a physical component to
accessibility, being able to enter the library, for example (1985). Based on these statements, it is expected that those with greater access to one request method will use it more than the other method. For instance, a library patron with little access to the Internet would be unlikely to use the Internet form; whereas a patron who does not physically go to the library often would seem unlikely to make many requests using the paper form.
Methodology
The research was conducted on the campus of the University of North Carolina at Chapel Hill during the 2000 fall semester. Users of the storage request service were surveyed about their opinions and previous use of one or both forms of the service. Data analysis included a description of the survey responses and the comparisons indicated by the three research questions.
Research Setting
The University of North Carolina at Chapel Hill (UNC-CH) is a four-year, public university located in the central piedmont of North Carolina. UNC-CH has a current estimated enrollment of 24,180, including 8,780 graduate and professional students. There are just over 2,400 faculty teaching and conducting research at the University (University of North Carolina at Chapel Hill [UNC-CH], 2000b).
The University’s main library system consists of several departmental libraries and other special collections. The Walter R. Davis Library is the central library facility of the system and is the location of the system’s main reference, interlibrary borrowing, and storage request services (UNC-CH, 2000a).
The Storage Request Process
located in these closed stacks storage facilities are listed in the catalog and available for use by library patrons, but must be requested from the Davis Library Circulation Department and retrieved by library staff.
Patrons that want to request an item from storage may submit their request using one of two methods. The first method is to complete an item
request using a paper form and submit the request by presenting it to Circulation Department staff. The paper form is available only at the Davis Library
Circulation Department. The second method is to complete an item request using a form available on the Internet and submit it electronically to Circulation
Department staff. The Internet request form has been in use since January, 1998, and use of the two methods has been approximately 70% - 30% in favor of the paper form (Whichard, 2000).
Patrons are instructed at the time they place a request that the materials requested from storage will be available within 72 hours after submission of the request. In general, patrons are not contacted by library staff concerning a
not make an unnecessary trip to the Library, and so that a more thorough search for the item can be initiated if the patron so desires.
Comparison of Request Methods
The two methods have many similarities, but are not identical. Both the paper and web request forms ask the patron for contact information including name and telephone number, but the electronic form also has a field for the patron’s e-mail address. Both methods have fields for information about the requested item including call number, title, volume, author, and year; however the electronic form additionally asks for page numbers in cases where the item is part of a serial. The electronic form allows the patron to request up to five titles per submission, while each item requested using the paper method must be on individual request forms. There are instructions for submitting requests on the Internet form, but not on the paper form.
The process of completing the Internet form is more regimented than that of the paper form. For example, use of the electronic form is restricted to only those patrons with borrowing privileges. Access to the form is denied if the user does not input a valid identification number. Also, required fields such as patron name, telephone number, and item title are identified on the web form. If no data is
A final difference between the two methods is the ability to direct where to send a item after it is retrieved from storage. The paper form list no explicit way for the patron to specify that the requested item be sent to another campus library for pickup. The implication is that all paper form requests will be picked up at Davis Library. The Internet form allows the user to choose pickup location from a list of campus libraries.
Sample Population
Participants for the study were selected from the archived requests of previous users of the storage request service. A sample of 184 users was drawn in mid-September, 2000. This sample included every patron who had used either form of the service at least once during the academic semester. Although earlier data was available, because of the transitory nature of the user population, only those who used the service during the current semester were selected for the sample. It was assumed that this sampling strategy would achieve higher
response rates by increasing the likelihood that the patron was still a member of the University community.
other academic institutions. Both men and women would be included in the sample. Finally, the minimum age of the participants would not be less than seventeen.
Survey Instrument
This research study sought to survey a sample of storage request users and gather data about their opinions of the service and prior use habits. The purpose of the two-page, ten-question survey was to find out why patrons chose one method over the other. No questions were asked concerning the titles or types of materials requested. The survey is presented in Appendix A.
Procedures for Distributing the Surveys
Contact information for the members of the sample group was gathered using the UNC-CH online directory and the Library’s borrower database. After the sample was compiled, each person was assigned a unique identification number. This number served as a tracking number during the data collection phase and a subject number during the data recording and analysis phase.
During the last week of September, members of the sample were mailed the survey along with a cover letter explaining the purpose of the research study and asking them to participate, and an envelope to return the survey. The
surveys were sent via UNC-CH campus and US mail. Distribution of the survey by regular mail was preferred over e-mail because the former method was seen as being more accessible to all of the subjects regardless of which request method they used.
A second mailing was issued to those who had not yet responded two weeks after the first letters were mailed. As with the original mailing, a cover letter and self-addressed stamped envelope were included. The cover letters for the two mailings appear in Appendix B.
Data Analysis
Results
A total of 132 people responded to the survey, a response rate of 71.7%. Of this total, 109 responded to the original mailing, with the remaining 24 returning the survey from the second mailing. Of the 132 surveys returned, 4 were
unusable. Two of the surveys were deemed unusable because they were only partially complete and contained no use data or demographic information. One survey was not counted because the respondent returned the survey saying he had not used the storage request service. The remaining survey was omitted because the participant was a library employee. The 128 surveys translate into a usable return rate of 69.6%.
The ratio of men and women who responded to the survey was somewhat evenly split. Of the respondents, 72 (56.3%) were men, and 56 (43.8%) were women. The ages of those who returned the questionnaire ranged from 19 to 79. The average age was 37.13, with a median and mode of 31. Exactly half of the 128 whose surveys were used were graduate students. Faculty were the next largest group to respond. The 29 faculty members accounted for 22.7% of the users. The remaining groups, undergraduates, staff, and “others,” were divided fairly equally. Appendix C presents the details of the demographic results of the study, as well as the details of the responses to the rest of the survey.
use mainly the Internet form. Ten of the participants stated that they use both methods equally. Exact frequencies and percentages are reported in Table 1.
TABLE 1. Request Method Used.
Response Frequency Percent
Used mainly the paper request form 74 57.8% Used mainly the Internet request form 44 34.4% Used both methods (1 and 2) about the same 10 7.8%
Total 128 100.0%
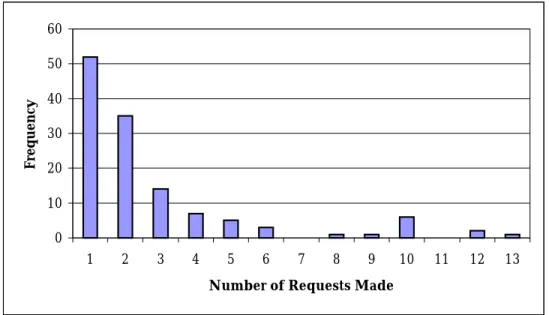
The number of requests made by participants in the study ranged from 1 to 13, with a mean of 2.75. As Figure 1 shows, the number of requests made for the entire sample was skewed heavily toward the low end of the distribution.
0 10 20 30 40 50 60
1 2 3 4 5 6 7 8 9 10 11 12 13
Number of Requests Made
Frequency
FIGURE 1. Number of Requests Made (Histogram).
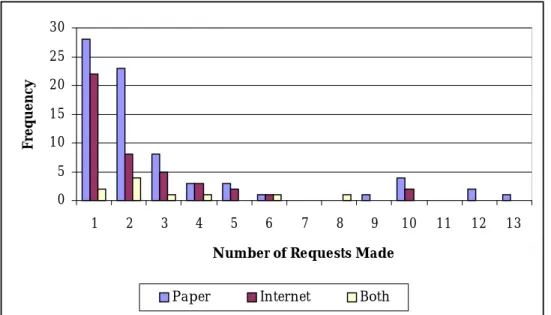
skewed characteristics found in the entire sample. The means for the groupings were 2.93 for paper form users, 2.35 for Internet users, and 3.10 for those who use both methods. The means are not significantly different based on a one-way ANOVA of request method used (F=0.735, 2 df, p=0.482).
0 5 10 15 20 25 30
1 2 3 4 5 6 7 8 9 10 11 12 13
Number of Requests Made
Frequency
Paper Internet Both
FIGURE 2. Number of Requests Made by Request Method Used (Histogram).
Question 1: What are the demographics of those who prefer the Internet form (web-based service) vs. the paper form (in-library service)?
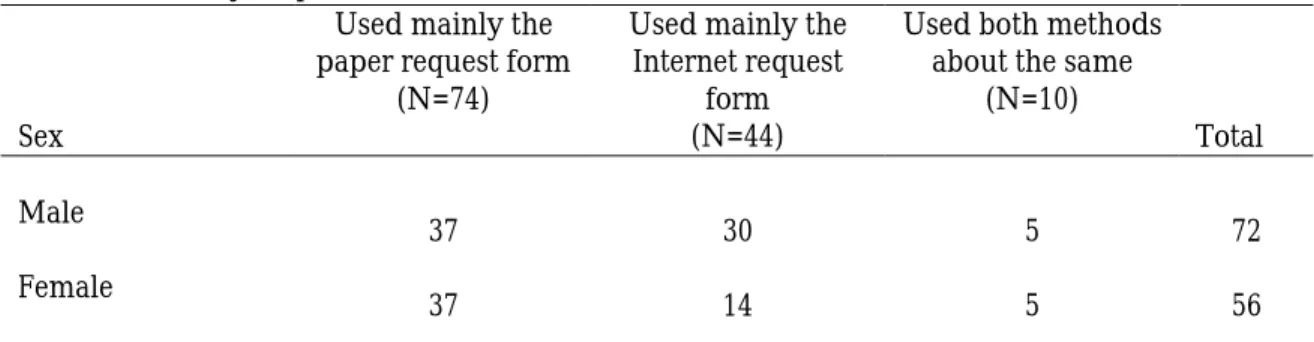
Although the number of men who responded that they use the Internet form was more than twice that of women with the same
TABLE 2. Sex by Request Method.
Sex
Used mainly the paper request form
(N=74)
Used mainly the Internet request
form (N=44)
Used both methods about the same
(N=10)
Total
Male
37 30 5 72
Female
37 14 5 56
The mean age of the respondents using each form of the service is shown in Table 3. An ANOVA demonstrated a significant relationship between the mean age of those who use mainly the paper form and those who use the Internet form (F=4.609, 2 df, p=0.012). The mean age for the two groups was 40.41, and 32.34, respectively. The mean age for the group that used both methods about the same was 34.20. Based on a post-hoc Scheffé test, no significant difference (at a 0.05 level of significance) was found between the mean of group that used both methods when
compared to either of the other two group means.
TABLE 3. Mean Age by Request Method. Used mainly the paper
request form (N=74)
Used mainly the Internet request form
(N=43)
Used both methods about the same
(N=10) Mean
40.41 32.34 34.20
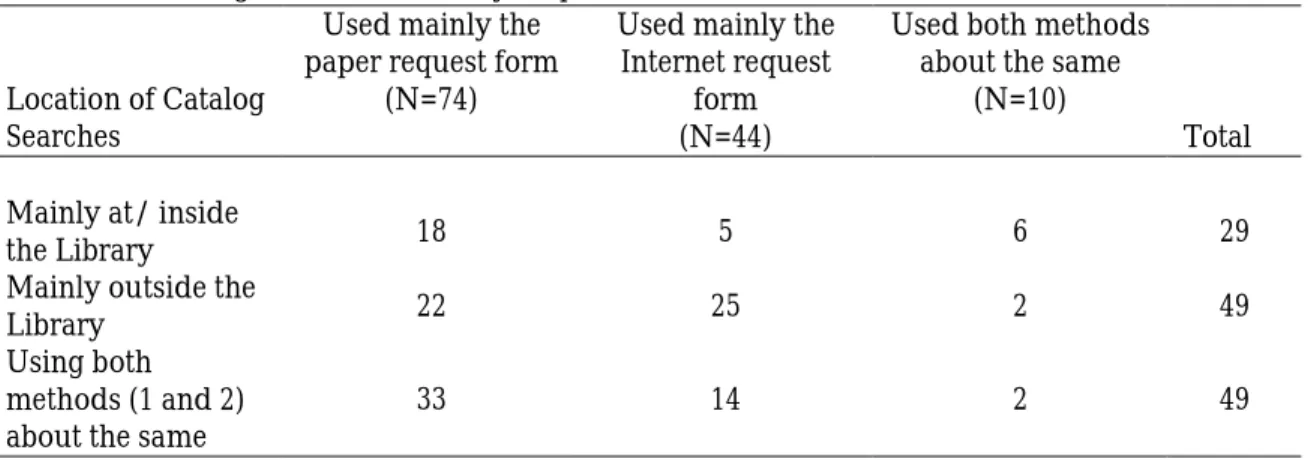
Question 2 of the survey asked participants where they do their catalog searching for materials. A more than 3-to-1 majority of respondents who said they use the paper request form also said they searched the catalog at Davis Library (see Table 4). Likewise, a small majority of Internet form users stated that they search the catalog outside of the Library. Where the participant searches the Library catalog does appear to be related to the request method used (x²=16.974, 4 df, p=0.002). 1
TABLE 4. Catalog Search Location by Request Method.
Location of Catalog Searches
Used mainly the paper request form
(N=74)
Used mainly the Internet request
form (N=44)
Used both methods about the same
(N=10)
Total
Mainly at/ inside
the Library 18 5 6 29
Mainly outside the
Library 22 25 2 49
Using both methods (1 and 2) about the same
33 14 2 49
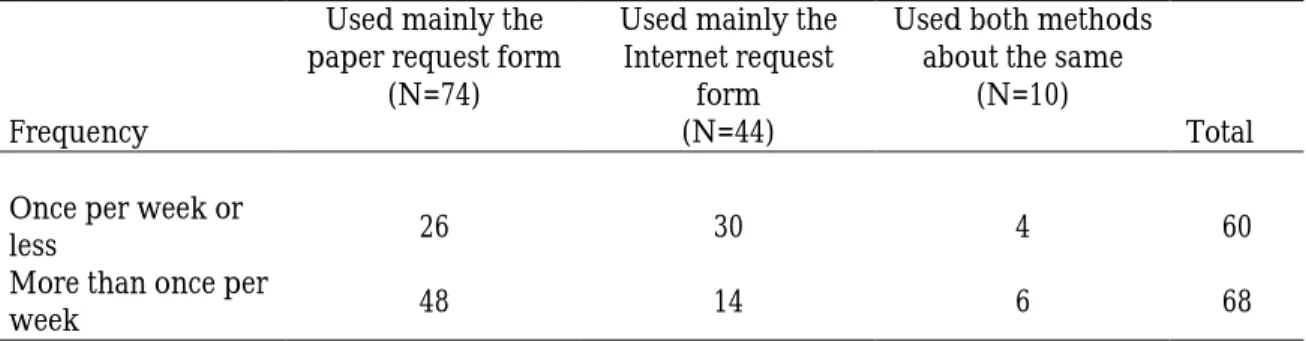
Question 1 of the survey gave the participants seven choices to describe how often they come to Davis Library. This detailed division of use also resulted in several empty cells in the tabular results for comparing this variable to which request method was used (see detailed table in Appendix D). To remedy this situation, the seven choices to describe how often participants come to the Library were merged into two categories. The new variable options were “Once per week or less” and “More than once per week.” The analysis of these
aggregated categories indicates that how often the participant comes to the Library does appear to be related (x²=12.307, 2 df, p=0.002) to which method is used to make a request from storage (see Table 5). In particular, those who are in the Library very frequently (more than once per week) are very likely to use the paper request form.2
TABLE 5. Frequency in the Library by Request Method.
Frequency
Used mainly the paper request form
(N=74)
Used mainly the Internet request
form (N=44)
Used both methods about the same
(N=10)
Total
Once per week or
less 26 30 4 60
More than once per
week 48 14 6 68
Question 3: For what reasons do patrons use one form of the service over the other?
Questions 5 through 7 attempt to corroborate the above findings. In addition, the questions were designed so that they might shed some additional light on the motives and reasons participants use a particular request method.
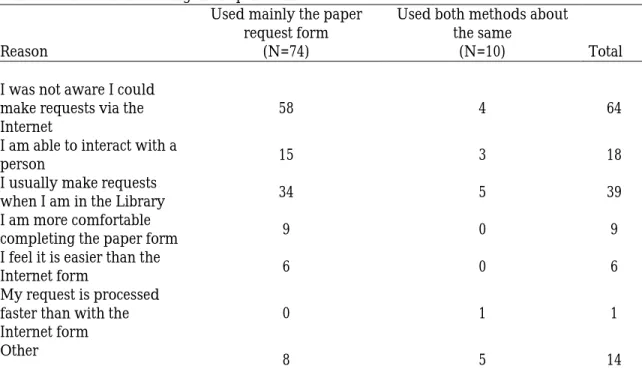
Question 5 of the survey asked those who use the paper form to state their reasons for using that method to make requests. Of the 74 subjects who said they use mainly the paper form, 58 (78.4%) also said that they did not know that the Internet method existed (see Table 6). The next most selected reason was that the patrons stated that they make requests when in the Library. Thirty-four (46.0%)
chose this as a reason for using the paper form. Of the remaining responses, 15 cited that they were able to interact with a person (and one subject also stated that by using the paper form he knew the request had been received), 9 felt more comfortable completing the paper form, and 6 said they believe the paper form is easier to complete. None of the 74 participants expressed a belief that the paper form resulted in faster retrieval of the item.
TABLE 6. Reasons for Using the Paper Form.
Reason
Used mainly the paper request form
(N=74)
Used both methods about the same
(N=10) Total
I was not aware I could make requests via the Internet
58 4 64
I am able to interact with a
person 15 3 18
I usually make requests
when I am in the Library 34 5 39
I am more comfortable
completing the paper form 9 0 9
I feel it is easier than the
Internet form 6 0 6
My request is processed faster than with the Internet form
0 1 1
Other
8 5 14
Notes:
1. Column totals may be greater than the number of respondents in that group because participants were allowed to choose more than one response option.
2. In spite of the fact that Question 5 explicitly referred to the paper form, three of the participants who mainly use the Internet form responded to this question.
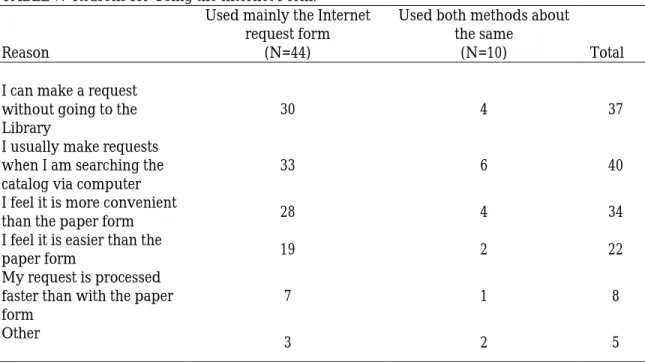
were able to interact with a person, and one participant indicated the belief that the paper request was processed faster than the Internet request.
TABLE 7. Reasons for Using the Internet Form.
Reason
Used mainly the Internet request form
(N=44)
Used both methods about the same
(N=10) Total
I can make a request without going to the Library
30 4 37
I usually make requests when I am searching the catalog via computer
33 6 40
I feel it is more convenient
than the paper form 28 4 34
I feel it is easier than the
paper form 19 2 22
My request is processed faster than with the paper form
7 1 8
Other
3 2 5
Notes:
1. Column totals may be greater than the number of respondents in that group because participants were allowed to choose more than one response option.
2. In spite of the fact that Question 6 explicitly referred to the Internet form, seven of the participants who mainly use the paper form responded to this question.
The subjects who use both methods selected their reasons in the same order as the Internet request users. Like above, the most cited reason was that they stated they use the Internet form because they make requests while
searching the catalog via computer, followed by the fact that they do not have to be in the Library and that the Internet form was the more convenient.
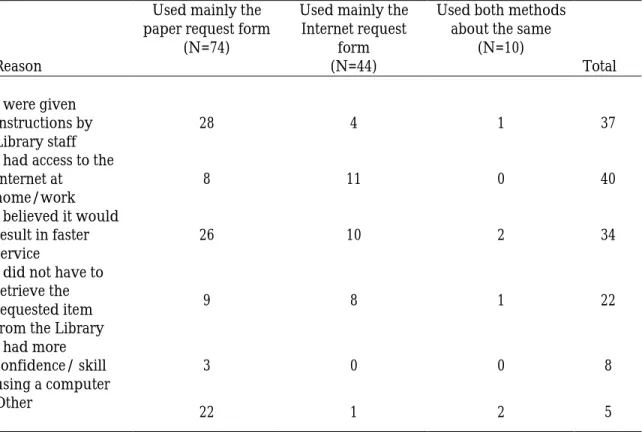
line, an additional 3 participants indicated that they would use the Internet form if they had more confidence using a computer. After a desire for training, the next most popular reason to switch was faster service. Twenty-six of this group (35.1%) indicated they would switch methods if they received materials more quickly. Many of this group listed an “Other” reason to switch, but most of these were simply reiterations of the fact that they were unaware of the Internet
method (see Appendix E for details). Finally, 9 of the subjects stated they would switch if they did not have to retrieve the requested item from the Library, while 8 said they would use the Internet if they had access to the Internet at
home/work.
TABLE 8. Reasons for Switching to Internet Form.
Reason
Used mainly the paper request form
(N=74)
Used mainly the Internet request
form (N=44)
Used both methods about the same
(N=10)
Total
I were given instructions by Library staff
28 4 1 37
I had access to the Internet at
home/work
8 11 0 40
I believed it would result in faster service
26 10 2 34
I did not have to retrieve the requested item from the Library
9 8 1 22
I had more confidence/ skill using a computer
3 0 0 8
Other
Discussion
The first research question, concerning the demographic characteristics of the users of each method, returned mixed results. Comparison of the requests method used based on sex revealed no significant difference. As mentioned earlier this seems to match current Internet use trends, and the idea that women are less likely to use the Internet and technology may be out of date (Crockett, 1999). Comparison of the mean age of the participants based on request method does yield significant differences between the groups who mainly use just one request method, although the mean age of those participants who use both methods was not significantly different from the means of the other two groups. The average age of the Internet request user is more than eight years younger than that of the paper request user. This study would appear to vindicate the assumptions concerning age and use of technology made by Alexander and Gyeszly (1991) that were not exhibited in their earlier study of OPAC use.
paper form users indicated that they would use the Internet form if they had access to the World Wide Web from work or home.
Faibisoff and Ely (1976) state that information seekers often rely on face-to-face communication when attempting to retrieve information. The results of this study appear to support their assumption to a certain degree. A few
participants did indicate that they used the paper form because it allowed them to interact with a person. However, only 3 of those who use both methods, and less than 20% of the paper form users pointed to this as a reason they use the paper request method. Reliance on face-to-face communication did not appear to be as important as other issues surrounding use. For both of these groups,
location and the fact that they usually make requests while in the Library were more important factors of use.
C), formal instruction of request service users would appear to be an inefficient use of staff and classroom resources.
Another important finding of the study was that the vast majority of those who make requests using the paper form did not know that they could make a request via the Internet. Almost 80% of paper form users in the study were unaware of the Internet request form. Furthermore, eight participants who use the paper form went on to say that now that they were aware of the Internet form, they would use that method to make future requests. Clearly, the results suggest that spending resources to promote new services is worthwhile.
Problems
This study, like any other research endeavor, has shown the researcher that changes could be made to improve the validity of the results of a future study. The two main problems with the study concern the content of the survey and the categorization of the results.
The survey was pre-tested on several people including Library staff. However, respondents still seemed to be confused by some of the questions. For instance, Question 5 asked subjects why they used the paper request form. Of the 44 participants who said that they used the Internet form, 2 also indicated that they were not aware that they could make requests via the Internet. Likewise, 4 of the 10 respondents who claimed to use both methods also indicated that they did not know the Internet request form existed. These errors could be attributed to a lack of thoroughness or some confusion on the part of the respondent. Also, several participants used the “other” free text field to reiterate that they were unaware of the Internet request method.
The inclusion of a third category for participants who use both methods led to problems with the tests of statistical significance. Because only 10
Conclusion
Advances in technology are changing practices and services for a variety of businesses and institutions. Libraries are not immune to these changes. In the last two decades, card catalogs have been replaced by computer databases, and the advent of the Internet has created a virtual world where traditional library services can be offered in a new way. As libraries begin to offer traditional services using new technology it will be increasingly important to discover and implement new strategies to help these revamped services gain wide use and acceptance. By doing this, these institutions will be able to more effectively use resources as they service their patrons. The first step in the process of developing strategies to increase service use is to identify characteristics and behaviors of those who will be using the services.
Acknowledgements
Several people deserve recognition for their assistance with this research study. Without their aid and counsel this paper could not have been written.
I want to thank the staff of Davis Library and the Circulation Department. In particular I want to recognize Patrick Mullin, Mitchell Whichard, Ryan Wade, and David Peterson. Pat and Mitch were gracious enough to allow me to conduct the study of the storage request service. In addition, Mitch, Ryan, and David were extremely helpful to me as I researched the storage request service and collected subjects for the sample.
I also want to thank my advisor, Barbara Wildemuth. Dr. Wildemuth was always available to help me with questions about the study and to point me in the right direction as I collected and analyzed the data.
References
Abels, E.G., Liebscher P., & Denman D.W. (1996). Factors that influence the use of electronic networks by science and engineering faculty at small
institutions. Part I. Queries. Journal of the American Society for Information Science, 47(2), 146-158.
Alexander, B.A., & Gyeszly, S.D. (1991). OPAC or card catalog: Patrons
preference in an academic library. Technical Services Quarterly, 9(1), 43-56. Anderson, S.E. & Gansneder, B.M. (1995). Using electronic mail surveys and
computer-monitored data for studying computer-mediated
communication systems. Social Science Computer Review, 13(1) 33-47. Crockett, R. O. (1999, March 22). A web that looks like the world. Business Week,
3621, EB46.
Culnan, M.J. (1984). The dimensions of accessibility to online information: Implications for implementing office information systems. ACM Transactions on Office Information Systems, 2(2), 141-150.
Culnan, M.J. (1985). The dimensions of perceived accessibility to information: Implications for the delivery of information systems and services. Journal of the American Society for Information Science, 36(5), 302-308.
Damanpour, F., & Childers, T. (1985). The adoption of innovations in public libraries. Library and Information Science Research, 7(3), 231-146.
Edmondson, B. (1997). The wired bunch. Online surveys. American Demographics, 19(6), 10-14.
Faibisoff, S.G., & Ely, D.P. (1976). Information and information needs. Information Reports and Bibliographies, 5(5), 270-284.
Kaminer, N. (1997). Scholars and the use of the Internet. Library and Information Science Research, 19(4), 329-345.
Klobas, J.E. & Clyde, L.A. (2000). Adults learning to use the Internet: a
longitudinal study of attitudes and other factors associated with intended Internet use. Library and Information Science Research, 22(1), 5-34.
Loh, L. & Ong, Y.S. (1998). The adoption of Internet-based stock trading: a conceptual framework and empirical results. Journal of Information Technology, 13(2), 81-94.
McCreadie, M. & Rice R.E. (1999). Trends in analyzing access to information. Part I: Cross-disciplinary conceptualizations of access. Information Processing and Management, 35(1), 45-76.
Mooers, C.N. (1960). Mooer’s law, or why some retrieval systems are used and others are not. American Documentation, 11(3), ii.
Pitkow, James E. (1996) Emerging trends in the WWW user population. Communications of the ACM, 39(6) 106-108.
Rogers, E.M. (1995). Diffusion of Innovations (4th ed.). New York: The Free Press.
Savolainen, R. (1999). The role of the Internet in information seeking. Putting the networked services in context. Information Processing and Management, 35(6), 765-782.
Starkweather, W.M., & Wallin, C.C. (1999). Faculty response to library technology: Insights on attitudes. Library Trends, 47(4), 640-668.
Steynberg, S. (1989). Availability and accessibility as parameters in measuring the document delivery capability of an academic library. South African Journal of Library and Information Science, 57(4), 372-377.
University of North Carolina at Chapel Hill. (2000a, March 13). About the Main Library System. Chapel Hill, NC. Retrieved October 28, 2000, from the World Wide Web: http://www.lib.unc.edu/aboutmain.html.
University of North Carolina at Chapel Hill. (2000b, September 25). UNC-Chapel Hill: Quick Facts About Carolina. Chapel Hill, NC. Retrieved October 28, 2000, from the World Wide Web:
Whichard, Mitchell. Personal correspondence, September 27, 2000.
Appendix A
Appendix B
Appendix C
Survey Response Details
1. In the past three months, how often have you come to Davis Library?
Response Frequency Percent
1. Less than once per month 15 11.7%
2. Once per month 9 7.0%
3. 2 to 3 times per month 18 14.1%
4. Once per week 18 14.1%
5. 2 to 6 times per week 50 39.1%
6. Every day 7 5.5%
7. More than once per day 11 8.6%
Total 128 100.0%
2. In the past three months, I have conducted library catalog searches
Response Frequency Percent
1. Mainly at/inside the Library 29 22.7%
2. Mainly outside the Library 49 38.3%
3. Using both methods (1 and 2) about the same 49 38.3%
Missing values 1 0.8%
Total 128 100.0%
3. In the past three months, I have made ______ requests from storage.
Number of Responses 127
Missing 1
Minimum Value 1
Maximum Value 13
Mean 2.75
4. When making requests for items from storage in the past, I have
Response Frequency Percent
1. Used mainly the paper request form 74 57.8% 2. Used mainly the Internet request form 44 34.4% 3. Used both methods (1 and 2) about the same 10 7.8%
Total 128 100.0%
5. I make requests using the paper form because.
Response Frequency* Percent
1. I was not aware I could make requests via the Internet 64 50.0%
2. I am able to interact with a person 18 14.1%
3. I usually make requests when I am in the Library 39 30.5% 4. I am more comfortable completing the paper form 9 7.0% 5. I feel it is easier than the Internet form 6 4.7% 6. My request is processed faster than with the Internet
form 1 0.8%
7. Other 14 10.9%
6. I make requests using the Internet form because
Response Frequency* Percent
1. I can make a request without going to the Library 37 28.9% 2. I usually make requests when I am searching the
catalog via computer 40 31.3%
3. I feel it is more convenient than the paper form 34 26.6% 4. I feel it is easier than the paper form 22 17.2% 5. My request is processed faster than with the paper
form 8 6.3%
6. Other 5 3.9%
7. I would make requests using the Internet form if
Response Frequency* Percent
1. I were given instructions by Library staff 33 25.8% 2. I had access to the Internet at home/work 19 14.8% 3. I believed it would result in faster service 38 29.7% 4. I did not have to retrieve the requested item from the
Library 18 14.1%
5. I had more confidence/skill using a computer 3 2.3%
6. Other 25 19.5%
8. Your Sex.
Response Frequency Percent
1. Male 72 56.3%
2. Female 56 43.8%
Total 128 100.0%
9. Your present age: ______ Years Number of Responses 127
Missing 1
Minimum Value 19
Maximum Value 79
Mean 37.13
Median 31 Mode 31 Standard Deviation 14.69
10. Your UNC Status.
Response Frequency Percent
1. Undergraduate Student 13 10.2%
2. Graduate Student 64 50.0%
3. Staff 11 8.6%
4. Faculty 29 22.7%
5. Other 11 8.6%
Appendix D
Responses Based on Request Method Used (Tables not included in text)
QUESTION 1. Frequency in Davis Library (all categories) 4-1. Used
mainly the paper request
form (N=74)
4-2. Used mainly the Internet request
form (N=44)
4-3. Used both methods about
the same (N=10)
Total 1-1. Less than
once per month 2 12 1 15
1-2. Once per
month 2 6 1 9
1-3. 2 to 3 times
per month 11 7 0 18
1-4. Once per
week 11 5 2 18
1-5. 2 to 6 times
per week 36 10 4 50
1-6. Every day
3 4 0 7
1-7. More than
once per day 9 0 2 11
QUESTION 3. Number of Requests Made 4-1. Used mainly the
paper request form (N=74)
4-2. Used mainly the Internet request form
(N=43)
4-3. Used both methods about the
same (N=10) Mean
QUESTION 10. UNC-CH Status
4-1. Used mainly the paper request
form (N=74)
4-2. Used mainly the Internet request
form (N=4)
4-3. Used both methods about
the same (N=10
Total 10-1
Undergraduate Student
9 4 0 13
10-2. Graduate
Student 30 27 7 64
10-3. Staff
7 2 2 11
10-4. Faculty
21 8 0 29
10-5. Other
Appendix E
Open-ended Survey Responses
Note: All responses were transcribed exactly as they appeared on the surveys.
QUESTION 5. I make requests using the paper form because Subject
Number Other Response Given in Question 5
3 My first attempt to use the Internet form was unsuccessful. There was evidently a processing error.
11 Couldn’t get to terminal.
25 Gives me a chance to get up from my workstation (or a good excuse to do so).
32 Don’t know how to do Internet one.
36 I know for sure my request has been received. 51 I've switched to online only.
56 The library desk person handed it to me.
72 I became aware of books in storage while in the library. 83 I looked in could not find how to.
97 More customized than Internet form. 116 It is easier, less stressful.
125 I could not locate the call address. 161 Was convenient at the time. 169 I received the requested book.
QUESTION 6. I make requests using the Internet form because
Subject
Number Other Response Given in Question 6
8 I didn’t know the paper form was still and option.
63 I also believe it helps the Library save $, although I don't know whether this is true. - I also feel there's less chance of my request getting lost.
82 I had no idea there was a paper form, but I would still choose online option.
105 Will do so in the future.
139 I am @ the Institute of Marine Science in Morehead City and have to use the Internet.
QUESTION 7. I would make requests using the Internet form if
Subject
Number Other Response Given in Question 7
4 If I would be notified that the item had been retrieved from storage. 9 I didn't know about it until now - I will start using the Internet. I did
learn about ILL requests on the Web because now this is the only way to make a request - fine by me.
21 Now I know it exists I’ll use it! 27 If I knew it existed, as I do now.
56 I do not prefer it over the paper form - I have no opinion.
59 I wasn't even aware of the storage facility, so paper request was made after I was instructed to do so.
72 Needed something in storage.
82 Question is unclear - is this implying that there are currently barriers using Internet forms, and I would them "if only" need could be overcome? Because I have Internet access from home.
86 Could speak to a librarian for advice on searching, recommendations, etc.
95 Knew it existed.
106 Impossible to use paper - I dislike Internet. 111 I had known about it.
118 I did not have to complete so many lines on the forms. Need a shorter form.
123 Knew where to find it.
124 Option 1. Brief written instructions would be sufficient. 126 I need to make more request from home.
128 I knew it was possible.
141 I thought of it while I was online.
152 I had more confidence in the Circulation Staff.
157 I was searching from home and came across an item in storage I needed.
162 I knew I could.
165 If I had seen the option on the library website or if staff at Circulation desk had mentioned it.
169 (If) I received the requested book. I did not receive four different books even though four Internet forms were apparently successfully submitted, I received all four books using the paper form. My other UNC status may be the problem.