This study looks at Bureau of Labor Statistics data from 1997-2009 for the occupational classification “Librarian” and attempts to identify trends among librarian employment, total national employment and national population data. The librarian employment statistics are categorized into special, academic, government, and school librarians and compared to each other as well as national employment and population figures. While national employment began to dip sharply in 2008, total librarian employment did not reflect as sharp a fall. Librarian employment had seen steady growth since 2005, although in 2008 their numbers did began to fall. Regardless of said growth, librarian job growth has not kept pace with the national population growth over the 13 years studied. The study closes with a discussion speculating as to why trends are so difficult to identify, and how librarian educators can respond to the seeming lack of job growth in the industry.
Headings:
Librarians -- Careers
Librarians -- Supply and Demand Education for Librarianship
A STUDY OF LIBRARIAN EMPLOYMENT TRENDS FROM 1997-2009
by
Rachel Charlotte Lerner
A Master's paper submitted to the faculty of the School of Information and Library Science of the University of North Carolina at Chapel Hill
in partial fulfillment of the requirements for the degree of Master of Science in
Library Science.
Chapel Hill, North Carolina April, 2010
Approved by:
Table of Contents
TABLE OF FIGURES...2
INTRODUCTION ...3
THIS STUDY ...3
BACKGROUND ...4
THE ’70S ...5
THE ’80S ...7
CURRENT STUDIES ... 10
WHY STUDY THIS? ... 13
METHODOLOGY ... 15
ABOUT THE DATA... 15
GATHERING AND GROUPING THE DATA ... 19
NORMALIZING THE DATA... 22
RESULTS ... 23
TOTAL LIBRARIAN EMPLOYMENT AND POPULATION ... 23
SPECIAL LIBRARIANS ... 27
ACADEMIC LIBRARIANS ... 29
SCHOOL LIBRARIANS ... 31
GOVERNMENT LIBRARIANS (INCLUDING PUBLIC LIBRARIANS) ... 33
DISCUSSION ... 35
DISCUSSION OF THE DATA ... 35
FUTURE RESEARCH ... 40
REFERENCES ... 43
APPENDICES ... 47
APPENDIX A:SICSTRUCTURE EXAMPLE ... 47
APPENDIX B:NAICSCODE STRUCTURE EXAMPLE... 48
APPENDIX C:FULL CROSSWALK RESULTS ... 49
APPENDIX D:RAW AND NORMALIZED DATA RESULTS ... 57
Table of Figures
FIGURE 1:TABLE OF PROJECTED %GROWTH IN WORKFORCE
EMPLOYMENT:1970-1985 ...6
FIGURE 2:SUPPLY AND DEMAND PROJECTIONS,1983-1990...8
FIGURE 3:EXAMPLE NORMALIZATION PROCESS:HIGHER ED ... 23 FIGURE 4:LIBRARIAN EMPLOYMENT,NATIONAL EMPLOYMENT, AND POPULATION
TRENDS:1997-2009 ... 25 FIGURE 5:LIBRARIANS PER 10,000PEOPLE:1997-2009 ... 26
FIGURE 6:LIBRARIAN EMPLOYMENT TRENDS BY LIBRARY TYPE:1997-2009 ... 27
FIGURE 7:TABLE OF SPECIAL LIBRARIAN EMPLOYMENT AS A PERCENTAGE OF TOTAL
LIBRARIAN EMPLOYMENT ... 28 FIGURE 8:SPECIAL LIBRARIAN EMPLOYMENT TRENDS IN COMPARISON TO ALL
LIBRARIANS AND ALL LABOR:1997-2009 ... 29
FIGURE 9:TABLE OF ACADEMIC LIBRARIAN EMPLOYMENT AS A PERCENTAGE OF TOTAL
LIBRARIAN EMPLOYMENT ... 30 FIGURE 10:ACADEMIC LIBRARIAN EMPLOYMENT TRENDS IN COMPARISON TO ALL
LIBRARIANS AND ALL LABOR:1997-2009 ... 31
FIGURE 11:TABLE OF SCHOOL LIBRARIAN EMPLOYMENT AS A PERCENTAGE OF TOTAL
LIBRARIAN EMPLOYMENT ... 32 FIGURE 12:SCHOOL LIBRARIAN EMPLOYMENT TRENDS IN COMPARISON TO ALL
LIBRARIANS AND ALL LABOR:1997-2009 ... 33
FIGURE 13:TABLE OF GOVERNMENT LIBRARIAN EMPLOYMENT AS A PERCENTAGE OF
TOTAL LIBRARIAN EMPLOYMENT... 34 FIGURE 14:GOVERNMENT LIBRARIAN EMPLOYMENT TRENDS IN COMPARISON TO ALL
Introduction
In a 2000 editorial in The Journal of Academic Librarianship, James Matarazzo, then Dean of the Graduate School of Library and Information Science at Simmons College, wrote “In truth, no one pays attention to the human resources supply and demand in a consistent manner” (Matarazzo, 2000). He goes on to state that in the past 4 decades there appear to have been 3 librarian shortage periods and 2 librarian surplus periods (Matarazzo, 2000). In order to determine the state of the market, employment patterns, and trends in the demand for librarians, consistent evaluation of historical and current data must take place. As librarians diversify into careers beyond libraries (due in part to both the economy and the need for personal or company information
managers/researchers in an increasingly digital age), understanding employment trends becomes even more important for educational curricula, school recruiting, and job seeking. A comprehensive understanding of where librarians are working and how many librarians are actually in the workforce (whether or not they actually hold a position with the title of librarian), can be utilized to impact how new librarians are educated, who and how many people are recruited into library programs, and how and where we teach people to look for employment.
This Study
Labor Statistics (BLS) for those whose professional position is labeled “Librarian” by the Occupational Classification Codes used by the BLS within the United States of America, and, if possible, identify trends over a 13-year period from 1997-2009. The statistics gathered will be discussed in relation to national employment and population data for the same years. The librarian data will also be broken down by industry sector (special, academic, public, and government libraries), and the resulting trends will be reviewed against the national employment and population rates. This is an exploratory study; it is not meant to prove a single hypothesis. Instead, it is a longitudinal study on the
employment rates and industries of librarians with the threefold goal of identifying reasonable estimates for how many librarians were and are in the workforce, identifying the industries in which they work, and seeking trends or patterns in that data as it relates to national employment and population data.
Background
While Matarazzo may be correct about the lack of consistent evaluation of data, methodology, and regular assessment intervals, there have been a variety of studies in the past 40 years that attempt to capture and evaluate employment data. Unfortunately, one of the most significant deterrents to studying this topic is that there is no single,
scaled to represent the entire librarian community. Arguably, the most well known survey is the annual Library Journal survey of new graduates and their job market. Larry
Hardesty analyzed all of the Library Journal surveys from 1991-1999 and found that the data consistently accounted for less than half of all library school graduates in any given year (Hardesty, 2002). BLS and census data also have imperfections: this data offers employment approximations by occupation and industry; however, librarians have been branching out from working in libraries and accepting titles other than librarian for quite some time. These workers are often overlooked in census and BLS data (Marshall, Marshall, Morgan, Barreau et al., 2009b). Despite this shortcoming, the BLS is the main source of data for this study. There is a precedent for using such data, as will be seen in the coming discussion, and the data’s weaknesses and strengths will be reviewed more thoroughly in the following methodology section.
This section will begin with a review, by decade, of some of the most relevant studies. Following that will be a discussion about why the topic should be studied, as well as the difficulties and deterrents in attempting to investigate this topic.
The ’70s
The preeminent study of library employment trends in the 1970s was the BLS study spearheaded by Anne S. Kahl and Mary I. De La Vergne entitled Library
Manpower: A Study of Demand and Supply (1975). The study was co-sponsored by the BLS and the U.S. Office of Education. The goals of the study were the “identification and analysis of factors which influence manpower needs, and the development of projections of demand for library personnel” (Kahl & De La Vergne, 1975). The BLS study
American Library Association of a librarian shortage crisis; the shortage was due in part to high federal support for libraries at the time. As a result, there was an increase in recruitment to library schools, but, starting in the 1970s, budget shortages led to fewer jobs and too many librarians (Kahl & De La Vergne, 1975). The study sought to project library supply and demand through 1985, and provided a “comprehensive view” of the profession (Kahl & De La Vergne, 1975). There were two main data groups – statistics from a variety of literature including the U.S. Office of Education, the U.S. Census, and the BLS, and 100 interviews with library heads, administrators, personnel officers, etc. The interviews were conducted to uncover “staffing patterns, job functions, education and training needs, and manpower problems in the library field” (Kahl & De La Vergne, 1975).
The study found that there would be slow growth for the librarian profession between 1970 and 1985 – a growth of 41% for professional librarian employment and 77% for paraprofessionals.
Figure 1: Table of Projected % Growth in Workforce Employment: 1970 - 1985*
1970 1985 Percent Growth Librarians 115,000 162,000 41%
Paraprofessionals 120,000 212,000 77% *(Kahl & De La Vergne, 1975)
were hired for 40% of job openings; between 1970 and 1985, it was estimated that new graduates could be hired for 80% of open positions. The study concluded that the market would be competitive, especially for librarians reentering the field. Additionally, it was observed that with the surplus of new librarians, experienced librarians and managers would be in demand (Kahl & De La Vergne, 1975).
The ’80s
Figure 2: Supply and Demand Projections, 1983 - 1990
Year Job Openings* Additions to Supply**
1983 10,700 10,300
1984 9,600 10,300
1985 9,500 10,300
1986 8,900 10,300
1987 9,800 10,400
1988 10,300 10,400
1989 9,800 10,500
1990 10,500 10,500
*(Vanhouse, 1984) **(Cooper, 1984)
Van House determined that there would be fierce competition for a small number of jobs (especially those at the entry level), and that employers with empty positions would have a large pool from which to choose due to the continued projection of more new librarians than open positions (Van House, 1984). Furthermore, she wrote that librarians would need to look to the non-library market for jobs to supplement the demand for traditional librarians – she cited Library and Human Resources Study data indicating that while only 5% of graduates choose non-library positions immediately following school, 9% of those who leave one job for another choose to take non-library “information professional” positions (Van House, 1984). Ultimately, she concluded that the employment outlook was not encouraging; however, the outlook was better than 10 years prior (Van House, 1984). She concluded with the caveat that projections depend on assumptions, and that every projection has a margin of error (Van House, 1984).
the BLS, the Employer Survey, and the Estabrook and Heim Surveys. Projections were made by performing mathematical computations that accounted for numerous other variables such as birthrate, economic health, and graduate enrollment. While each library sector had unique projections, he concurred with Van House’s overall bleak outlook and predicted that there would be very few new positions created during that timeframe: the major source of open positions would be librarians leaving their jobs (Cooper, 1984). Like Van House, however, he did find that non-library librarian positions presented one area of job growth. Interestingly, he concluded the paper by positing that in order for new librarians to be able to secure these non-traditional library positions, library schools needed to refocus the curriculum to emphasize different types of skills and training (Cooper, 1984).
Both Van House and Cooper worked on the 1983 Library Human Resources: A Study of Demand and Supply report spearheaded by Nancy Roderer and King Research, Inc., and commissioned by the National Center for Education Statistics. This report endeavored to project librarian supply and demand through 1990, and was intended to both report its findings and to serve as an “early warning system for labor market
imbalances” (Roderer, 1983). The study used a combination of survey data and statistics from the BLS along with their own regression models. They found that circa 1980, there were roughly 131,000 librarians in the workforce: 48% school librarians, 23% public librarians, 15% academic librarians, and 14% special librarians (Roderer, 1983). Roderer et al. projected limited growth – it was estimated that by 1990, there would be an
by 1990, certainly less growth than was shown in the 1970’s (Roderer, 1983). The authors, in concurrence with Cooper and Van House’s solo studies, suggested that educators work to include training for alternative careers into librarian educational
curriculums as one response to the lack of job growth (Roderer, 1983). It should be noted that some researchers questioned the validity of some of the data from the Roderer study. Matarazzo (2000) wrote in the same editorial piece referenced earlier:
A 1982 King Research Study…offered a projection of supply and demand for professional librarians through 1990…The 1980 census data were not available for the King Research project, so the baseline census data on the number of librarians in 1980 was not included in the report. The King investigators did discuss the material collected by the Current Population Survey of BLS, which placed the number of librarians in 1980 at 182,000 and explained the reasons these data were not selected….Because I had responsibility for recruiting and placement…I called, as soon as the King report was published, the Bureau of the Census for its 1980 data…I was provided the data I believe is the key to the problem before us. The census data for 1980 reveals 183,000 working librarians. One year later, the Census of Population publication, Earnings by Occupation and Education, provided confirmation to the higher number – a number nearly 50,000 higher than that of the King data (Matarazzo, 2000).
Current Studies
Two North Carolina-based studies out of the University of North Carolina, Chapel Hill School of Library and Information Science were conducted between 2005 and 2009. The Workforce Issues in Library and Information Science I and II studies sought to capture career and employment data from program graduates (both what they were doing and why), as well as develop a model by which other institutions could reproduce the study (Marshall, Marshall, Morgan, Barreau et al., 2009a; Marshall, Marshall, Morgan, Barreau et al., 2009b).
respondent) could include: education, career outline, job detail, life and work, overall career, continuing education, trends in LIS, and, for recent graduates, a section that asked questions about their specific LIS program. Of the graduates that received a library science degree, 80.2% were working in a library setting, and 9% were working in a non-library setting using non-library skills (Marshall, Marshall, Morgan, Barreau et al., 2009a). There was a roughly 35% response rate to the study (2,552 people out of 7,566), and of those still working, it was discovered that 497 were school librarians, 306 were public librarians, 467 were academic librarians, 245 were special librarians, and 546 were not working in a library setting (WILIS I Study Team, N.D.). This information is helpful, particularly for the schools surveyed, but there is no real way of knowing whether this data is scalable to the entire librarian population.
The WILIS II study, which is still active, seeks to test the WILIS I instrument on a wide range of institutions in order to build a shared reporting system based on the “community-based participatory research approach” that would serve to track the careers of library school graduates (Marshall, Marshall, Morgan, Barreau et al., 2009b). The survey will be rolled out in three phases and currently includes 42 schools across North America (Workforce issues in library and information science: Participating LIS
(95%) wanted alumni employment data to help with accreditation; other uses were for curriculum development (88%) recruiting (88%) and benchmarking (75%) (Marshall, Marshall, Morgan, Barreau et al., 2009b).
A final notable study published in 2010 used BLS and American Community Survey statistics to obtain national, state and demographic data for librarians, library technicians, and library clerical staff. It found that 91% of librarians are concentrated in three industries: libraries and archives, elementary and secondary schools, and higher education (Manjarrez et al., 2010). These findings coincide roughly with what was discovered through the WILIS I study in 2009. Manjarrez et al. point out that the Bureau of Labor Statistics Occupational Outlook Handbook estimates that over the next 10 years, there will be an 8% growth in the industry, with a projected 172,400 librarian positions by 2018. However, that projected growth rate runs contrary to the lack of growth in librarian employment for the previous 8 years (the time frame of the study) (Manjarrez et al., 2010). Manjarrez et al. theorize that perhaps librarians were hit particularly hard by the current economic downturn (Manjarrez et al., 2010). Despite these grim findings, it is noted out that even if the number of jobs merely remains steady, and the current yearly graduation rate of new librarians stays level at approximately 6,700 for the next 10 years, then “age-based attrition will likely outpace the supply of newly trained librarians
Why Study This?
Knowing the size and composition of any occupation’s workforce has a great impact on how we educate new librarians. A better understanding of the availability of jobs in certain sectors might impact librarian education so that courses may be taught to cover skills needed to obtain work in any burgeoning sub-field. Similarly, if a particular sub-field seems to be reducing its workforce, then this should be reflected in librarian education as well as school recruitment efforts. Diversification and segmentation of the librarian workforce and its impact on education will be reviewed in further detail later in the discussion section of this paper, with respect to the data gathered. Nonetheless, understanding employment trends of librarians can help to provide targeted education reform, and an ever-evolving set of metrics (as jobs are created and dissolved) by which to gauge the relevance of current educational offerings.
Consistently across the literature regarding employment trends for the librarian workforce, there is mention of both the age of the workforce and the potential for job openings due to retirements. As of 2008, there are 78,000,000 baby boomers employed nationally across all occupations in America that are slated to reach retirement age and stop working over the next 20 years (Dohm, 2000). With the current average age of librarians at about 47 (Dohm, 2000), it was projected that between 1998 and 2008 about 39,000 jobs would be available due to retirements or people leaving the profession (Crosby, 2001). (It is important to note, though, that in 1975, the average age of a
2009-2018 (Dohm, 2000). Lynch concurred, adding that librarian retirement projections would be most significant from 2015-2019 (Lynch, 2000). The WILIS I study found that roughly 23% of librarians surveyed did not plan to work past the age of 65, and that roughly half of those surveyed who would have been 62 and older expected to retire within 5 years (Marshall, Marshall, Morgan, Barreau et al., 2009a). Studying
employment patterns, then, becomes even more important in the wake of a potential surge in job opportunities – understanding growth trends becomes key to assessing how many new jobs are being created versus how many are vacant because of retirement.
In 2009, as a response to the predictions being made concerning the multitude of retirements on the horizon, Robert M. Stearns wrote in American Libraries, “Were I to
play Nostradamus, I’d predict that most of these retirements of people will include the retirements of the of the positions themselves: Goodbye person, goodbye job is not an uncommon practice during library budgetary crises” (Stearns, 2009). Economic crisis is yet another reason for studies such as this. Stearns concludes his conjectures by writing that many people who reach retirement age might not be able to afford to retire,
regardless of what their plans might have been (Stearns, 2009). While the government projected job growth for librarians at about 5% between the years of 1998-2008, this was lower than the average occupational job growth for the nation (Crosby, 2001). In
current economic situation, make it imperative to comprehensively understand the trends of library employment as a whole and by sub-genre. Either a supply shortage or overage could prove crippling in the uncertain job market ahead; remaining abreast of statistics and trends will help make the profession stronger, and help educate new librarians according to market trends.
Methodology
The goal of this paper is to identify and evaluate trends in librarian employment over time; it is neither to evaluate industries as stand-alone entities nor to recommend specific industries to emerging librarians. The data is being used to understand the lay of the land and, in conjunction with population and broad national employment statistics, to evaluate the growth of the profession.
About the Data
All data regarding librarians for this project was gathered from Occupational Employment Statistics (OES) distributed by the U.S. Bureau of Labor Statistics
(Occupational employment statistics home page, 2010.). The data reflected in this paper ranges from 1997-2009; this is also the range of years that offers consistent OES data. Data is available going as far back as 1988, but it is inconsistent, as all industries were not polled each year prior to 1997.
Traditionally, OES data is used to look at employment and wage data at a single point in time using various methods of separating and organizing the data – by state, area, or industry. By their own admission, OES does not employ a single, consistent
data, as defined by the Bureau of Labor Statistics. How these changes influence the data for this particular study is also included:
Changes in occupational classification – Before 1998, the OES had a proprietary
means by which to code occupations. Between 1999 and 2003, the change to Standard Occupational Classification was still in progress and as such, some occupations had their codes changed on a yearly basis while the crosswalk was perfected. Librarians are classified as 31502 in the old system until 1998; in 1999, the occupational code was immediately switched to 25-4021 and remains steady until at least 2009 (the last year of available data). The occupational classification change did not affect librarian data significantly (Occupational employment statistics frequently asked questions, 2010).
Changes in industrial classification – Before 2002, OES data used the SIC
(Standard Industrial Code) to codify their industries. In 2002 and in all subsequent years, NAICS (North American Industry Classification System) codes are used to classify industries in the data. While for some of the industries that employ librarians, this simply means finding a single equivalent code for an industry (e.g., Elementary and Secondary Schools have a one-to-one correspondence between SIC and NAICS codes – 8350 and 624400 respectively), for other industries, the mapping is far more complex. For example, the SIC industry “2730 - Books” maps to the NAICS industries “511100 - Newspaper, Periodical, Book, and Directory Publishers” as well as “323100 – Printing and Related Support Activities.” This is simple enough, except that SIC “2750 –
correspondence, and therefore larger, less specific groupings must be made to obtain reasonably accurate longitudinal data (Occupational employment statistics frequently asked questions, 2010). For the purposes of this study, a SIC/NAICS crosswalk was generated that clustered the data into reasonably analogous groups (see Appendix C).
Changes in Geographical Classification – In 2005, the OES changed how they
classify metropolitan areas. Because this study does not take the librarians’ location into account, this issue has no bearing on the data (Occupational employment statistics frequently asked questions, 2010).
Changes in the Way the Data are Collected – Prior to 2001, if an employer had a
worker in a job not listed on their census form (which is tailored to each industry), those workers were listed in an “other” category on the form. After 2001, more information was requested about workers who could not be categorized on the given form, which possibly results in more reported workers in any given industry. Additionally, changes to the form can cause workers to be classified differently from year to year (Occupational employment statistics frequently asked questions, 2010).
Changes in the Survey Reference Period – In 2002, the survey dates were changed
from October, November, and December to May and November. This could affect the count of seasonal workers, but steady professions such as library work should not see significant data discrepancies because of this change (Occupational employment statistics frequently asked questions, 2010).
Changes in Mean Wage Estimation Methodology – In 2002, methods for
change is unrelated to the data (Occupational employment statistics frequently asked questions, 2010).
The OES Methodology – The OES methodology assumes slow employment changes
over time, and the data collection processes reflects that assumption.
In order to produce estimates for a given reference period, employment and wages are collected from establishments in six semiannual panels for three consecutive years. Every six months, a new panel of data is added, and the oldest panel is dropped, resulting in a moving average staffing pattern…This methodology assumes that industry staffing patterns change slowly and that detailed
occupational wage rates in an area change at the same rate as the national change in the ECI wage component for the occupational group. The use of 6 data panels to create a set of estimates means that sudden changes in occupational
employment or wages in the population or changes in methodology show up in the OES estimates gradually (Occupational employment statistics frequently asked questions, 2010).
Despite these potential problems, data from the BLS OES is used in this study. The OES does concede that “…[longitudinal] comparisons of occupations that are not affected by classification changes may be possible if the methodological assumptions hold” (Occupational employment statistics frequently asked questions, 2010). While the industries that employ librarians might be affected by the SIC/NAICS classification change, the switch did not affect the librarian occupational code, so librarians, regardless of their industry title, remain identifiable.
All of the data in this paper is collected and distributed by the U.S. Government. One may access (via download) different types of data at different levels of granularity. SICS and NAICS codes are hierarchical structures, moving left to right in specificity. The more zeros found at the end of the code, the less specific the occupation. Inheritance occurs up and down the hierarchy tree. Data from the years 1997-2001 are available at the 2-digit SIC code level (where only the first 2 digits of the code are indexed and all levels of the tree below those two digits are combined) and at the 3-digit SIC code level (same as the 2 digit, but with the granularity expanded to 3 digits). From 2002 forward, data is available at the 3, 4, and 5 digit NAICS code level. See Appendices A and B for examples of the SIC and NAICS code structures.
Gathering and Grouping the Data
From 1997-2001, data parsed at the 3-digit SIC code level was employed; from 2002 forward, the data used was parsed at the 4-digit NAICS code level. These levels of generalization were chosen because in each respective coding system the level selected distinguishes between major occupations while at the same time grouping together subgenres of occupation.
The data sets were downloaded from the Occupational Employment Statistics page of the Bureau of Labor Statistics website (Occupational employment statistics home page, 2011) as Microsoft Excel spreadsheets. Data was sorted by Occupational
The challenge then became to group the data in a meaningful way. At first, large, sweeping groups were created such as “government,” “money,” and “education.”
However, when analyzing the data after creating these groups, two problems were identified. First, there were too many items in the “miscellaneous” category – since the SIC and NAICS codes should have rough equivalents, it did not seem appropriate for there to be so many industries that could not be categorized. Additionally, in some of the larger categories, gaps in the reported data seemed to be creating more fluctuation in the employment numbers than seemed reasonable. For these reasons, a second (and, in hindsight, more calculated) approach was taken to grouping the data.
Looking at the category names from the SIC codes and the NAICS codes, there were correspondences: obvious groups that belonged together such as “541300 – Architectural, Engineering, and Related Services,” and “8710 – Engineering,
librarian counts for each year. With logical groups created for the data, yearly employment counts for each group were tabulated. The full results can be seen in Appendices C and D.
The final step to creating usable data was to categorize the industries so that data could be represented in large chunks rather than by industry. While the initial effort endeavored to use the relatively standard breakdown of academic, school, special, public, and “other” libraries, this was not possible, as public librarians are combined with
government librarians in the BLS data (as both technically work in government libraries). In light of that setback, it was decided that the categories used would be Academic, School, Government, and Special libraries. The first three sectors were fairly straightforward, and the corresponding industries were easily identified. All other industries were classified under special libraries. A full breakdown of where each industry was placed can be found in Appendix E.
Two secondary sets of data were collected to contextualize the librarian
employment statistics. Population data was collected from the website of the U.S. Census Bureau, Population Division (U.S. Census Bureau Population Estimates: Annual
Population Estimates 2000 to 2009, 2010; Historical National Population Estimates:
July 1, 1990 to July 1, 1999, 2000). They provide downloadable tables of current and historical population estimates, and data is available by the decade. There is a slight jump in the population estimates between 1999 and 2000, as the base number used to create the estimates was shifted from the 1990 base to the 2000 base and estimates were adjusted. Also collected were national employment statistics for the entire population (all
statistics, which were provided by the Bureau of Labor Statistics website (Occupational employment statistics home page, 2011).
Normalizing the Data
The data collected needed to be normalized in order for the data to be analyzed in context with each other. In other words, not all the data had the same frame of reference. For example, if 25 people were stabbed one year in city A and 30 people were stabbed in city B in the same year, how would one compare the stabbing rates of the two cities to determine which was more dangerous? It would, of course, depend on the population of the cities. In order to compare those numbers to determine if one city is more dangerous than the other, the stabbing rates must be standardized in relation to the population of their cities. So if city A has 10,000 people and city B has 30,000, then the stabbing rate per 10,000 people for city A is 25 and city B is 10, making city B a less dangerous city (Neuman, 2006).
In the same fashion, context was imposed upon the raw data collected for this study in order to find trends, analyze growth or decay, and derive meaning from the numbers. Choosing a base by which to standardize or normalize data is often difficult. For this study, it was decided that because the data was collected from only two sources, the numbers ranged from 10 to the hundred millions, and because we are mainly
an industry that begins with 50 positions has only gained 10 jobs over a year, we can see if it is proportionally similar to the growth of an industry that begins with far more positions. The normalized numbers were truncated to two decimal places.
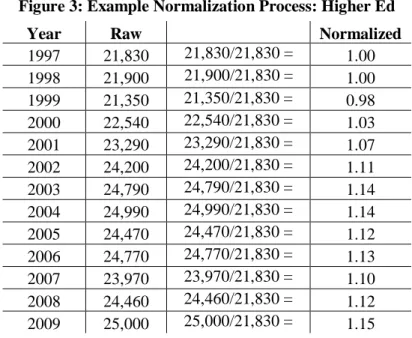
The normalization process was completed in two stages: first on a macro level, with the full employment statistics for all librarians and all occupations, as well as for the overall population data, and then on a micro level for each of the library sectors created and each of the industries clustered within the librarian employment data. The full results of this process, along with the raw data, can be seen in Appendix D and Figure 6. A sample of the normalization process is seen below (Figure 3):
Figure 3: Example Normalization Process: Higher Ed
Year Raw Normalized
1997 21,830 21,830/21,830 = 1.00 1998 21,900 21,900/21,830 = 1.00 1999 21,350 21,350/21,830 = 0.98 2000 22,540 22,540/21,830 = 1.03 2001 23,290 23,290/21,830 = 1.07 2002 24,200 24,200/21,830 = 1.11 2003 24,790 24,790/21,830 = 1.14 2004 24,990 24,990/21,830 = 1.14 2005 24,470 24,470/21,830 = 1.12 2006 24,770 24,770/21,830 = 1.13 2007 23,970 23,970/21,830 = 1.10 2008 24,460 24,460/21,830 = 1.12 2009 25,000 25,000/21,830 = 1.15
Results
Total Librarian Employment and Population
However, librarian employment did decrease tremendously between 2002 and 2005 – a -.08 fall (over 11,000 jobs lost) – while national employment experienced a slight
increase over the same period. Since the 2005 low, librarian employment has shown slow but steady growth, between .01 and .02 per year, until 2008. Furthermore, 1999 presents the lowest figure for librarian employment in the years studied: .95 (roughly 136,000 jobs) while total national employment is reported at a relative high of 1.09. From these results, it seems as though national employment does not parallel overall librarian employment. In some cases, especially between 1998 and 2005, there are points of opposing growth – where there is growth in one, there is decline in the other. A
noteworthy point, depicted in the graph below (Figure 4), is that while population growth is consistent and national labor (though it experiences peaks and valleys) generally keeps pace with population, librarian employment rates exhibit almost no consistency in this regard – librarian employment at a glance seems unpredictable when compared to population and national employment.
Figure 4: Librarian Employment, National Employment, and Population Trends: 1997 - 2009
Irrespective of the current slow job growth (notwithstanding the 2008-2009 dip), the number of librarians in comparison to the overall population is dropping. As of 2009, there are fewer librarians per 10,000 people (4.87) than there were in 1999 (5.00), when there were the fewest recorded librarians employed in the survey period. Since the high employment rates of 2002 (5.42 librarians per 10,000 people), the number of librarians per 10,000 people has been steadily declining almost every year – what little growth in the number of employed librarians is seen here is offset by the fact that that growth is not keeping pace with that of the general population.
0.95 1.00 1.05 1.10 1.15 1.20
1997 1998 1999 2000 2001 2002 2003 2004 2005 2006 2007 2008 2009
Figure 5: Librarians per 10,000 People: 1997 - 2009
Year Librarians Per 10,000 People 1997 5.33 1998 5.27 1999 5.00 2000 4.90 2001 5.23 2002 5.42 2003 5.23 2004 5.09 2005 4.89 2006 4.93 2007 4.90 2008 4.93 2009 4.87
Figure 6: Librarian Employment Trends by Library Type: 1997 - 2009
Year
All Librarians
All Labor
Special Librarians
Academic Librarians
School Librarians
Government Librarians
1997 1.00 1.00 1.00 1.00 1.00 1.00 1998 1.00 1.07 0.98 1.00 0.96 1.07 1999 0.95 1.09 1.06 0.98 0.92 0.96 2000 0.97 1.07 1.00 1.03 0.91 1.03 2001 1.05 1.09 0.97 1.07 0.95 1.23 2002 1.09 1.09 1.01 1.11 0.96 1.35 2003 1.06 1.09 0.93 1.14 0.96 1.26 2004 1.04 1.09 0.94 1.14 0.98 1.14 2005 1.01 1.11 0.79 1.12 0.96 1.14 2006 1.03 1.13 0.80 1.13 0.97 1.19 2007 1.04 1.15 0.82 1.10 0.97 1.21 2008 1.05 1.15 0.83 1.12 0.99 1.22 2009 1.05 1.12 0.77 1.15 0.99 1.22
Special Librarians
Special libraries, here defined as any workplace that employs a librarian that is not an academic, school, or government library, account for the smallest percentage of
0.70 0.80 0.90 1.00 1.10 1.20 1.30 1.40
1997 1998 1999 2000 2001 2002 2003 2004 2005 2006 2007 2008 2009
librarian employment for all 13 years surveyed. Beginning at about 12% of all positions and reducing to slightly less than 9% of all positions between 1997 and 2009, special librarians cover a wide range of industries and non-traditional library positions (see Appendix E). This is an especially difficult population to identify and survey because in many circumstances special librarians do not use the title of librarian, though they hold an MLS.
Figure 7: Table of Special Librarian Employment as a Percentage of Total Librarian Employment
Year
Special Librarian Employment – Raw Numbers
Special Librarian % of Total Librarian Employment
1997 17320 12.14%
1998 17020 11.94%
1999 18280 13.42%
2000 17310 12.52%
2001 16840 11.29%
2002 17410 11.16%
2003 16160 10.64%
2004 16230 10.89%
2005 13700 9.47%
2006 13850 9.40%
2007 14150 9.58%
2008 14340 9.56%
2009 13380 8.95%
entire library workforce, albeit far more dramatic in its points of decline. While there seems to be some similarity in the trends of the national labor force and special librarians between 1998 and 2000 as well as 2005 and 2009, there is little similarity in their
respective trends in between 2000 and 2005.
Figure 8: Special Librarian Employment Trends in Comparison to All Librarians and All Labor: 1997 - 2009
Academic Librarians
Academic librarians account for between roughly 15.30% and 16.75% of the total employed librarian population over the 13-year period. Despite the economic troubles beginning in 2008, the academic library population is increasing its workforce, with the only job deficits reported between 2004 and 2005 (520 jobs) and 2006 and 2007 (800 jobs). Over 3,000 librarians were added to the academic librarian workforce over the 13 years studied. While the highest employment rate by percentage in this sector actually occurs in 2005 (16.91%, or 24,470 positions), due to the changing composition of the
0.70 0.75 0.80 0.85 0.90 0.95 1.00 1.05 1.10 1.15 1.20
1997 1998 1999 2000 2001 2002 2003 2004 2005 2006 2007 2008 2009
profession, the highest numerical employment rate in the academic library segment occurs in the final survey year, 2009 (16.72%, or 25,000 jobs).
Figure 9: Table of Academic Librarian Employment as a Percentage of Total Librarian Employment
Year
Academic Librarian Employment – Raw Numbers
Academic Librarian % of Total Librarian Employment
1997 21830 15.30%
1998 21900 15.37%
1999 21350 15.67%
2000 22540 16.30%
2001 23290 15.62%
2002 24200 15.51%
2003 24790 16.32%
2004 24990 16.76%
2005 24470 16.91%
2006 24770 16.81%
2007 23970 16.22%
2008 24460 16.31%
2009 25000 16.72%
Academic librarian employment patterns, like special librarians, do not follow the general librarian trend, nor do they show any real correspondence to overall national labor patterns. However, for every year surveyed, academic librarian normalized data shows one clear pattern – it is above the trend line for all librarians. Academic librarian employment rates have shown superior performance relative to all librarians.
that extends beyond 2002. This corresponds to the general shape of the total librarian employment trends, which also experience a dip between 1998 and 1999 (-.05) and a recovery between 1999 and 2002 (.14).
Figure 10: Academic Librarian Employment Trends in Comparison to All Librarians and All Labor: 1997 - 2009
School Librarians
School librarians comprise the majority of the librarian labor force. In 2002 and 2003, school librarians are at their lowest employment percentages, at 40.22% (62,760 jobs) and 41.41% (62,920 jobs) of the total librarian workforce, respectively. While there has been a somewhat steady recovery since those lows, with school librarians comprising 43.28 % (63,720 jobs) of the total librarian workforce in 2009, this sector has recouped neither the job rates nor the percentage of total librarians displayed in the first year surveyed, 1997 (45.79%, or 65,340 jobs). While there have been some vast fluctuations in this particular sector, there has been a consistent overall pattern of job loss with recoveries that do not quite reach past numbers. Using the 1997 and 2009 data, 620
0.70 0.75 0.80 0.85 0.90 0.95 1.00 1.05 1.10 1.15 1.20
1997 1998 1999 2000 2001 2002 2003 2004 2005 2006 2007 2008 2009
positions have been lost over the 13 years studied. While this number is very small, especially compared to the size of this particular demographic, this means that there has been absolutely no new growth in the sector besides recovery from previous job loss.
Figure 11: Table of School Librarian Employment as a Percentage of Total Librarian Employment
Year
School Librarian Employment – Raw Numbers
School Librarian % of Total Librarian Employment
1997 65340 45.79%
1998 62620 43.93%
1999 59800 43.90%
2000 59200 42.81%
2001 62150 41.67%
2002 62760 40.22%
2003 62920 41.41%
2004 64120 43.01%
2005 63030 43.55%
2006 63390 43.03%
2007 63550 43.01%
2008 64620 43.09%
2009 64720 43.28%
More than any of the other sectors discussed here, school librarian employment trends show a relationship with both the national labor trends and the total librarian employment trends. Normalized school librarian employment rates are consistently below the national labor average as well as total librarian employment rates. There was a steep fall in school librarians from 1997 through 2000 (-.09), which is mirrored in the dip in total librarian employment from 1998-1999 and the national employment decline from 1999-2000. Since 2000, school librarians have experienced a slow recovery through 2009 (.04), with only one small setback between 2004 and 2005 (-.02). This mirrors the
that school libraries do not exhibit the employment decline that both national and total librarian employment display after 2008.
Figure 12: School Librarian Employment Trends in Comparison to All Librarians and All Labor: 1997 - 2009
Government Librarians (Including Public Librarians)
Government librarians comprise the second largest sector of librarians in the workforce. Generally, over the 13-year period surveyed, they account for between 26.78% and 33.12% of the workforce. At its lowest percentage of the general librarian population in 1999 (26.78%), government librarians numbered 38,210. When in 1999 they dipped to 36,800 jobs, government librarians comprised 27.01% of the total librarian workforce – a larger percentage, despite the job deficit. At their peak in the survey period (2002), government librarians accounted for 33.12% of all librarian employment, with 51,680 jobs. While there was a swift dip to 29.34 % in 2004, government librarians had a steady increase in number of positions until the 2008-2009 period, where there was a loss of 110 jobs. Despite this loss, however, the percentage of government librarians to total
0.70 0.75 0.80 0.85 0.90 0.95 1.00 1.05 1.10 1.15 1.20
1997 1998 1999 2000 2001 2002 2003 2004 2005 2006 2007 2008 2009
librarians continued upward during that same period, with 31.06% of all librarians in government positions in 2009.
Figure 13: Table of Government Librarian Employment as a Percentage of Total Librarian Employment
Year
Government Librarian Employment – Raw Numbers
Government Librarian % of Total Librarian Employment
1997 38210 26.78%
1998 40990 28.76%
1999 36800 27.01%
2000 39250 28.38%
2001 46860 31.42%
2002 51680 33.12%
2003 48070 31.64%
2004 43730 29.34%
2005 43540 30.08%
2006 45300 30.75%
2007 46100 31.20%
2008 46550 31.04%
2009 46440 31.06%
Figure 14: Government Librarian Employment Trends in Comparison to All Librarians and All Labor: 1997 - 2009
Discussion
Discussion of the Data
One of the more fascinating aspects of the data presented is that there proves to be less consistency in trending between national labor statistics and total librarian statistics than originally anticipated. When the data is broken down, special and academic librarian employment rates seem to bear the least resemblance to the total librarian and national labor employment trend lines. Special librarians are perhaps a unique case because they can hold many titles other than librarian (this will be addressed in more detail later in the discussion), and thus their employment data might not be as complete as one would hope. Academic librarians, however, have no such excuse. Government librarian trend data certainly resembles the total librarian employment chart more than any other sector,
0.70 0.80 0.90 1.00 1.10 1.20 1.30 1.40
1997 1998 1999 2000 2001 2002 2003 2004 2005 2006 2007 2008 2009
while school librarian patterns most closely resemble the national employment trend data. This is surprising, given that based on the composition of the entire librarian workforce, where school librarians comprise more than half of the population, one might expect them to mirror the total librarian data more than national data.
Without further research, one can only speculate as to the reasons behind the overall lack of trending similarity – perhaps it is due to the fact that librarians can and do work in a wide and varied range of industries that fluctuate under different conditions, rather than a single industry that can be measured in isolation. Additionally, much of the librarian workforce relies on funding from the government: all government libraries, the majority of school libraries, and many universities and colleges. Because of this, they could be more sensitive to the vicissitudes of the economy than other industries.
What is clear from the data is that librarian employment growth is not keeping pace with overall population growth. This is reflected in the number of librarians per 10,000 people (see figure 5), which has dropped during the 13-year survey period. As the number has dropped by less than 1 librarian per 10,000 people in the past 13 years, it may not seem an alarming number, but because librarian growth is not keeping pace with population growth, that number could begin to fall more rapidly. While the long-term effects of fewer librarians per capita might not be known at the moment, the trend is startling, especially given that the overall number of librarians had been increasing from 2005 until 2008.
the other sectors, but that commonality does not seem to be predictive. Why these sectors behave so differently even though they all employ librarians cannot be answered simply; one theory, mentioned earlier, could be that these areas are extremely diverse and
impacted by different economic, social, and political indicators. While the direct and indirect causes for the lack of correspondence between the four separate librarian sectors can only be speculated, it is important to understand that the futures of each of these sectors therefore do not necessarily impact the others. While the decline of one sector will certainly put pressure on the others to absorb those workers, it should be noted that only once in the 13-year period surveyed was there what seemed to be a direct fall in one sector and rise in another. This occurred in 1999, when special librarians experienced a drop and government librarians experienced a rise. This is not conclusive evidence, nor does it mean that prospering sectors are not absorbing workers from failing sectors. What it does show, though, is that each sector could ostensibly be treated as its own profession with its own unique fluctuations and indicators.
While two of the library sectors, academic and school librarians, did not
did not. There may have been a dearth of job losses, but not in the sense that people were being laid off. Rather, because of the retirement situation among librarians, some might have retired as planned, or else were offered early retirement packages, and those positions were not filled. Nevertheless, the fact that certain sectors experienced losses while others continued to grow is certainly significant, and when the 2010 and 2011 data is released, it will be most interesting to see how each of the sectors are affected. Perhaps then, when there is more data and perspective (regarding the trajectory of the economic downturn), we will be more able to determine the root causes of the declining overall librarian employment rates.
Throughout this study, it has become clear that it is very difficult to find
predictive trends within the library profession – there are so many factors that determine the rise and fall of employment in each of the four separate sectors that it becomes very difficult to make predictions for the future. Yet there is value in understanding past data and trends to prepare for future scenarios. Traditional librarian employment rates are dropping and we are in a period of economic downturn; though there are those who are optimistic about retirement providing the jobs needed to support incoming librarians (Crosby, 2001; Crosby, 2001; Lynch, 2000) ,the reality of the current economic situation is that many librarians might not be able to retire even if they wanted to, as Stearns suggests. Furthermore, even if librarians do retire, many institutions may take the opportunity to leave positions vacant and save money (Stearns, 2009). In the 2009
potential to be overlooked in surveys such as those conducted by the BLS; in truth, with numbers as high as 27% of new graduates taking alternative library positions (add to that Hardesty’s finding that these surveys generally collect data on less than half of that year’s graduating students [Hardesty, 2002]), it is almost impossible to truly determine how many librarians are employed in the workforce.
Because of the potential these alternative careers hold for new graduates along with the possibility that retirement rates will not meet expectations, we need to prepare new graduates for a variety of different types of work. (Manjarrez predicted about 6,700 per year [Manjarrez et al., 2010], but the 2010 Library Journal placement survey listed 5,160 graduates in 2009 [S. L. Maatta, 2010].) At the very least, library school curricula should support the educational needs of librarians who are interested in pursuing
alternative careers. With respect to the data collected in this study, academic libraries represent the only sector with recent demonstrated growth – obviously curricula should not be altered so as to become unrecognizable as library programs; rather, the options should be made available to students and/or incorporated into traditional curricula so as to benefit all students.
that 70.67% of the surveyed population would recommend that a library degree be pursued to work in a similar position (Sellen & Vaughn, 1985). Those who would not recommend obtaining the MLS degree (29.36%) made various alternative coursework and/or degree suggestions including business, computer science, public administration, communication, education, and journalism (Sellen & Vaughn, 1985).
Schools, therefore, should respond to the data – employment rates of traditional librarians are at the very least inconsistent and are currently dropping, as seen in this study, the number of alternative librarians is rising (according to Library Journal
surveys), and the market, at least when looking retrospectively, is somewhat
unpredictable – and reevaluate curricula to include material that will be useful to the growing population of alternative librarians. The 1985 survey mentioned earlier (Sellen & Vaughn, 1985) provides a starting point for identifying coursework that might be appropriate for inclusion: business, computer science, public administration,
communication, education, and journalism. Perhaps creating relationships with these degree programs to have special topics courses or joint seminars that would benefit both schools could be a place to begin. Whatever course the profession may take (and as this paper concludes, the trends are very difficult to predict), graduate programs should leverage the data that is available and respond by providing guidance and coursework in areas where graduates are finding positions.
Future Research
paraprofessional positions. In particular, it would be interesting to explore how many paraprofessional positions those with professional library degrees currently occupy, and why these positions were chosen. In addition, performing a similar trend analysis on paraprofessional library positions using the approach taken in this study would help to further define the current and future state of the profession as a whole.
Continued research regarding employment statistics and trends in the library field is essential for understanding and nurturing the growth of the profession. Having a firm grasp on this data will also help educators, recruiters, and students truly comprehend the direction the profession will take in the coming years. One method for expanding this type of research might be to somehow discover the “hidden librarians” who work outside of libraries in positions other than those titled “librarian.” The BLS and many other surveying bodies use occupational codes to classify the individuals included in the data. This proves problematic for research such as this paper as there are people who have the degree of MSLS and use those skills in their jobs, but are not called librarians (Marshall, Marshall, Morgan, Barreau et al., 2009a). While the WILIS studies are attempting to capture some of this data for their participating schools, a more focused approach to specifically gather data on the “hidden librarians” might help researchers and educators to understand just how many of these professionals exist in the workforce, and the level of demand for more information professionals outside of traditional libraries. It might also be advantageous to study the role of outsourcing library duties and staffing in librarian employment patterns.
statistical analysis of current and historical data. This would help researchers better understand the statistical significance of trends, such as the difference between the patterns of the various types of work environments (special, academic, school, and government libraries). In addition to in-depth statistical analysis of this type of data, it might be interesting to attempt to find correlations between historical and current events and the peaks and valleys of librarian employment. The data gathered and analysis performed for this study was merely for the identification of these trends – performing thorough statistical analysis and aligning those findings with national events might help us understand what to expect from the different professional sectors in the future when similar events occur.
References
Cooper, M. D. (1984). Projections of the demand for librarians in the united-states.
Library Quarterly, 54(4), 331-367.
Crosby, O. (2001). Librarians: Information experts in the information age. Occupational Outlook Quarterly,
Dohm, A. (2000). Gauging the labor force effects of retiring baby-boomers. Monthly Labor Review, 123(7), 17-25.
Hardesty, L. (2002). Future of academic/research librarians: A period of transition - to what? Portal-Libraries and the Academy, 2(1), 79-97.
Historical National Population Estimates: July 1, 1990 to July 1, 1999 (2000). Retrieved 2/27/2011, from http://www.census.gov/popest/archives/1990s/popclockest.txt
Kahl, A. S., & De La Vergne, M. I. (1975). Library manpower: A study of demand and supply. No. 1852).US Department of Labor, Bureau of Labor Statistics.
Koenig, M. E. D. (1991). The transfer of library skills to nonlibrary contexts. In I. P. Godden (Ed.), Advances in librarianship (pp. 1-27) Emerald Group Publishing Limited.
Maatta, S. (2009). Jobs and pay take a hit. Library Journal, 134(17), 21-29. Retrieved from
https://auth-lib-unc-edu.libproxy.lib.unc.edu/ezproxy_auth.php?url=http://search.ebscohost.com.libproxy
.lib.unc.edu/login.aspx?direct=true&db=aph&AN=44668681&site=ehost-live&scope=site
Maatta, S. L. (2010). Stagnant salaries, rising unemployment. Library Journal, 135(17), 22-29. Retrieved from
https://auth.lib.unc.edu/ezproxy_auth.php?url=http://search.ebscohost.com/login.asp
x?direct=true&db=aph&AN=54726670&site=ehost-live&scope=site
Manjarrez, C. A., Ray, J., & Bisher, K. (2010). A demographic overview of the current and projected library workforce and the impact of federal funding. Library Trends, 59(1-2), 6-29.
Marshall, J. G., Marshall, V. W., Morgan, J. C., Barreau, D., Moran, B. B., Solomon, P., . . . Thompson, C. A. (2009a). Where are they now? results of a career survey of library and information science graduates. Library Trends, 58(2), 141-154.
Marshall, J. G., Marshall, V. W., Morgan, J. C., Barreau, D., Moran, B., Solomon, P., . . . Thompson, C. A. (2009b). Where will they be in the future? implementing a model for ongoing career tracking of library and information science graduates. Library Trends, 58(2), 301-315.
Neuman, W. L. (2006). Basics of social research: Qualitative and quantitative approaches Allyn & Bacon.
Occupational employment statistics frequently asked questions. (2010). Retrieved
2/27/2011, from http://www.bls.gov.libproxy.lib.unc.edu/oes/oes_ques.htm#Ques30
Occupational employment statistics home page. Retrieved 2/27/2011, from
http://www.bls.gov/oes/
Roderer, N. K. (1983). Library human resources: A study of supply and demand. No. NCES 83-207. King Research, Inc.
Sellen, B., & Vaughn, S. J. (1985). Librarians in alternative work places. Library Journal, 110(3), 108. Retrieved from
https://auth.lib.unc.edu/ezproxy_auth.php?url=http://search.ebscohost.com/login.asp
x?direct=true&db=lxh&AN=7674621&site=ehost-live&scope=site
Stearns, R. M. (2009). Back to the future: For the job market, forget the predictions.
American Libraries, 40(8-9), 44-44. Retrieved from
http://search.proquest.com/docview/57733488?accountid=14244
U.S. Census Bureau Population Estimates: Annual Population Estimates 2000 to 2009. (2010). Retrieved 2/27/2011, from http://www.census.gov/popest/states/NST-ann-est.html
WILIS I Study Team. (N.Y.). Workforce issues in library and information science (WILIS):A comparison of library and non-library employees: WILIS short report 3., 2011, from http://www.wilis.unc.edu/docs/Short_Report_3_-_Library_and_Non-Library_Employees.pdf
Appendices
Appendix A: SIC Structure Example
SICS CODE STRUCTURE Major Group 22: Textile
Mill Products
Industry Group 221: Broadwoven Fabric Mills, Cotton
2211: Broadwoven Fabric Mills, Cotton
Industry Group 222: Broadwoven Fabric Mills, Manmade Fiber and Silk
2221: Broadwoven Fabric Mills, Manmade Fiber and Silk
Industry Group 225: Knitting Mills
2251:Women’s Full-Length and Knee-Length Hosiery, Except Socks
2252: Hosiery, Not Elsewhere Classified
2253: Knir Outerware Mills 2254: Knit Underwear and Nightware Mills
2257: Weft Knit Fabric Mills
Appendix B: NAICS Code Structure Example
NAICS CODE STRUCTURE
54: Professional, Scientific, & Technical Services
541: Professional, Scientific, & Technical Services
5411: Legal Services
54111: Offices of Lawyers
541110: Offices of Lawyers
54112: Offices of Notaries
541120: Offices of Notaries
54119: Other Legal Services
541191: Title Abstract & Settlement Offices
541199: All Other Legal Services
5142: Accounting, Tax Preparation, Bookkeeping & Payroll Services
54121:
Accounting, Tax Preparation, Bookkeeping & Payroll Services
541211: Offices of Certified Public Accountants
541213: Tax Preparation Services
541214: Payroll Services
541219: Other Accounting Services
Appendix C: Full Crosswalk Results
SIC NAICS Title 97 98 99 00 01 02 03 04 05 06 07 08 09
6320 Accident and Health Insurance and Medical 6330 Fire, Marine, and Casualty Insurance
6310 Life Insurance
524100
Insurance
Carriers
8720 Accounting, Auditing, and Bookkeeping Services 541200 Accounting, Tax Preparation, Bookkeeping, and Payroll Services
7310 Advertising
541800
Advertising and Related
Services
3720
Aircraft and
Parts
336400 Aerospace Product and Parts Manufacturing
2730 Books
2750
Commercial
Printing
2740
Miscellaneous
Publishing
2720 Periodicals Publishing, or Publishing and Printing 2710 Newspapers Publishing, or Publishing and Printing 511100 Newspaper, Periodical, Book, and Directory Publishers 323100 Printing and
Support Activities 8640 Civic, Social, and Fraternal Associations 8610 Business
Associations
8620 Professional Membership Organizations 8630 Labor Unions and Similar Labor Organizations 8690 Membership Organizations, not elsewhere classified 831400 Civic and Social
Organizations
813900 Business, Professional, Labor, Political, and Similar Organizations 4840 Cable and Other Pay Television Services 515200 Cable and Other Subscription Programming 6010 Central Reserve Depository Institutions 6020 Commercial
Banks
6030
Savings
Institutions
521100
Monetary Authorities -
Central Bank
522200
Nondepository Credit
Intermediation
522100
Depository Credit
Intermediation
611300 Colleges, Universities, and Professional Schools
611200 Junior Colleges
7370 Computer Programming, Data Processing, and Other Computer Related Services 541500 Computer Systems Design and Related Services 518200 Data Processing, Hosting, and Related Services 518100 Internet Service Providers and Web Search Portals 8350
Child Day Care
Services
624400
Child Day Care
Services
designation)
999100
Federal Executive
Branch
999100 Federal Executive Branch (OES designation) 999100 Federal Executive Branch and United States Postal Service (OES designation) 6710 Holding
Offices
551100
Management of Companies and
Enterprises
8060 Hospitals