UNDERSTANDING REACTIONS TO RESULTS OF A SELF-SAMPLING HPV TEST AMONG WHITE AND BLACK WOMEN INFREQUENTLY SCREENED
FOR CERVICAL CANCER IN NORTH CAROLINA
By Lavanya Gupta
A paper presented to the faculty of The University of North Carolina at Chapel Hill in partial fulfillment of the requirements for the
degree of Master of Public Health
in the Department of Maternal and Child Health. Chapel Hill, N.C.
April 7, 2016
Approved by:
_____________ First Reader:
_ _____________
ABSTRACT Background
Over 4,000 women die from cervical cancer every year in the United States. Over half are due to lack of routine screening, which disproportionally affects racial/ethnic minority women. Home-based HPV self-testing may increase screening among hard to reach women. Little is known regarding women’s reactions to receiving HPV self-test results on the phone, an important consideration in determining the feasibility of self-testing. This study’s objective is todetermine women’s reactions to their HPV self-test results, and the delivery method, stratified by race/ethnicity.
Methods
Under-screened, low-income North Carolina women from 10 counties were recruited. A total of 202 women (78 White; 124 Black) collected and returned their self-test sample, and completed an acceptability questionnaire. Analyses examined reactions based on HPV self-test results at baseline and follow-up, and predictors of feeling afraid of what the HPV self-tests would say about their health.
Results
White women reported being more worried about getting cervical cancer compared to Black women. Women who received positive HPV self-test results self-reported being more likely to feel embarrassed, worried, depressed, and liking help understanding their results, than those HPV self-test negative. Women underestimated the need for help with interpreting their results. Women were more likely to report being afraid of what the self-test results would say about their health if they had lower educational attainment; were divorced, widowed, and separated; and self-reported history of genital warts.
Conclusions
INTRODUCTION
Invasive cervical cancer (ICC) is one of the most common cancers affecting women
in the United States (US). In 2016, an estimated 12,990 women in the US will be
diagnosed with ICC and 4,120 women will die from this largely preventable disease. (1)
Over 50 percent of new ICC cases occur among women who have been screened
infrequently or not at all. (2) Black and Hispanic/Latina women, particularly those who
are elderly, uninsured, poor, or otherwise underserved, carry the heaviest burden of ICC.
(3,4) Self-collection HPV tests that can be performed in a variety of settings including the
home may be a potential strategy to reach racial/ethnic minority women who are less
likely to participate in regular clinical screenings.
Virtually all ICC cases are caused by infection with high-risk oncogenic strains of
the sexually transmitted human papillomavirus (HPV), but are preventable through
vaccination and regular screening. (1,3,5) While access to routine screening has led to an
overall decline in the morbidity and mortality attributable to ICC, Hispanic/Latina
women are still less likely to have participate in routine screening and have a higher risk
of cervical cancer compared to White and Black women. (1,3,4) US cancer statistics from
2012 report that Hispanic/Latina and Black women have the highest incidence of cervical
cancer compared to all other races at 9.5 cases per 100,000 people and 9.0 cases per
100,000 people respectively, compared to 7.1 cases per 100,000 among White women.
(6) Additionally, the 2012 death rates for cervical cancer for Hispanic/Latino and Black
women are 2.7 per 100,000 people and 3.7 per 100,000 respectively, compared to 2.1 per
100,000 people for White women. (6) Along with a lower prevalence of screening, this
Previously identified barriers to cervical cancer screening include a lack of
continuum of health care due to include lack of health insurance and poor access to
medical services. (3,8) Furthermore, minority race/ethnicity, low educational attainment,
low income, limited health literacy regarding the benefits of screening, and age are
well-documented barriers to screening. (3,6) Emotional barriers to screening include feelings
of embarrassment or discomfort with pelvic examination, shame or fear of
embarrassment by results, and confusing information about cervical cancer screening. (9)
Existing literature also cites a lack of culturally appropriate care and perceived racism
from health care providers as significant barriers to regular screening. (3,4)
Hispanic/Latina women also report fatalism, stigma, and perceived lack of social support
networks associated with cancer diagnoses as significant barriers. (4)
The Papanicolaou test or Pap smear, which uses a sample of cervical cells to
detect cellular abnormalities, has been a universally endorsed method for screening
cervical cancer. (10) However, due to the relatively low sensitivity of the Pap smear for
the detection of high-grade precancerous cervical lesions, nearly one-third of new
invasive cervical cancer cases may be attributed to false negative Pap results. (10) The
US Food and Drug Administration (FDA) recently approved an HPV test as a primary
cervical cancer screening option and can be offered in conjunction with a Pap smear.
(11,12) The U.S. Preventive Services Task Force (USPSTF) currently recommends HPV
testing in conjunction with pap smears every 5 years for women aged 30-65 to increase
screening sensitivity and allow for longer intervals between screenings. (13)
Given the accuracy of the HPV test, there is interest among clinicians and
Self-collection of cervico-vaginal samples for HPV testing as an initial screen for cervical
cancer can be a viable option, with follow-up screening by Pap smear cytology or
colposcopy for women found to be HPV positive via self-collection. (14–18)
Self-collection has been shown to be nearly as sensitive as physician-based HPV testing and
more sensitive (though less specific) than pap smears alone. (19,20) The self-test allows
women to use a device in their home on their own to collect cervico-vaginal specimens
for HPV testing, and may be a good way to reach vulnerable populations and increase
initial cervical cancer screening in populations with limited resources and low cervical
cancer screening rates by potentially overcoming logistic, emotional, financial, and
stigma-related barriers to attending regular screenings.
While barriers to initial screening among under screened populations in the
United States are well documented and existing literature indicates a generally high
acceptability of a self-test in US and international populations, little is known about the
emotional response to receiving results of screenings conducted using the self-test. (21)
Limited research conducted on the psychosocial effects of cervical cancer screening
results in clinical settings indicate that women with positive HPV test results experience
feelings of distress, anxiety of having to disclose the results to their sexual partner, and
embarrassment of having a sexually transmitted infection. (9,22–24) Psychosocial
responses to screening, both before and after, are an important consideration as negative
feelings may present a barrier to subsequent screening opportunities among under
screened women. Furthermore, it raises questions regarding result delivery, especially to
regarding the meaning of their results and the need for follow-up screenings in a
culturally competent manner. (25)
Thus, we present data here to determine women’s reactions to self-test results
delivered by phone among low-income, under-screened women within the target age for
HPV testing (30 years or older). Our aim was to determine how North Carolina women
who are at high risk for cervical cancer, completed self-collection of cervico-vaginal
samples with mailed kits and returned the samples by mail, react to their HPV self-test
results and the delivery method, stratified by race/ethnicity.
METHODS
Target population and sample
Between January 2010 and September 2011, recruitment of underserved women
was conducted in 10 North Carolina counties (Wake, Durham, Harnett, Guilford, Wayne,
Cumberland, Robeson, Richmond, Hoke and Scotland) via the distribution of flyers,
referral of callers from the United Way 2-1-1 social assistance hotline, and newspaper
and radio advertisements. Potential participants were screened for eligibility by calling a
toll-free telephone hotline, staffed 24 hours per day by trained personnel from the
American Sexual Health Association (ASHA). Women were eligible to participate if they
(i) had not received a Pap smear in the previous 4 years, (ii) lived in North Carolina, (iii)
were not pregnant, (iv) had not undergone a hysterectomy, (v) were between 30 and 65
years of age, and (vi) met one of the following income criteria: (a) had children that
insurance, or (c) were uninsured and living at or below 250% of the federal poverty level
(determined by household income and size).
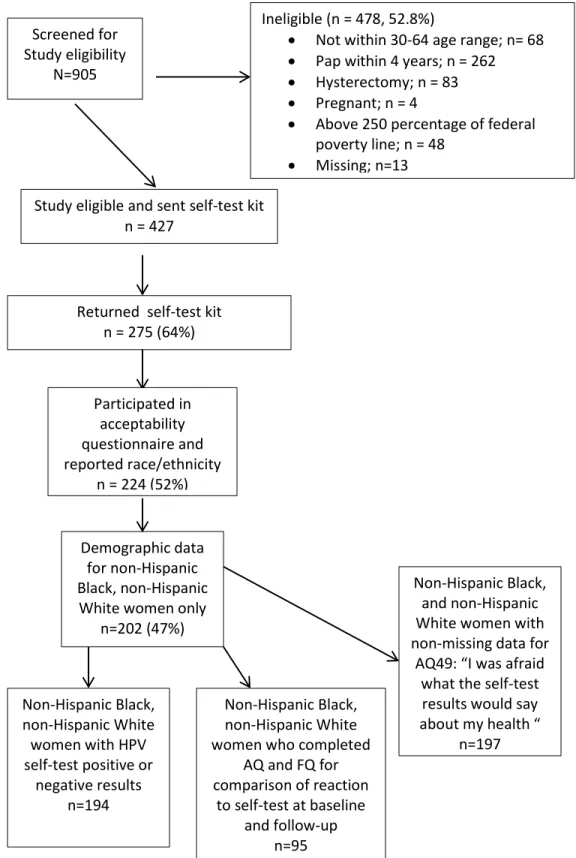
The initial sample included women who took and returned their self-samples,
reported their race/ethnicity, and participated in the acceptability questionnaire (n=224).
Only women who identified as non-Hispanic White or non-Hispanic Black were included
in the final analysis (n=202). Women who identified as Hispanic (n=12), Asian (n=2),
American Indian or Alaska Native (n=6), or mixed race/ethnicity (n=2), were not
included; the study was not powered to include these races/ethnicities individually. A
sensitivity analysis concluded that including these women in a third racial category called
“other” did not significantly alter the results, and they were subsequently dropped from
the sample (Figure 1).
Procedures
Eligible women were mailed a self-collection kit containing a brush for collecting
a cervico-vaginal sample collection device, a vial of preservation media, simple 1-page
illustrated instructions for collecting the sample, and a prepaid mailer to return their
self-collected specimen for HPV testing. The package also contained a list with contact
information of local clinics that perform low-cost or free Pap smears, and informed
consent and HIPAA authorization forms for participants to complete and return. When
results were available, the ASHA call center called participants to provide their HPV
self-collection results. During this call, agents encouraged participants to obtain a
clinic-based Pap smear; provided them with information where to obtain a free or low-cost Pap
in their county; and administered a questionnaire to assess beliefs, knowledge, and
completion or after two months without notification, participants were contacted to
complete a follow-up questionnaire. Study participants received grocery store gift cards:
(i) $30 for returning the self-collection kit and completing the acceptability questionnaire,
(ii) $10 for reporting completion of a Pap smear (either via provided postcard or
verbally), (iii) and $5 for completing the follow-up questionnaire.
The study protocol was reviewed and approved by the University of North
Carolina at Chapel Hill Institutional Review Board.
Measures
Self-collection sample: Participants collected cervico-vaginal samples using a
Viba brush (Rovers Medical Devices, BV; Oss, The Netherlands) and placed the brush
head in a 10-ml. vial of Scope mouthwash, previously determined to be a stable
preservation medium. [16]). Specimens were de-identified, frozen, and shipped in weekly
batches to the Cleveland Clinic laboratory (Cleveland, OH) for high-risk HPV infection
testing using the Hybrid-Capture II HPV test (QIAGEN Corporation, Gaithersburg, MD).
Acceptability questionnaire (AQ): Questionnaire items focused on participants’
perceptions of their experience completing HPV testing by self-collection (referred to as
“self-test”), including the clarity of instructions, use of the brush, attitudes and/or
concerns about the test, and returning the self-collection kit by mail (primary outcome of
the study). Questions also gauged the quality of and attitudes towards the self-collection
experience, as well as feelings regarding returning the self-collected sample by mail. In
addition, the survey assessed participants’ HPV knowledge, past medical and
Follow-up questionnaire: In the follow-up questionnaire (FQ), women were asked
whether and where they had undergone a Pap smear to follow-up on their HPV
self-collection. Items addressed their experiences with the Pap smear (e.g., “How much pain,
if any, did you have when you got the Pap smear?”), their past histories of cervical
disease and its evaluation and treatment, their attitudes and concerns with Pap smears
(e.g. “I worried that the Pap smear exam might not be clean” and “My husband or sexual
partner did not want me to get a Pap smear”) and their responses to their personal Pap
smear results. The follow-up questionnaire also reassessed their responses to the HPV
self-test results.
Data analysis
Demographic data, time since last Pap smear, and attitudes towards HPV and
cervical cancer were assessed for 202 women. Initial reactions to self-test results and
result delivery based on 12 selected questions from the AQ (10) and FQ (2). The AQ
questions were analyzed for a total of 194 women who received either a positive (n=29)
or negative (n=165) result; this included 73 White women and 121 Black women. The
FQ questions were analyzed for women who completed both the AQ and FQ (n=93) and
received either a positive (n=20) or negative (n=73) result; this included 35 White women
and 58 Black women. A two-sided t-test was used to compare variation in the continuous
variables and Pearson’s chi-squared test was conducted to compare variation in
categorical variables, by race (White and Black).
To assess changes in responses to the reaction-specific questions with time,
as baseline) and FQ were analyzed (n= 95). Differences in reporting between baseline
and follow-up were assessed using Pearson’s chi-squared test.
The final portion of the analysis assessed demographic and health behavior
predictors of women’s concern regarding what their self-test results would say about their
health. This question appeared in the AQ and offers additional context on the
psychosocial impact of interpreting the self-test results (n=197). Twenty-two categorical
variables from the acceptability questionnaire including race and age were included based
on their mention in existing literature on cervical cancer risk. Participants who indicated
that they strongly or moderately agreed that they were afraid of what the self-test results
would say about their health were attributed a value of 1 while participants who indicated
that they strongly or moderately disagreed were attributed a value of 0. Crude odds ratios
with 95% confidence interval was calculated for each covariate, followed by odds ratios
with 95% confidence intervals adjusted for race and age, two documented covariates of
cervical cancer screening. All results were considered statistically significant at p<0.05.
All analyses were conducted in Stata Statistical Software, Release 14.0 (Stata Corp,
Figure 1: Final analysis sample -Acceptability of a mailed HPV† self-resting kit for use with high risk, low income women in North Carolina, 2011
†HPV=Human Papillomavirus, a sexually transmitted infection causing virtually all cervical cancer
cases
Screened for Study eligibility
N=905
Ineligible (n = 478, 52.8%)
• Not within 30-64 age range; n= 68
• Pap within 4 years; n = 262
• Hysterectomy; n = 83
• Pregnant; n = 4
• Above 250 percentage of federal poverty line; n = 48
• Missing; n=13
Study eligible and sent self-test kit n = 427
Returned self-test kit n = 275 (64%)
Participated in acceptability questionnaire and reported race/ethnicity
n = 224 (52%)
Demographic data for non-Hispanic Black, non-Hispanic White women only
n=202 (47%)
Non-Hispanic Black, non-Hispanic White women with HPV self-test positive or
negative results n=194
Non-Hispanic Black, and non-Hispanic White women with non-missing data for
AQ49: “I was afraid what the self-test
results would say about my health “
n=197 Non-Hispanic Black,
non-Hispanic White women who completed
AQ and FQ for comparison of reaction
to self-test at baseline and follow-up
RESULTS
Table 1: Demographic data for 202 infrequently screened women in North Carolina†
†N=202 includes female participants who completed the acceptability questionnaire. Those identifying as
Hispanic/Latina, Asian, American Indian/Alaska Native, or “other” were not included in analyses SD=standard deviation from median value; GED= General Education Development certification
‡P-values based on 2-sided t-test for time since last pap and age; remaining p-values based on Pearson’s Chi-squared test. All calculated using non-missing data only
§ Statistically significant at α=0.05 comparing mean number of live births and urbanicity between White
and Black women
Among 202 participating women (78 White; 124 Black), the median age was 44
Overall
N (range/ %) White Black P-value ‡
N (%) 202 78 (38.6%) 124 (61.4%)
Time Since Last Pap (years) Mean (SD)
Median (Range) 5.9 (2.6) 5 (4-13) 6.3 (2.9) 5 (4-13) 5.6 (2.3) 5 (4-11) 0.07
Age (years) Mean (SD)
Median (Range) 44 (30-64) 43.8 (8.3) 44 (30-64) 43.1 (8.1) 44 (30-44) 44.2 (8.5) 0.40 Number of live births
Mean (SD)
Median (Range) 2.4 (1.6) 2 (0-8) 2 (0-6) 2 (1.4) 2.6 (1.7) 2 (0-8) 0.02
§
Education
Less than GED or HS diploma High school diploma/ GED Some college or more
42 (20.8%) 76 (37.1%) 75 (37.1%) 19 (24.4%) 22 (28.2%) 32 (41%) 23 (18.5%) 53 (43.73%)
43 (34.7%) 0.21
Marital status
Married or living as married Divorced/ separated/ widowed Single never married
57 (28.2%) 52 (25.7%) 85 (42.1%) 28 (35.9%) 21 (26.9%) 28 (35.9%) 29 (23.4%) 31 (25%)
57 (46%) 0.1
Annual household income (USD) <$10,000 $10,000-$20,000 $20,000+ 87 (43.1%) 70 (34.6%) 29 (14.4%) 30 (38.5%) 35 (44.9%) 10 (12.8%) 57 (46%) 35 (28.2%)
19 (15.3%) 0.06
Urbanicity Rural
Urban 162 (80.2%) 40 (19.8%) 21 (26.9%) 57 (73.1%) 105 (84.7%) 19 (15.3%) 0.04
§ Insurance Status None Medicaid Military/Blue Cross/Other 126 (62.4%) 51 (25.6%) 18 (8.9%) 50 (64.1%) 18 (23.1%) 9 (11.5%) 76 (61.3%) 33 (26.6%)
9 (7.3%) 0.39
Religious preference No religion Baptist Christian, non-Baptist Other religion 21 (10.4%) 75(37.1%) 60 (29.7%) 8 (4%) 12 (15.4%) 25 (32%) 27(34.6%) 1 (1.3%) 9 (7.3%) 50 (40.3%) 33 (26.6%)
years). Participating White women had a slightly lower mean number of live births (n=2)
than Black women (n=2.6), p=0.02. Distribution of educational attainment, insurance
status, and religious preference did not appear to notably differ between white and black
participants. Black women were more likely to live in urban areas (84.7%) compared to
White women (73.1%), p=0.04.
Table 2: Attitudes and beliefs of infrequently screened women (n=202) †
†N=202 includes participants who completed the acceptability questionnaire. Those identifying as
Hispanic/Latina, Asian, American Indian/Alaska Native, or other not included in analysis
HPV=Human papillomavirus, a sexually transmitted infection causing virtually all cervical cancer cases
‡P-values based Pearson’s Chi-squared test. All calculated using non-missing data only
§Statistically significant at α=0.05 comparing worry about getting cervical cancer between White and
Black women
Most women were slightly worried or not at all worried about getting HPV
infection (73.1% White; 71.8% Black)(Table 2). White women reported being more
very/moderately worried about getting cervical cancer (52.6%) as compared to Black
women (41.4%), p=0.004. Most women completely (41.1%) or moderately (40.6%)
Overall
N=202 (%) White (n=78) (n=124) Black valueP- ‡
How worried are you about getting HPV? Very/ moderately
A little/ not at all 146 (72.3%) 46(22.8%) 17 (21.8%) 57 (73.1%) 29 (23.4%) 89 (71.8%) 0.80
How worried are you about getting cervical cancer?
Very/ moderately
A little/ not at all 80 (39.6%) 41 (52.6%) 34 (43.6%) 39 (41.4%) 77 (62.1%) 0.004§
111 (55%) How much do you trust the self-test to give
you accurate information about your risk for cervical cancer?
Completely Moderately A little Not at all
83 (41.1%) 82 (40.6%) 13 (6.4%) 4 (2%) 35(44.9%) 26(33.3%) 6 (7.7%) 1 (1.3%) 48 (38.7%) 56(45.2%) 7 (5.7%) 3 (2.4%) 0.45
How often do you think an abnormal self-test result means a woman is at risk for cervical cancer?
Always
trusted that the self-test gave accurate information about their risk for cervical cancer,
with no differences observed by race. Approximately 9% of women thought an abnormal
self-test always means that they are at risk for cervical cancer, though most believed that
it indicated this risk most (18.3%) or some of the time (37.6%), regardless of race.
Roughly half (49%) of the women strongly/moderately agreed that they were
afraid of what the self-test results would say about their health, regardless of result or
race (Table 3). 3.4% of women with a positive self-test result reported feeling
embarrassed or ashamed by the results compared to no women with a negative result
(p<0.001). Most women were not concerned that other people would hear their self-test
results when they were delivered (93.3%); however a higher proportion of White women
(65.8%) reported that they would share their self-test results, compared to Black women
(44.6%), p=0.04. Women with positive self-test results were more likely to feel worried
(34.5% positive, 1.2% negative; p=<0.001) and less likely to feel relieved (27.7 positive,
83% negative; p< 0.001) by their results. More women with positive self-test results
(31%) reported needing more help with understanding the results, compared to women
with negative results (2.4%), p<0.01. Most women (73.2%) strongly/somewhat agreed
that receiving their results over the phone was more private than receiving them over the
mail. 90.7% of women strongly/somewhat agreed that they felt comfortable getting the
results by phone. 62.4% of women strongly/somewhat agreed that receiving their results
over the phone was more private than talking with their doctor in person. At follow up,
90.3% of women reported understanding their self-test results. A higher proportion of
women with positive self-test results (30%) reported that the results made them feel
Table 3: Reaction to self-test results provide to participants over the phone, stratified by positive versus negative HPV results and by reported race (N=194) †
Total (n, %)
N=194 Positive self-test result (n, %) n=29
Negative self-test result (n, %)
n=165
P-value‡ White
(n, %) n=73 Black (n,%) n=121 P-value‡
I was afraid what the self-test results would say about my health
Strongly/moderately agree
Strongly/moderately disagree 95 (49%) 95 (49%) 14 (51.7%) 14 (48.3%) 80 (48.5%) 81 (49.1%) 0.68 40 (54.8%) 32 (43.8%) 55 (45.5%) 63 (52.%) 0.41
Do the results make you feel Embarrassed or ashamed
Yes
No 156 (90.4%) 1 (0.5%) 22 (76.9%) 1 (3.4%) 134 (81.2%) 0 (0%) <0.001§ 53 (74%) 1 (1.4%) 102 (84.3%) 0 (0%) 0.31
I was concerned that other people would hear my results
Strongly/somewhat agree
Strongly/somewhat disagree 181(93.3%) 11(3.8%) 28 (96.6%) 1(3.5%) 153(92.7%) 10(6%) 0.36 67 (91.8%) 6 (8.2%) 114 (94.2%) 5 (4.1%) 0.41
Do you think you will share your self-test results with anyone?
Yes
Spouse or Sexual Partner Parent
Sibling/Brother/Sister/ Other family member Friend/Co-worker Doctor
Other people with same self-test result Not reported
No
102 (52.6%)
Do the results make you feel worried?
Yes
No 146(75.3%) 12 (6.2%) 13 (44.8%) 10(34.5%) 133(80.6%) 2(1.2%) <0.001§ 52 (71.2%) 5 (6.9%) 94 (77.7%) 7 (5.8%) 0.60
Do the results make you feel relieved?
Yes
No 145 (74.7%) 20(10.3%) 14 (48.3%) 8 (27.6%) 137(83%) 6 (3.6%) <0.001§ 51 (69.9%) 7 (9.6%) 94 (77.7%) 13 (10.7%) 0.90
Would you like help understanding the results?
Yes
No 137 (7.6%) 13 (6.7%) 13 (44.8%) 9 (31%) 124 (75.2%) 4 (2.4%) <0.001§ 49 (67.1%) 4 (5.5%) 88 (72.7%) 9 (7.5%) 0.70
Receiving my results over the phone is more private than receiving the results by mail.
Strongly / somewhat agree
Strongly / somewhat disagree 142 (73.2%) 31 (16%) 23 (79.3%) 3 (13.8%) 119 (72.1%) 27 (16.4%) 0.52 53 (72.6%) 9 (12.3%) 89 (76.5%) 22 (18.2%) 0.33
I am comfortable getting self-test results by phone
Strongly / somewhat agree
Strongly / somewhat disagree 176 (90.7%) 5 (2.6%) 29 (100%) 0 (0%) 147 (89.1%) 5 (3%) 0.56 65 (89%) 1 (1.4%) 111 (91.7%) 6 (5%) 0.42
Receiving my results over the phone is more private than talking with my doctor about them
Strongly / somewhat agree
†AQ questions have M= 194 and includes all White and Black women who had either a positive or negative HPV self-test result. Indeterminate and
missing results dropped from this analysis. FQ questions have N=93 and includes women who completed the FQ and meet the same criteria for AQ questions
‡P-values based on Pearson’s Chi-squared test; calculated using non-missing data only
§Statistically significant at α=0.05
From follow-up questionnaire* Overall
(N=93) Positive self-test result (n, %)
N=20
Negative self-test result (n, %)
N=73 P-value
‡ White (n, %)
N=35
Black (n, %)
N=58 P-value
‡
I understood my self-test results
Strongly / somewhat agree
Strongly / somewhat disagree 84 (90.3%) 1 (1.1%) 19 (95%) 1 (5%) 65 (89%) 0(0%) 0.07 32 (91.4%) 0 (0%) 52 (89.7%) 1 (1.7%) 0.43
Did the self-test results make you feel depressed?
Yes
Table 4: Attitudes towards result delivery before results delivery and a median time of 1.5 months after delivery to 95 infrequently screened women in North Carolina†
Baseline n (%) Follow-up n (%) P-value‡
I am comfortable getting self-test results by phone
Strongly / somewhat agree 89 (93.7%) Strongly / somewhat disagree 2(2.1%)
I felt comfortable getting my self-test results by phone.
Strongly / somewhat agree 83 (87.4%)
Strongly / somewhat disagree 3 (3.1%) 0.85
Receiving my results over the phone is more private than talking with my doctor about them
Strongly / somewhat agree 60 (63.1%) Strongly / somewhat disagree 22 (23.2%)
Receiving my results over the phone is more private than talking with my doctor about them.
Strongly / somewhat agree 52 (54.7%) Strongly / somewhat disagree 31 (32.7%)
0.07
Receiving my results over the phone is more private than receiving the results by mail.
Strongly / somewhat agree 69 (72.6%) Strongly / somewhat disagree 19 (20%)
Receiving my results over the phone is more private than receiving the results by mail.
Strongly / somewhat agree 62 (65.3%) Strongly / somewhat disagree 17 (17.9%)
0.22
Would you like more help understanding the results?
Yes 9(9.5%) No 69 (72.6%)
Since you got your self-test results did you want more help understanding your results?
Yes 18 (19%)
No 67 (70.5%) 0.01
§
Actual HPV Self-Test Results
Abnormal (positive) 20 (21%) Negative 73 (76.4%) Indeterminate 1(1.1%)
Do you remember your HPV self-test results from this study?||
Abnormal (positive) 16 (16.8 %) Negative 65(68.4%) Indeterminate 1 (1.1%) Don’t know 4 (4.2%)
<0.001§
†N=95 includes participants who were asked all follow up questionnaire items and identified as white or black
‡P-values based on Pearson’s Chi-squared test; calculated using non-missing data only
§ Statistically significant at α=0.05
||Respondents who reported “don’t know” or are missing received their self-test results
HPV=Human papillomavirus, a sexually transmitted infection causing virtually all cervical cancer cases
The median time between baseline and follow-up for the 95 women who
completed both was 45 days, or 1.5 months (Table 4). The majority of women
strongly/somewhat agreed being comfortable receiving HPV self-test results by phone at
baseline (93.7%) and follow-up (87.4%). There was no significant variation over time
phone was more private than talking with their doctor in person (63.1% at baseline;
72.6% at follow- up), or that it was more private than receiving them in the mail (72.5%
at baseline; 65% at follow-up). However, notably more women, reported wanting help
understanding their results at follow-up (19%) as compared to baseline (9.5%), p<0.001.
Most of these women had positive self-test results (Figure 2).
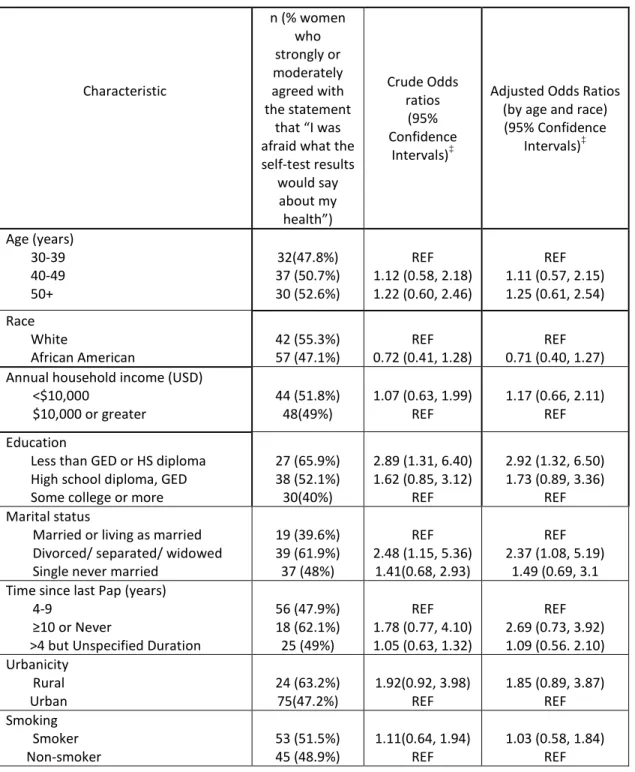
Table 5: Predictors of strongly or moderately agreeing, “I was afraid what the self-test results would say about my health” (N=197) †
Characteristic
n (% women who strongly or moderately agreed with the statement
that “I was afraid what the self-test results would say about my health”) Crude Odds ratios (95% Confidence Intervals)‡
Adjusted Odds Ratios (by age and race) (95% Confidence Intervals)‡ Age (years) 30-39 40-49 50+ 32(47.8%) 37 (50.7%) 30 (52.6%) REF 1.12 (0.58, 2.18) 1.22 (0.60, 2.46)
REF 1.11 (0.57, 2.15) 1.25 (0.61, 2.54) Race
White
African American 42 (55.3%) 57 (47.1%) 0.72 (0.41, 1.28) REF 0.71 (0.40, 1.27) REF
Annual household income (USD) <$10,000
$10,000 or greater 44 (51.8%) 48(49%) 1.07 (0.63, 1.99) REF 1.17 (0.66, 2.11) REF
Education
Less than GED or HS diploma High school diploma, GED Some college or more
27 (65.9%) 38 (52.1%) 30(40%)
2.89 (1.31, 6.40) 1.62 (0.85, 3.12)
REF
2.92 (1.32, 6.50) 1.73 (0.89, 3.36)
REF Marital status
Married or living as married Divorced/ separated/ widowed Single never married
19 (39.6%) 39 (61.9%) 37 (48%)
REF 2.48 (1.15, 5.36)
1.41(0.68, 2.93)
REF 2.37 (1.08, 5.19)
1.49 (0.69, 3.1 Time since last Pap (years)
4-9
≥10 or Never
>4 but Unspecified Duration
56 (47.9%) 18 (62.1%) 25 (49%)
REF 1.78 (0.77, 4.10) 1.05 (0.63, 1.32)
REF 2.69 (0.73, 3.92) 1.09 (0.56. 2.10) Urbanicity
Rural
Urban 24 (63.2%) 75(47.2%) 1.92(0.92, 3.98) REF 1.85 (0.89, 3.87) REF
Smoking Smoker
Internet use Daily/Weekly
Less often than that 41(58.6%) 54 (45%) 0.58 (0.32, 1.05) REF 0.58 (0.32, 1.07) REF
Religious preference No religion Baptist Christian, non-Baptist Other religion 11 (57.9%) 39(52.7%) 26 (43.3%) 5 (50%)
1.23 (0.44, 3.42) REF 0.69 (0.35, 1.36) 0.90 (0.21. 3.86)
1.01 (0.35, 2.91) REF 0.61 (0.30, 1.24)
1.02 (0.23, 3.46 Insurance
Insured
Non-insured 30 (42.9%) 68(54%) 1.56(0.87, 2.82) REF 1.56 (0.86, 2.81) REF
Insurance None Medicaid Military/Blue Cross/Other 68(54.4%) 22 (44%) 7(41.8%)
1.49 (0.77, 2.88) REF 0.89 (0.45, 2.72)
1.44 (0.74, 2.80) REF 0.78 (0.25, 2.45) Age at First Intercourse
< 16
≥ 16 50 (55.6%) 30(50.9%) 1.03 (0.54, 1.96) REF 0.91 (0.46, 1.80 REF
Number of live births 0/1 2 3+ 28 (49.1%) 28 (54.9%) 40 (47.6%) REF 1.26 (0.59, 2.69)
0.94 (0.48.1.84)
REF 1.32 (0.61, 2.84) 1.01 (0.51, 2.01) Need help reading written health
materials Never
Rarely / Sometimes/ Often / Always
80 (47.9%)
18 (62.1%) 1.78 (0.79, 3.99) REF 1.60 (0.7 3.69) REF
Current use of contraception Yes
No
Not needed (No sexual partner / post-menopausal) 38 (59.4%) 23(44.2%) 17 (48.6%) REF 0.54 (0.26,1.14) 0.64(0.28, 1.48) REF 0.51 (0.24, 1.09) 0.55 (0.23, 1.29)
Completely comfortable using tampon Yes
No 35 (47.9%) 57 (52.3%) 0.84 (0.46, 1.52) REF 0.83 (0.46, 1.52) REF
Self-reported history of abnormal Pap Never
Once
Two or more times
33 (47.8)% 14 (58.3%) 13 (41.9%)
REF 1.53 (0.59, 3.90) 0.76 (0.33, 1.73)
REF 1.45 (0.56, 3.77) 0.71 (0.29, 1.72) Self-reported history of HPV infection
or cervical disease No
Self-reported history of genital warts
No Yes
87 (47.5%)
10 (83.3%) 5.52 (1.18, 25.88) REF 5.45 (1.16, REF 25.67) Self-reported history of sexually
transmitted infections No
Yes 65 (48.2%) 31 (52.5%) 1.19 (0.65, 2.20) REF 1.24 (0.66, 2.31) REF
†Non-missing data for this question, excluding those who responded and ‘do not know’, or race other than
White/Black)
‡Odds ratios calculated based on non-missing data only
HPV=Human papillomavirus, a sexually transmitted infection causing virtually all cervical cancer cases
§HPV knowledge index=score calculated based on number of correctly answered questions out of 5 total
questions about HPV
Predictors of strongly or moderately agreeing that the women were afraid of what
the self-tests results would say about their health are depicted in table 5 and include 197
women who answered this question in the AQ (Table 5). The majority of variables were
not found to be statistically significant predictors, even when adjusted for age and race.
However, women with less than a GED or high school diploma had 2.92 times the odds
of strongly or moderately agreeing that they were afraid of what the self-test results
would say about their health than women with some college education or more when
adjusted for age and race (CI: 1.32, 6.5). Women who were divorced, separated, or
widowed had 2.37 times the odds of strongly or moderately agreeing that they were
afraid of what the self-test results would say about their health than women who were
married or living as married, adjusted for age and race (CI: 1.08, 5.19). Furthermore,
women who reported having genital warts had 5.45 times the odds of strongly or
moderately agreeing with that they were afraid of what the self-test results would say
DISCUSSION
Among over 200 infrequently screened women in North Carolina, White women
reported being more concerned about getting cervical cancer and more willing to share
their HPV self-test results with others as compared to Black women. Regardless of race,
women who received positive self-test results were more likely to feel embarrassed,
worried, and depressed by their results. Conversely, women who received negative
self-test results were more likely to feel relieved by their results. Another key finding is that
the women underestimated the need for help with interpreting their self-test results,
particularly those with a positive result. Women were more likely to report being afraid
of what the self-test results would say about their health if they had lower educational
attainment; were divorced, widowed, and separated; and self-reported history of genital
warts.
Our findings that feelings of embarrassment, worry, and depression are not
uncommon among women with positive self-test results were consistent with previous
cervical cancer screening studies. Two studies on psychosocial impacts of abnormal Pap
smears and positive HPV test results three European countries and the UK respectively
showed that women reported initial feelings anxiety, panic and stress after being told
their results over the phone. (23,24) More than half of the women in the European study
had lingering feelings of worry or depression after discussing their test results and
follow-up treatment after speaking with their gynecologist. (23) Additionally, the UK
study findings support that women with visible genital warts were more likely to have
negative psychosocial responses to positive results. (24) However, unlike our findings,
testing showed that women were highly anxious about disclosing their results to family or
close friends due to stigma associated with an STI such as HPV. (9) It is important to
note that these studies did not specifically target typically hard to reach and racial
minority women. Future studies of this nature should continue to focus on result delivery
in these populations to better understand their reactions and how women can be
counseled on their results in a culturally appropriate and respectful manner.
Confusion in interpreting cervical cancer screening results is a noted challenge,
(9,22) particularly among underserved women. This may indicate a lack of counseling
when women first receive their results, or a poor understanding of the information they
receive. Addressing confusion regarding HPV self-test results is critical to its
effectiveness; the low specificity of this test necessitates the follow up a positive result
with a Pap smear and/or colposcopy in order to detect the presence of pre-cancerous
cervical lesions or invasive cancer. Women must be able to understand their results in
order to receive the appropriate follow-up care.
This study highlights that women, especially those with positive results, may not
immediately realize that they need help understanding their results, and result delivery
should include referral to information sources that they can access for further clarification
as needed. Women participating in this study were given a pamphlet with additional
information regarding self-test results, and had access to a 24-hour toll-free hotline
number that was staffed by trained personnel from ASHA. The increase in women who
reported wanting help interpreting their results at follow-up may also be associated with
the delivery method. While the majority of women reported that receiving their results
it is possible that this delivery method limited the opportunity to ask questions or offer
points of clarification since it was not possible for the women or the ASHA staff to pick
up on visual cues of confusion. Furthermore, the women may have been less willing to
ask clarifying questions over the phone than in person, an aspect that was not explicitly
examined in this study.
This study had a number of strengths. First, this study is the first we know of on
feasibility of mailed HPV self-test screening among high-risk women in the United
States. Many US-based studies on self-test acceptability are clinic-based and asked about
hypothetical acceptability of an at-home self-test, did not have the scope for
understanding of reaction to results in this context. Second, the acceptability
questionnaire used in this study considered a variety of potential confounders, including
those identified in existing literature. Additionally, the eligibility criteria controlled for
income, appropriate age for HPV tests (30-65), concurrent pregnancy, and hysterectomy,
allowing for a more homogenous study sample. Furthermore, the study focused on North
Carolina counties with relatively high incidences of cervical cancer, demonstrating the
need for this research in this geographic area.
While this study had a relatively high enrollment and self-test return rate as
compared to other cervical cancer screening studies targeting under-screened women,
(26,27) it was not powered to include Hispanic/Latina women or analyze a large number
of covariates relating to reactions to the HPV self-test. Second, there was a significant
drop in complete data between the AQ and the FQ, as a large number of women did not
complete the FQ after starting it. While loss to follow up is a common challenge, future
follow up are able to complete it. A third limitation of this study is that not all questions
pertaining to reactions to the HPV self-test results were included in both the AQ and FQ,
making it difficult to fully assess the psychosocial impact of the results over time or the
quality of the questions themselves. A future study of this nature should aim for more
consistency between the baselines and follow up questionnaires. Ultimately, larger
studies with a more nationally representative population are needed to support the
evidence base for the findings of this study.
Findings from this study can inform cervical cancer messaging to underserved
populations by emphasizing and promoting their understanding of their heightened risk
and the importance of screening. Given this study supports existing data that feelings of
embarrassment, worry and depression are common among participants with positive HPV
self-test results, result delivery should include counseling that addresses such
psychosocial effects and their need for follow-up screening. Furthermore, the counseling
should include referral to educational resources that women can access at any time to
better understand or remind themselves of the meaning and implications of their results.
As the first mailed HPV screening study among high-risk women in the United States, it
underscores several emerging psychosocial considerations of result delivery and receipt
that must be addressed in all components of cervical cancer screening outreach in a
References
1. American Cancer Society: Cancer Facts and Figures 2016. Atlanta, GA: American Cancer Society, 2016
2. Spence AR, Goggin P, Franco EL. Process of care failures in invasive cervical cancer : Systematic review and meta-analysis. Prev Med. 2007;45:93–106.
3. Bazargan M, Ph D, Bazargan SH, Ph D, Farooq M, Baker RS, et al. Correlates of cervical cancer screening among underserved Hispanic and African-American women. Prev Med 2010; 39(2004):465–473.
4. Watts L, Joseph N, Velazquez A, Gonzalez M, Munro E, Muzikansky A, et al. Understanding barriers to cervical cancer screening among Hispanic women. Am J Obstet Gynecol. 2009;201:199.e1-8.
5. Smith JS, Lindsay L, Hoots B, Keys J, Franceschi S, Winer R, et al. Human papillomavirus type distribution in invasive cervical cancer and high-grade cervical lesions : A meta-analysis update. Int J Cancer. 2007;632:621–632.
6. Centers for Disease Control and Prevention. Cervical Cancer Statistics. Updated 20 August 2015.
7. Downs LS, Smith JS, Scarinci I, Flowers L, Parham G. The disparity of cervical cancer in diverse populations. Gynaecol Oncol. 2008;109:22–30.
8. CDC. Cancer screening—U.S., 2010. MMWR Morb Mortal Wkly Rep, 61 (3) (2012), pp. 41–45
9. Bukowska-durawa A, Luszczynska A. Cervical cancer screening and psychosocial barriers perceived by patients . A systematic review. Contemp Oncol (Pozn) 2014; 18:153-159.
10. National Institutes of Health. Cervical Cancer. National Institutes of Health; October 2010. Avaialable from:
http://report.nih.gov/nihfactsheets/viewfactsheet.aspx?csid=76
11. Reiter PL, Mcree AL. Cervical cancer screening ( Pap testing ) behaviours and acceptability of human papillomavirus self-testing among lesbian and bisexual women aged 21 – 26 years in the USA. J Fam Plann Reprod Health Care. 2014;0:1–6.
13. U.S. Preventive Services Task Force. Screening for cervical cancer.
http://www.uspreventiveservicestaskforce.org/uspstf/uspscerv.htm. Updated July 2015.
14. Dzuba IG, Díaz EY, Allen B, et al. The acceptability of self-collected samples for HPV testing vs. the pap test as alternatives in cervical cancer screening. J Womens Health Gend Based. 2002;11:265-275.
15. Racey CS, Withrow DR, Gesink D. Self-collected HPV Testing Improves Participation in Cervical Cancer Screening: A Systematic Review and Meta-analysis. Can J Public Health. 2013;104: e159–e166.
16. Montealegre JR, Landgren RM, Anderson ML, Hoxhaj S, Williams S, Robinson DJ, et al. Acceptability of self-sample human papillomavirus testing among
medically underserved women visiting the emergency department. Gynecol Oncol. 2015;138:317–322.
17. Richman AR, Brewer NT, Liebman AK, Rinas AC, Smith JS. Optimising human papillomavirus self-testing for high risk women. Sex Transm Infect. 2011; 87:118– 123.
18. Taylor S, Wang C, Wright TC, Denny L, Kuhn L. A comparison of human papillomavirus testing of clinician-collected and self-collected samples during follow-up after screen-and-treat. Int J Cancer. 2011;129:879–886.
19. Petignat P, Dl F, Bruchim I, Dianuro C De, Petignat P, Faltin DL, et al. Franco EL, Coutlee F.Are self-collected samples comparable to physician-collected cervical specimens for human papillomavirus DNA testing ? A systematic review and meta-analysis. Gynecol Oncol. 2007; 105: 530-535.
20. Snijders PJF, Verhoef VMJ, Arbyn M, Ogilvie G, Minozzi S, Banzi R, et al. High-risk HPV testing on self-sampled versus clinican-collected specimens : A review on the clinical accuracy and impact on population attendance in cervical cancer screening. Int J Cancer 2013; 132: 2223-2236.
21. Cuzick J, Arbyn M, Sankaranarayanan R, Tsu V, Ronco G, Mayrand M, et al. Overview of Human Papillomavirus-Based and Other Novel Options for Cervical Cancer Screening in Developed and Developing Countries. Vaccine 2008;
26S:K29-K41.
22. Mccaffery K, Waller J, Nazroo J, Wardle J. Social and psychological impact of HPV testing in cervical screening: a qualitative study. Sex Transm Infect 2006; 82:169–175.
comparative results of a questionnaire in three European countries. BMC Womens Health 2011;11:18.
24. Mccaffery K, Waller J, Forrest S, Cadman L, Szarewski A. Testing positive for human papillomavirus in routine cervical screening : examination of psychosocial impact. Br J Obstet Gynaecol 2004;111:1437–1443.
25. Erwin DO, Johnson VA, Trevino M, Duke K, Feliciano L, Jandorf L. A
Comparison of African American and Latina Social Networks as Indicators for Culturally Tailoring a Breast and Cervical Cancer Education Intervention. Cancer Supplement 2006; 2: 368–377.
26. Sacho-Garner H, Tamalet C, Halfon P, Leandri FX, Retraite L Le, Djoufelkit K, et al. HPV self-sampling or the Pap-smear : A randomized study among cervical screening nonattenders from lower socioeconomic groups in France. Int J Cancer 2013; 133: 2681–2687.