International Journal of Research in Engineering & Applied Sciences 1 http://www.euroasiapub.org
PARAMETRIC OPTIMIZATION OF MIG PROCESS PARAMETERS
USING TAGUCHI AND GREY TAGUCHI ANALYSIS
Dinesh Mohan Arya* Vedansh Chaturvedi** Jyoti Vimal**
ABSTRACT
The aim of this study is to investigate the optimization process parameters for Metal inert gas
welding (MIG). The optimization of MIG welding operating parameters are for alloy steel work
piece using grey relational analysis method. Sixteen experimental runs based on an orthogonal
array Taguchi method were performed. This paper presents the influence of welding parameters
like wire diameter, welding current, arc voltage, welding speed, and gas flow rate optimization
based on bead geometry of welding joint. The objective function have been chosen in relation to
parameters of MIG welding bead geometry Tensile strength, Bead width, Bead height,
Penetration and Heat affected zone (HAZ) for quality target. Optimal parameters contribution
of the MIG operation was obtained via grey relational analysis. By analysis the grey relational
grade, preprocessed data, and grey relational coefficient of grey relational controllable process
factor on the individual quality characteristic targets additionally the analysis of variance
(ANOVA) is also applied to identify the welding current is the most significant factor.
Experiment with the optimized parameter setting, which have been obtained from the analysis,
are giving to validate the results.
Keywords:-MIG Welding, Grey relational analysis, Taguchi orthogonal array,Analysis of
variance(ANOVA).
*Research Scholar, Department of Mechanical Engineering, Madhav Institute of Technology & Science, Gwalior
International Journal of Research in Engineering & Applied Sciences 2 http://www.euroasiapub.org
1. INTRODUCTION
MIG (Metal Inert Gas) welding, also known as MAG (Metal Active Gas) and in the USA as GMAW (Gas Metal Arc Welding), is a welding process that is now widely used for welding a
variety of materials, ferrous and non ferrous.[1]
In gas shielded arc welding both the arc and the molten weld pool are shielded from the atmosphere by a stream of gas. The arc may be produced between a continuously fed wire and the work. The shielding gas can be both inert gas like argon and active gases like argon-oxygen mixture and carbon-di-oxide which are chemically reactive. It can be used on nearly all metals including carbon steel, stainless steel, alloy steel and aluminum. Arc travel speed is typically 30-38 cm/minute and weld metal deposition rate varies from 1.25 kg/hr when welding out of position to 5.5 kg/hr in flat position.[8]
Metal transfer across the arc, is short circuiting transfer, globular transfer, spray transfer, pulsed spray transfer. The made of weld metal transfer is determined by the following welding current, electrode size, electrode composition, electrode stick out, shielding gas. Joint type in MIG welding, the most commonly used joint type are the butt joint, corner joint, edge joint, lap joint and T-joint.[1] A metal inert gas welding process. Here, the arc is maintained between a consumable electrode and the work piece in an inert gas atmosphere. The coiled electrode wire is fed by drive rolls as it melts away at the tip. Except for aluminum, a DC source is used with the consumable electrode as the positive terminal. [7]
Arc welding process plays an important contribution in manufacturing. Metal inert gas (MIG) welding is one of the most important arcs welding Process. MIG welding is a highly complex, multi-variable system, in which the variables affecting weld quality are not clearly known. Thus developing a model for making to prophesy of weld bead geometry has turned out to be
non-trivial and number of approaches has been to exhibit to tackle the problem. In the present work, the input variables and responses for the MIG welding process have been investigated and different planning using grey relational analysis have been applied to prophesy the weld bead geometry. [3]
International Journal of Research in Engineering & Applied Sciences 3 http://www.euroasiapub.org
2 SCHEME OF INVESTIGATION
In order to maximize the quality characteristics, the present investigation has been made in the following sequence.
• Selection of base material.
• Identify the importance MIG welding process parameters.
• Find the upper and lower limits (i.e. range) of the identified process parameters. • Select the orthogonal array (design of matrix).
• Conduct the experiments as per the selected orthogonal array. • Record the quality characteristics (i.e. material properties).
• Find the optimum condition for maximizing the mechanical properties. • Conduct the confirmation test.
• Identify the significant factors.
• Check the adequacy of the developed models.
3. GREY RELATIONAL ANALYSIS
3.1. DATA PREPROCESSINGGrey data processing must be performed before Grey correlation coefficients can be calculated. A series of various units must be transformed to be dimensionless. Usually, each series is normalized by dividing the data in the original series by their average. Let the original reference sequence and sequence for comparison be represented as and , i=1, 2. . . m; k=1, 2, . . .,
n, respectively, where m is the total number of experiment to be considered, and n is the total number of observation data. Data preprocessing converts the original sequence to a comparable sequence. Several methodologies of preprocessing data can be used in Grey relation analysis, depending on the characteristics of the original sequence. If the target value of the original sequence is “the-larger-the-better”, then the original sequence is normalized as follows.[2]
(1)
International Journal of Research in Engineering & Applied Sciences 4 http://www.euroasiapub.org
(2)
However, if there is “a specific target value” then the original sequence is normalized using.
(3) Where OB is the target value.
Alternatively, the original sequence can be normalized the simplest methodology that is the
values of the original sequence can be divided by the first value of the sequence,
(4)
Where is the original sequence, the sequence after the data preprocessing, max.
The largest value of , min : the smallest value of .
3.2 CALCULATION OF GREY RELATIONAL COEFFICIENT AND GREY
RELATIONAL GRADES:
Following the data preprocessing, a Grey relational coefficient can be calculated using the preprocessed sequences. The Grey relational coefficient is defined as follows.
(5)
Where is the deviation sequence of reference sequence and comparability sequence
International Journal of Research in Engineering & Applied Sciences 5 http://www.euroasiapub.org
ζ is the distinguishing coefficient,
A Grey relational grade is a weighted sum of the Grey relational coefficients, and is defined as
follows.
(6)
Here, the Grey relational grade represents the level of correlation between the reference and comparability sequences. If the two sequences are identical, then the value of the Grey relational grade equals to one. The Grey relational grade also indicates the degree of influence exerted by the comparability sequence on the reference sequence.
Consequently, if a particular comparability sequence is more important to the reference sequence than other comparability sequences, the Grey relational grade for that comparability sequence and the reference sequence will exceed that for other Grey relational grades. The Grey relational analysis is actually a measurement of the absolute value of data difference between the sequences, and can be used to approximate the correlation between the sequences
3.3 ANALYSIS OF VARIANCE (ANOVA)
Analysis of variance (ANOVA) and F-test (standard analysis) are used to analysis the experimental data as given follows. [7]
Notation:
Following Notation are used for calculation of ANOVA method C.F. = Correction factor
T = Total of all result
n = Total no. of experiments
ST = Total sum of squares to total variation.
Xi = Value of results of each experiments ( i = 1 to 16)
SY = Sum of the squares of due to parameter Y (Y = A, B, C, D,E)
International Journal of Research in Engineering & Applied Sciences 6 http://www.euroasiapub.org
XY1, XY2, XY3, XY4 = Values of result of each level (1, 2, 3,4) of parameter Y FY= Degree of freedom (D.O.F.) of parameter of Y
fT = Total degree of freedom (D.O.F.)
fe = Degree of freedom (D.O.F.) of error terms VY = Variance of parameter Y
Se = Sum of square of error terms Ve = Variance of error terms FY = F-ratio of parameter of Y SY’ = Pure sum of square
CY= Percentage of contribution of parameter Y Ce = Percentage of contribution of error terms CF = T2/n
ST = ∑i=1 to 16 Xi2 – CF
SY = ( XY12/NY1 + XY22/NY2 + XY32/NY3 +XY42/NY4) – CF fY = ( number of levels of parameter Y) – 1
fT = ( total number of results)-1 fe = fT - ∑fY
VY = SY/fY Se = ST - ∑SY Ve = Se/fe FY = VY/Ve
SY’ = SY – (Ve*fz) Pz = SY’/ST * 100% Pe = ( 1- ∑PY)*100%
4. EXPERIMENTAL PROCEDURES
4.1 EXPERIMENTAL SETUPExperiments were conducted MIG welding machine equipment which is shown in fig 1.
International Journal of Research in Engineering & Applied Sciences 7 http://www.euroasiapub.org
Rectifier, Welding regulator. Most modern wire feed units control the wire feed speed via a DC motor and thruster control PCB to provide continuous control of Armature volts and hence RPM of motor. The MIG torch can be air cooled or water cooled and most modern air cooled torches have a single cable in which the welding wire slides through a liner. Gas flows around the outside of this liner and around the tube the liner sits in the power braid and trigger wires. MIG
torch combination have a gas nozzle, contact tip, contact tip holder, liner, swan neck, trigger, and gun plug, trigger cables, current cable, gas hose. The shielding gas should also have a pronounced effect on the following aspects of the welding operation and the resultant weld. Arc characteristics, Mode of Metal Transfer, Penetration and Weld Head profile, Speed of Welding, Undercutting Tendency, and Cleaning Action Weld Metal Mechanical Properties. A basic position or starting point would be Aluminum – Argon, Magnesium – Helium, Copper Alloys – Argon – Helium Mix, Steel – Carbon dioxide not commonly used, Today, Argon-Carbon dioxide mix is preferred.
Figure 1: MIG welding machine setup 4.2 SELECTION OF MATERIAL
International Journal of Research in Engineering & Applied Sciences 8 http://www.euroasiapub.org
hardness. So called high speed steels are of composition that have good wear resistance and retain their hardness of high temperature. A superior brand of high speed steel has the following composition as per ISS Carbon (0.70%), Tungsten (18.00%), Chromium (4.00%), and Vanadium (1.00%).
4.3 RECORD OF QUALITY CHARACTERISTICS
To evaluate the quality of MIG welds measurement of weld pool geometry are performed. In this study the bead width, bead height, penetration and heat affected zone (HAZ) of weld pool are used to describe the weld pool geometry measured by Bridge cam gauge (BCG). These parameters measured accurately and one time measured by (BCG).
Tensile specimen of necessary dimension as per ASTM E8M were separated out from welding coupon plates and test were measured on 400 KN computer control universal testing machine. The specimen loaded at the rate of 1.5 KN/min as per ASTM specification. So that tensile specimen under goes deformation. The specimen finally fails after necking and load vs displacement was recorded. The tensile property higher the better quality characteristic.
4.4 SELECTION OF THE MIG WELDING PARAMETERS AND THEIR LEVELS
In this study, the experimental plan has five variables, namely, Wire diameter, Welding current, Arc voltage, Welding speed, and Gas flow rate. On the basis of preliminary experiment conducted by using one variable at a time approach, the feasible range for the welding parameters was defined by the Wire diameter (0.8-1.2mm), Welding current (80-110amp), Arc voltage (18-19.5VOLT), Welding speed (45-55cm/min), Gas flow rate (10-15ltr/min). In the MIG welding parameters were selected, shown in Table-1.
Table 1: Parameters and their levels
Notation Process Parameter Level 1 Level 2 Level 3 Level 4
A Wire diameter (mm) 0.8 0.9 1.0 1.2
B Welding current (amp) 80 90 100 110 C Arc voltage (volt) 18 18.5 19 19.5
D Welding speed (cm/mm) 45 48 51 55
E Gas flow rate (let/min) 10 13 14 15
International Journal of Research in Engineering & Applied Sciences 9 http://www.euroasiapub.org
The application of design-of-experiments (DOE) to demand as of right anxious planning, best ground-plan of the experiment and table shown. The choose design matrix based on Taguchi L16 (45) orthogonal array consist 16 set of code condition and the experimental result for the response Tensile strength, Bead width, Bead height, penetration, and heat affected zone (HAZ) in process parameter. In the present study there 12 degree of freedom owing to the four level
welding parameters. While the reciprocal action between the parameters is neglected. Once the DOF are known the next step is choose an appropriate orthogonal array. The DOF for the orthogonal array should be greater than or at least equal to those process parameters. In this study an L16 orthogonal array is used because it has 15 degree of freedom in the welding parameters. The experiment output for the process parameter is shown in Table 2.
Figure 2 :Work piece of steel alloy
Table 2. Experimental layout using L16 orthogonal array
Experiment No.
A B C D E
1 1 1 1 1 1
2 1 2 2 2 2
3 1 3 3 3 3
4 1 4 4 4 4 5 2 1 2 3 4
6 2 2 1 4 3
7 2 3 4 1 2
8 2 4 3 2 1
International Journal of Research in Engineering & Applied Sciences 10 http://www.euroasiapub.org
11 3 3 1 2 4
12 3 4 2 1 3
13 4 1 4 2 3 14 4 2 3 1 4
15 4 3 2 4 1
16 4 4 1 3 2
5.1 EXPERIMENTAL RESULTS
Table 3. Experimental results for steel alloy
Experiment No.
Tensile strength ( N/mm2 ) Larger is better
Bead width (mm) Smaller is better Bead height (mm) Smaller is better Penetration (mm) Larger is better HAZ (mm) Smaller is better
1 260.12 8.10 0.251 1.263 5.621 2 262.17 8.19 0.259 1.264 5.720
3 271.16 8.61 0.273 1.277 5.800
4 269.27 8.50 0.260 1.278 5.770
5 265.71 8.43 0.251 1.273 5.765
6 272.18 8.65 0.275 1.288 5.806 7 252.17 7.19 0.203 0.985 3.868
8 272.00 8.61 0.281 1.291 5.996
9 257.19 7.21 0.210 1.05 4.380
10 262.11 8.10 0.235 1.212 5.720
11 281.16 8.91 0.294 1.306 6.127 12 277.91 8.77 0.288 1.298 6.099
13 261.33 8.05 0.231 1.239 5.712
14 271.16 8.51 0.271 1.281 5.937
15 255.34 7.05 0.210 0.998 4.367
International Journal of Research in Engineering & Applied Sciences 11 http://www.euroasiapub.org
Table 4. Preprocessed data results for steel alloy
Experiment No.
Tensile strength
Bead width Bead height Penetration HAZ
1 0.274 0.435 0.225 0.866 0.223
2 0.344 0.387 0.183 0.869 0.180 3 0.655 0.161 0.109 0.909 0.144
4 0.589 0.220 0.178 0.912 0.158
5 0.467 0.258 0.225 0.897 0.160
6 0.690 0.139 0.099 0.943 0.142
7 0 0.924 1 0 1
8 0.684 0.161 0.068 0.953 0.057 9 0.173 0.913 0.439 0.202 0.773
10 0.342 0.435 0.308 0.707 0.180
11 1 0 0 1 0
12 0.887 0.075 0.031 0.975 0.012 13 0.315 0.462 0.329 0.791 0.183
14 0.655 0.215 0.120 0.922 0.084
15 0.109 1 0.439 0.040 0.779
16 0.516 0.258 0.204 0.778 0.159
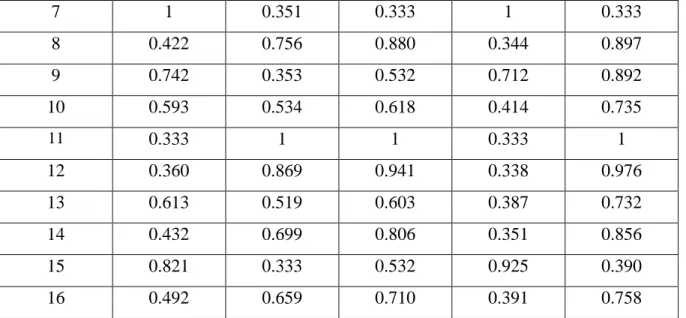
Table 5. Grey relational coefficient for steel alloy
Experiment No
Tensile strength
Bead width Bead height Penetration HAZ
1 0.645 0.534 0.689 0.366 0.691
2 0.592 0.563 0.732 0.365 0.735
3 0.432 0.756 0.821 0.354 0.776
4 0.459 0.694 0.737 0.354 0.759
International Journal of Research in Engineering & Applied Sciences 12 http://www.euroasiapub.org
7 1 0.351 0.333 1 0.333
8 0.422 0.756 0.880 0.344 0.897
9 0.742 0.353 0.532 0.712 0.892 10 0.593 0.534 0.618 0.414 0.735
11 0.333 1 1 0.333 1
12 0.360 0.869 0.941 0.338 0.976
13 0.613 0.519 0.603 0.387 0.732
14 0.432 0.699 0.806 0.351 0.856 15 0.821 0.333 0.532 0.925 0.390
16 0.492 0.659 0.710 0.391 0.758
Table 6. Grey relational grade for steel alloy
Experiment No.
A B C D E Grey relational grade
1 1 1 1 1 1 0.585
2 1 2 2 2 2 0.597
3 1 3 3 3 3 0.627
4 1 4 4 4 4 0.600
5 2 1 2 3 4 0.595
6 2 2 1 4 3 0.632
7 2 3 4 1 2 0.603
8 2 4 3 2 1 0.659
9 3 1 3 4 2 0.546
10 3 2 4 3 1 0.578
11 3 3 1 2 4 0.733
12 3 4 2 1 3 0.696
13 4 1 4 2 3 0.570
14 4 2 3 1 4 0.628
International Journal of Research in Engineering & Applied Sciences 13 http://www.euroasiapub.org
16 4 4 1 3 2 0.602
Table7. Response Table for grey relational for steel alloy
Levels Factors
A B C D E
1 0.620 0.574 0.638 0.628 0.605
2 0.622 0.608 0.622 0.639 0.587
3 0.638 0.640 0.615 0.600 0.631
4 0.6 0.639 0.587 0.594 0.639
5.2 ANALYSIS OF VARIANCE (ANOVA)
Analysis of variance (ANOVA) was introduced by Sir Ronald Fisher. The purpose of the analysis of variance (ANOVA) is to investigate which design parameters significantly affect the quality characteristic.
Table 8. Analysis of variance (ANOVA) and F-test for steel alloy Factor DOF Sum of
squares
Mean
variance
F-ratio Sz Contribution
(%) A 3 0.002 0.00066 0.00066 0.002 6.896
B 3 0.01 0.0033 0.0033 0.01 34.483
C 3 0.003 0.001 0.001 0.003 10.345
D 3 0.004 0.0013 0.0013 0.004 13.793 E 3 0.005 0.0016 0.0016 0.005 17.241
Error 0 0.005 17.242
Total 15 0.029 0.0078 100.00
International Journal of Research in Engineering & Applied Sciences 14 http://www.euroasiapub.org
Graph between GRG and wire diameter
Graph between GRG and welding current
International Journal of Research in Engineering & Applied Sciences 15 http://www.euroasiapub.org
Graph between GRG and welding speed
Graph between GRG and Gas flow rate
Figure 3: Influence Performances For Steel Alloy Of Process Parameters On Multiple
RESULT AND DISCUSSION
After identifying the most influential parameters, the final phase is to verify the Tensile strength, Bead width, Bead height, Penetration and Heat affected zone by conducting the confirmation experiments. The A3B3C1D2E4 is an optimal parameter combination for steel alloy of the MIG
welding process via the Grey relational analysis. Therefore, the condition A3B3C1D2E4 of the optimal parameter combination of the MIG welding process was treated as a confirmation test. If the optimal setting for steel alloy with a Wire diameter 1mm, Welding current 100 A, Arc voltage 18 V, Welding speed 48 cm/min, and Gas flow rate 15 ltr/min is used, the final work piece gives the Bead width (6.05mm), Bead height (0.103mm) and HAZ (2.868mm) minimum , Tensile strength (282.16N/mm2) and Penetration (2.306mm) is maximum.
International Journal of Research in Engineering & Applied Sciences 16 http://www.euroasiapub.org
In the present study, Taguchi optimization technique pair with grey relational analysis has been adopted for evaluating parametric complex to carry out acceptable Tensile strength and Penetration higher is better. Bead width, Bead height and Heat affected zone (HAZ) lower is better of the alloy steel element to acquired by using Metal inert gas welding. After identify the predict optimal parameter setting with the help of (ANOVA) the most significant factor also
found in this case welding current is having maximum percentage contribution. So it is most significant factor in this result.
REFERENCES
[1] S.V. Sapakal1, M.T. Telsang2 “parametric optimization of MIG welding using taguchi design method”. Vol. 1/ Issue 4th / july-sept, 2012/28-30
[2] Sukhomany Pal. Santosh K. Malviya. Surjya K. Pal. Arun K. Samantaray, “Optimization of quality characteristics parameters in a pulsed metal inert gas welding process using grey-based Taguchi method” (2009)44:1250-1260
[3] A.S. shahi, S. pandey “ Modeling of the effects of welding condition on dilution of stainless steel cladding produced by gas metal arc welding procedures.” Journals of materials
processing technology 196.PP, 339-344, 2008.
[4] K. Y. Benyounis, A.G. Olabi, “optimization of different welding process using statistical and numerical approaches – A reference guide” Advance in engineering software 39 (2008) 483-496 [5] Saurav Datta, Ashish Bandyopadhyay, Pradeep Kumar Pal. Grey based Taguchi method for optimization of bead geometry in submerged arc bead-on-plate welding. International journal of Advance Manufacturing Technology (2008) 39:1136-1143.
[6] J.P. Ganjigatti, Dilip Kumar Pratihar, A. Roy Choudhury, “Global versus cluster-wise regression analysis for prediction of bead geometry in MIG welding process” Journal of
Materials processing Technology 189 (2007)352-366.
[7] N.B. Mostafa, M.N. Khajavi, “Optimization of welding parameters for weld penetration in FCAW” Achievements in material and Manufacturing Engineering Vol. 16 ISSUE 1-2 May-June 2006.
International Journal of Research in Engineering & Applied Sciences 17 http://www.euroasiapub.org
[9] Ross, PJ, Taguchi Techniques for quality engineering, second edition, 2005, TMH publishing, New Delhi.
[10] I. S. Kim, C.E. Park, K.D.V. Prasad, Yarlagadda, A study on the prediction of process parameter in the Gas Metal Arc Welding (GMAW) of mild steel using Taguchi Methods, Mater. Sci. Forum (2003) 235-238.
[11] N. Murugan, R.S. parmar, “ Effects of MIG process parameters on the geometry of the bead in the automatic surfacing of the stainless steel, “ Journal of material processing technology, vol 41, PP. 381-398, 1994.
[12] H.J. Park, D.C. Kim, M.J. Kang, S. Rhee, “Optimization of the wire feed rate during pulse MIG welding of Al sheets” Journals of Achievements in materials and Manufacturing Engineering Volume 27, by international OCSCO world.