VOLUME 15 ISSUE 2 (2017), Page 85 – 96
PROMOTING SUSTAINABLE TRAVEL BEHAVIOR THROUGH TRANSPORT POLICY MEASURES
Na’asah Nasrudin1, Yusfida Ayu Abdullah2, & Oliver Ling Hoon Leh3
1,2,3
Faculty of Architecture, Planning & Surveying UNIVERSITI TEKNOLOGI MARA (UiTM)
Abstract
This paper examines how transport policy measures have influenced travel behaviour to promote sustainable transportation. Data were collected through a survey on 384 vehicle users to represent the 36 sections of Shah Alam, Selangor. This paper also studied the readiness of an urban population to reduce car usage. Majority of the respondents stated that the increase in petrol and toll prices would be the key factors to reduce car use, and more provision of public transport would encourage them to use public transport. However, Chi-square test showed that the willingness of the respondents to use public transport has a strong relationship with the frequency of driving a vehicle. The level of willingness to use public transport is lower when a car is used more frequently. Results also suggested that the majority of the respondents were not ready to consider cycling and walking as alternatives.
Keywords: Sustainable transportation, transport policy measures, travel behaviour
Date Received: 26th July 2016
INTRODUCTION
The number of vehicles in Malaysia have increased tremendously from 5 million in 1991 to 21.4 million in 2011 with an average annual growth rate of 7.5%. The growth in the number of vehicles in the country has been 3.3 times faster than the
growth in the population (Ministry of Federal Territories and Urban Wellbeing,
2011). Road traffic has increased significantly over the years because most households today have access to two or more cars. In Shah Alam, the average number of vehicles owned per family is two, and the average number of family members with driving license is three. These figures indicate that virtually every family has a car and every family has more than one member with a driving license (Naásah N., 2013).
In Klang Valley 83% trips were made through private transport whereas
only 17% trips each day were completed using public transport. The government
has introduced various initiatives to promote more sustainable transport choices,
including improved accessibility by public transport, walking, and cycling, and to reduce the need to travel by private car. Nevertheless, travel by private car remains the predominant mode of choice in major city centres. A number of studies have shown that some people might not always drive out of need, but because of choice (Handy et al., 2005). Car features provide a psycho-social value, which influences everyone to use a car rather than other modes of transportation. Therefore, the government should enhance transport policies that reduce the dependency and need to drive a car by providing alternatives other than driving.
RESEARCH BACKGROUND
The majority of the population is aware of the impact of motor vehicles toward the environment, and concurs that motor vehicles contribute greatly toward environmental issues, such as ozone depletion, acid rain, oil spills, noise pollution, air pollution and the greenhouse effect (Naásah N., 2013). Hence, if most people are aware of the dangers of motor vehicles to the environment, what prevents car drivers to change their travel behaviour?
Anable (2005) wrote that, “psychological factors including perceptions, identity, social norms, and habit” are increasingly applied to understand travel behaviour. The theory of planned behaviour (TPB) suggests that behaviour is guided by the beliefs of an individual on the likely consequences (i.e. attitude), subjective norms (i.e. what others expect from the individual) and perceived behavioural control (i.e. the presence of factors that may help or hinder the performance of their behaviour). TPB assumes that behaviour is always planned. However, this is not often the case in reality. Travellers are often seen as habitual individuals. Therefore, the manner in which they choose to travel is often done without consideration. Habits arise from the repeated performance of behavioural sequences that require little cognitive effort to obtain a certain goal (Triandis, 1977). Verplanken, Aarts and Knippenberg (1997) found that those individuals with strong habits are less likely to seek information and investigate the different choices available to them. Therefore, to break these habits, behaviour should become more conscious and deliberate through policy interventions to raise awareness. The transport policy measures in this matter have a significant role in changing travel behaviour.
What Are Transport Policy Measures?
Transport policy measures are instruments to reduce car use and commonly referred to as travel demand management (TDM) measures on the political agenda (Kitamura, Fujii & Pas, 1997). TDM measures are of two types, which can be classified as hard or soft. Hard transport policy measures include physical improvements of infrastructure for public transport, increased costs for car use and control of road space (prohibition and rationing of car use). Hard policy measures such as road pricing, parking fees, new public transport services, or improvement of bike and walk paths are seek to change the attributes of travel, modify the objective environment and discourage negative behaviour.
Meanwhile, soft policy measures as defined by Bonsall (2005) are “positive encouragement of desirable modes.” Soft transport policy measures are also referred to as voluntary-change measures (Loukopoulos, 2007), psychological and behavioural strategies (Fujii & Taniguchi, 2006), and mobility management tools (Cairns et al., 2008). However, soft measures most commonly induce psychological changes, such as information and travel planning, which seek to change attitudes toward travel modes and encourage positive behaviours.The aim of soft transport policy measures is to influence directly the decision-making process by changing or correcting the perceptions of people on the objective environment by altering their judgements on the consequences associated with the use of different travel options, and by directly motivating them to test new alternative travel options (Bamberg et al., 2011).
Frequently implemented examples of soft transport policy measures to reduce private car use include workplace travel plans (encouraging work commuters not to use their cars), school travel plans (encouraging parents not to drive their children to school), personalized travel planning (encouraging reduced car use by persuasion, customized information and other decision aids), marketing of public transport (mass advertising campaigns) and travel awareness campaigns (increasing awareness on problems associated with car use) (Cairns et al., 2008).
METHODOLOGY
A total of 384 respondents were selected for this survey using the stratified random sampling method. The respondents represented the 36 sections of Shah Alam. The selection of the sample was calculated based on the total population, which amounted to 336,590 (with 95% degree of confidence and 5% of margin of error). The respondents were provided with a survey form with several sub-item tests to gauge their level of readiness to reduce car usage. The respondents were asked to provide an opinion on the policy measure factors that could motivate them to reduce car usage and adopt sustainable travel modes. They were also asked to provide reasons if they are not motivated to use more sustainable modes of travel. However, one limitation of this study is the refusal of the residents to participate in the survey because of time factor. The questionnaire is quite detailed and takes about 15 to 20 min to complete.
RESULTS
the increase in petrol prices would be a key factor to reduce travel and car use (Table 1). Other than that, more provisions on public transport and affordable public transport fares would also encourage them to reduce car use and opt for public transport as the main mode of travel. They also stated that the increase in toll prices would reduce frequent travel.
Figure 1 Mode of Travel to Work of Shah Alam Residents
Table 1 Rank of Opinions on Factors That Will Cause Car Use Reduction
The Role of Road Pricing in Travel Behaviour
Table 2 Influence of Petrol and Toll Price Increases on Car Use Travel Decision
Figure 2 shows the importance of parking fees in the selection decision of shopping venues. A total of 64.8% of respondents said the parking fees are important factors in the selection of shopping venue, whereas 35.2% said it was not important. This result suggests that parking pricing can also be one of the measures to control the influx of cars into the city.
Figure 2 Role of Parking Fees in Shopping Venue Selection
Readiness to Practice Sustainable Modes of Travel
Table 3 Readiness to Practice Sustainable Modes of Travel
Table 4 Reasons Why Respondents Do Not Like to Walk or Cycle
Reasons Total Percentage (%)
Hot weather 226 58.9
Walking and cycling are exhausting 202 52.6
Walking and cycling are not safe 156 40.6
Driving a car is more convenient 103 26.8
No proper cycle tracks and poor pedestrian walkways 83 21.6
Approximately 60% of the respondents did not like to walk because of the “hot weather” and 53% considered walking and cycling as “exhausting.” Approximately 41% did not like to walk or cycle because it was “not safe”. They also indicated that driving a car was more convenient than walking. “No proper cycle tracks and poor pedestrian walkways” was also one of the reasons why they refused to walk or cycle. These findings are similar to that Rose and Marfurt (2007), which revealed that distances and other aspects, such as weather conditions, physical abilities, and safety issues are often influenced by individual perception.
Figure 3 Mode of Travel to Nearby Places
This study also identified the respondents’ willingness to use public transport based on the frequency of car driving. The chi-squared test results in Table 5 indicate a value of 27.306 and significant at 0.05 level, p = 0.001. This result indicates that the willingness of the respondents to use public transport is related to the frequency of driving a car. Therefore, the respondents who drove a care more frequently were less willing to use public transport.
Table 5 Willingness to Use Public Transport Based on Frequency of Car Driving
Chi-square = 27.306 Significance = 0.001
Support on Environmental Campaign
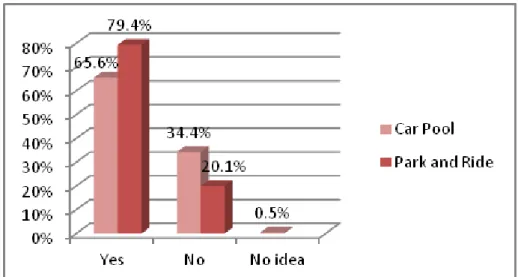
Figure 4Support on Environmental Campaign to Reduce Traffic Congestion
Agreement with the Proposed Transport Policy
Table 5 shows the analysis on level of agreement with the proposed transport policy measures to reduce traffic congestion. For this analysis, the respondent was given a list of proposed traffic policy measures, and was asked to provide an opinion whether he/she agreed or disagreed with the suggestions. The results showed that "increase the use of tolls for big cities", "raise the price of petrol and diesel" and "increase the price of parking in the city centre" were among the suggestions most disliked by the respondent, which indicate that the respondents disagree with the policy that is related to prices.
Table 6 Mean Analysis on Transport Policy Measure to Reduce Traffic Congestion
SUMMARY
This study indicates that the majority of the respondents were not ready to consider cycling or walking as alternative modes of travel. Most Shah Alam residents are dependent on their cars. For instance, majority use their cars for their daily routine trips, such as trips to the grocery store, recreation park and mosque, although the distance was less than 0.5 km. However, majority supported the "car pool" and "park and ride" concepts as a traffic congestion reduction program. However, respondents who drive more frequently have lower level of willingness to use public transport.
Road pricing has an important role in influencing the trip frequency of Shah Alam residents. The result showed that the majority of the respondents stated that the increase in petrol prices and tolls would be key factors to reduce car use, and more provisions of public transport would encourage them to use public transport. Similarly, parking fees are also important factors in the selection of shopping venue, suggesting that parking pricing can also be one of the measures to control the influx of cars into the city. This result indicate a positive sign that road pricing will become one of the successful applications for hard policy measures implementation to control traffic congestions in Malaysia. However, the government has to tackle the implementation wisely because the residents extremely disagreed with the policies that were related to prices when they were asked regarding the proposed transport policy measures to reduce traffic congestion.
RECOMMENDATIONS
To ensure a sustainable transport campaign, the residents of Shah Alam, and Malaysia in general, should have mental and physical readiness to adopt more sustainable travel modes. Soft policy measures, such as campaigns, programs, promotions and advertisements, to promote the importance of environmental protection by using sustainable travel modes should be strengthened. The campaign could be spearheaded by non-government institutions, such as public transport corporations, local authorities, health organizations and environmental lobby groups. A coordinated approach could influence public attitudes toward car ownership and usage among the next generation of potential drivers and contribute toward restraining the demand for car travel.
experimental small-scale application by researchers in Japan (Fujii and Taniguchi, 2006). If Japan has successfully implemented its plan, Malaysia has no reason not to gain the same success.
ACKNOWLEDGEMENT
The authors would like to thank the Ministry of Higher Education, Malaysia for funding this research through the RACE grant (RACE/F2/SS8/UiTM/17) and Universiti Teknologi MARA (UiTM) for supporting the research.
REFERENCES
Anable, J. (2005). ‘Complacent car addicts’ or ‘aspiring environmentalists’? Identifying travel behaviour segments using attitude theory. Transport Policy, 12(1), 65-78.
Bamberg, S., Fujii S., Friman, M., & Garling, T. (2011). Behaviour theory and soft transport policy measures. Transport Policy, 18(1), 228-235. Bonsall, P. (2005). Stimulating modal shift. In K. J. Button & D. A. Hensher
(Eds.), Handbook of transport strategy, policy and institutions (handbooks in transport, volume 6) (pp.613-634). Amsterdam: Elsevier. Cairns, S., Sloman, L., Newson, C., Anable, J., Kirkbride, A., & Goodwin, P. (2008). Smarter choices: assessing the potential to achieve traffic reduction using “soft measures”.Transport Reviews, 28 (5), 593-618. Fujii, S., & Taniguchi, A. (2006). Determinants of the effectiveness of travel
feedback programs- a review of communicative mobility management measures for changing travel behaviour in Japan. Transport Policy, 13(5), 339-348.
Garling, T., & Axhausen, K.W. (2003). Introduction: habitual travel choice. Transportation, 30(1), 1-11.
Hagman, O. (2003). Mobilizing meanings of mobility: car users’ constructions of the goods and bads of car use. Transportation Research Part D, 8(1), 1-9.
Handy, S., Weston, L., & Mokhtarian, P.L. (2005). Driving by choice or necessity? Transportation Research Part A, 39(2-3), 183-203.
Johnson P., Leicester A., & Stoye, G. (2012). Fuel for thought – the what, why and how of motoring taxation. London: Institute for Fiscal Studies and Royal Automobile Club Foundation for Motoring.
Loukopoulos, P. (2007). A classification of travel demand management measures. In T. Garling & L. Steg (Eds), Threats from car traffic to the quality of urban life: problems, causes, and solutions (pp. 275-292). Elsevier.
Ministry of Federal Territories and Urban Wellbeing (2011). Greater KL/KV comprises 10 local authorities. Retrieved from http ://app.kwpkb.gov.my/greatherklkv/overview/.
Naásah N., Abd. Rahim M. N., Harifah M. N., & Yusfida Ayu, A. (2013). Urban residents’ awareness and readiness for sustainable transportation. Procedia-Social and Behavioral Sciences. 105, 632-643.
Rose, G., & Marfurt, H. (2007). Travel behaviour change of major ride to work day event. Transportation Research Part A, 41, 351-364.
Steg L. (2005). Car use: lust and must. Instrumental, symbolic and affective motives for car use. Transportation Research Part A, 39, 147-162. Triandis H. C. (1977). Interpersonal behaviour. Monterey: Brooks/Cole Pub. Co. Verplanken, B., Aarts, H., & van Knippenberg, A. (1997). Habit, information acquisition and the process of making travel mode choices. European Journal of Social Psychology, 27, 539-560.