PLANNING MALAYSIA
Journal of the Malaysian Institute of Planners (2004) II, 35-49
THE EV ALU A TI ON OF BEACHES IN NORTHERN
MALAYSIA
Badaruddin Mohamed, Rahmat Azam Mustafa, Aldrin Abdullah, A. Ghafar Ahmad & Shida Irwana Omar
School of Housing, Building and Planning UNIVERSITI SA!NS MALAYSIA
Abstract
This paper reports on findings of an IRP A Long Term Research that among others, aims at ranking natural tourism resources found in the states of Penang, Kedah and Perlis. Selected tangible resources such as beaches and waterfalls \Vere assessed using structured evaluation sheets. This paper discusses the methods and approaches utilized in assessing the products. Five evaluating factors that were used to determine product attractiveness and quality include transportation & accessibility, accommodation, facilities & infrastructure, tourist activities and physical features. The resulting quantitative rankings can assist tourism planners and marketers in planning and plotting potential tourist routes and developing more integrated regional tourism products.
Keywords: Tourism Products, Tourism Resources
INTRODUCTION
Natural resources are often the main products that attract tourists into destinations. Throughout the world, places like the Niagara Falls, the Great Lakes, Mount Everest and Mount Fuji have established themselves as the world's icons. Back here in Malaysia, areas like Cameron Highlands, Redang and Tioman Islands, Mulu Caves as well as Mount Kinabalu continue to rank highly in the mind of visitors as the must visit places in Malaysia. While the bulk of the international travelers in Malaysia spend most of their vacation in urban destinations like Kuala Lumpur, Penang and Malacca, a growing number of visitors venture into more remote, natural areas. In the domestic front, Malaysians in general, have begun to appreciate nature spots as their preferred locations for recreational and tourism activities. Beaches, especially, are flocked by local recreationists, especially during weekends and school holidays. In the islands of Langkawi, Penang, Tioman and Pangkor, beachfront hotels are preferred than those located in the urban areas. Due to this preference, beach hotels enjoy better average room occupation rate, thus charging higher rate than
Badaruddin li1olwmed, Ralmwl A;:am Afustafa, Altlrin Abdullah, A. Ghafar Ahmad, Shida lr1ra11a Omar: The Evalllarion Of Beaches In Norlfwn1 Afafaysia
the town hotels. The growing number of establishments and destinations that promote concepts like agro-tourism, nature-tourism or even archeo-tourism reflects the increasing interest in alternative tourism in Malaysia! This trend calls for a more integrated planning of natural resources. Past studies, such as those done by Abdul Aziz and Badaruddin (2002), revealed that states in Malaysia have abundant but hidden natural treasures that can be explored and conserved as great tourism products. Their study found that many potential natural resources in Southern Kelantan are not fully developed and various f01merly successful attractions are left abandoned and unmanaged.
Tourism has become the second most important sector for the growth of the Malaysian economy. In 2003, tourism conl!ibuted over RM36 billion to the total economic revenue through foreign money exchange. Malaysia recorded an increased arrival of 13.3 million international tourists on the same year. Due to various promotion and campaign such as 'Malaysia ... Truly Asia' and 'Visit
Malaysia Year' that were publicized throughout the world, the country expects
to enjoy an average of 4% increase in international tourist arrivals for the coming years until the year of 2020. At the same time, Malaysia also encourages domestic tomism through aggressive promotions such as 'Visit State
Year' and 'Cuti-Cuti Malaysia' and hosting open houses, in order to induce
local travel. Encouraging domestic travel is also a strategy to counter the impacts of global economic slowdown, due to events such as disease outbreak and war that affected the tourism sector. However, while domestic tourism is strongly encouraged, the quality of service and facilities at local attractions must also be upgraded. Potential products need to be explored, diversified and developed into quality products. These efforts aim to expand the tourist market so that it is capable to serve both local and international tomists with the uniqueness of our tourism resources.
TOURISM PRODUCTS
Literature has highlighted several concepts and definitions related to tourism products. According to Becherel and Vellas (1999), tourism products are service products of distinct atl!ibutes; namely intangible, perishable, supply inelastic, demand elastic, complementary, inseparable, homogeneous, high fixed costs and labor intensive. Mc Grath (1999) argues that tourism products can also be wide ranging, from tourist destination, transportation, hotel, food and beverages, travel operator to the natural or man-made attraction. Tourism products at best are often distinctive and differentiated (Booms and Bitner, 1980; Gilbert, 1991).
PLANNING MALAYSIA
Jo11mal of the Malaysian Institute of Planners (2()()4)
Medlik and Middleton (1973) further defined tourism products as all activities, services and benefits associated with tourism. Kotler (1984) echoed the view that tourism products involve anything worth marketing. Tourism products can be perceived at two levels: specific and total (Middleton, 1989). At the specific level, tourism product is seen as a single transaction of, say, a tour or an airline seat. On the other hand, tourism product at the total level encompasses the entire travel experience from start to finish. As tourism products comprise tangible and intangible elements, Jefferson and Lickorish (1988) argued the symbolic characteristics such as expectation and satisfaction should be included as tourism products. Levitt (1981) first presented a typology of tourism products, namely the core product (essential service); tangible product (actual service); and augmented product (a combination of tangible and value-added features). Lewis and Chamber (1989) further defined the typology of tourism products at the three levels; they are the formal product (what tourists believe they are buying); core product (what tourists actually buy); and augmented product (a combination of core product and value-added features).
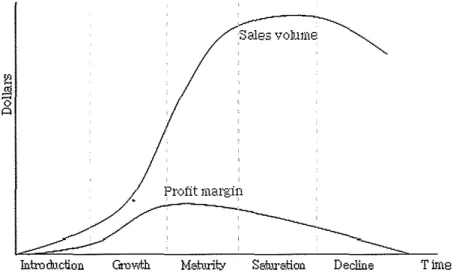
Gunn (1994) further clearly identified tourism products as the major components on the supply side. Linkages between the components of attraction, promotion, information, transportation and services should be maintained and managed to receive visitors. Smith (1994) indicated good tourism products are the results of synergistic interactions between five key elements depicted in concentric circles. The progression of elements from the core to the shell is correlated with decreasing management control, increasing consumer involvement, increasing intangibility and declining empirical measures. Goeldner et al (2000) finally put forward a model of products life cycle consisting of five phases, namely introduction, growth, maturity, saturation ands decline (see Figure I). Product life cycles have become much shorter due to changes in consuiner lifestyles and emerging technologies.
Generally, tourist attractions can be categorized as natural assets or man-made. They include nature attractions, cultural attractions, events, recreational and entertainment attractions. Nature attraction as tourism resources is the focus of this article. Natural resource refers to undisturbed or uncontaminated natural sites comprising the basic elements of water, topography, flora, fauna and climate. Oceans and seas of tropical beaches constitute a major water-based tourism resource. Other water features such as freshwater lakes, waterfalls and hot springs are also popular outdoor recreational spots. Beaches and mountains
Badarmldi11 Afolwmed, Rahmat Azam Afllstafa, Aldri11 Abdullah, A. Glwfar Ahmad, Shida lnrarw Omar: The E1·aluatio11 Of Beaches In Nortben1 Malaysia
probably ranked as the top topographic venues for tourism activities (Weaver and Opperman, 2000).
Prnfit margi\l
Intro cb.\ciion Giuwl;h Decllne Time
Source: Goeldner et al (2000)
FIGURE 1: Product life cycle.
Goeldner et al (2000) asserted that natural attractions have become increasingly
trendy amongst recreationists in many countries. The beauty of natural areas has appealed more to tourists in recent years (Valentine, 1992; Wight, 1996). Nature-base tourism is special interest tourism. Lucas (1984) referred to nature-based tourism as the enjoyment of natural areas and the observation of nature that entails low impact on the environment and is not labor intensive. Lascurain (1988) refined nature-based tourism as traveling to undisturbed or uncontaminated natural areas to study, admire and enjoy the scenery, fauna and flora, and cultural manifestations. It is important to ascertain the nature-based tourists in order to gauge their needs and requirements. Lindberg (1990) attempted to classify nature tourists into four categories: (I) hardcore; (2) dedicated; (3) mainstream; and (4) casual. Hardcore tourists are often scientific researchers, or members of educational or conservation tours. They are typically very highly educated Caucasian males. Dedicated nature tourists are usually professionals with steady incomes. They venture into protected areas to understand the local natural and cultural history. They are less demanding in their basic requirements (Boo, 1990). The mainstream tourists visit wildlife destinations as a regular trip. They may not be committed to the course of
PUNNING AIAIAYSIA Journal of the Malaysia11 lllstitute of Pla1111ers (2004)
nature and would expect relatively higher standards in food and accommodation. Finally, the casual nature tourists are people who visit nature as an itinerary of an extended trip. Both mainstream and casual nature tourists may not tolerate the crowding and basic amenities offered at some nature attractions.
TOURISM RESOURCE EVALUATION
Discussions on the concepts of tourism products and the categories of nature tourist lead to the task of evaluating the natural resources to develop viable tourism development plan in Malaysia. In Malaysia, tourism product development is much emphasized in the Eighth Malaysia Plan. A wide array of tourism products is available to accommodate all tourist interests and demands including (I) hill and island resort; (2) shopping destination; (3) thematic events; (4) sports and recreation tourism; (5) cruise tourism; (6) eco-tourism; (7) agro-tourism and home stay program; (8) cultural and heritage agro-tourism; (9) education, student and health tourism; (10) meeting, incentives, conventions and exhibitions (MICE); and (11) theme parks. Several tools have been used to access and evaluate tourism products. The Delphi Method was utilized by Bauer (2001) to determine the preferred types of tourism in the Antarctic region; and by Nae and Yue (1999) to identify potential locations for national parks in Taiwan based on specific assessment criteria. Hudson's (1998) waterfall study was based on the economic and geographic theoretical frameworks of landscape resources as an attraction, recreation and tourism product. Prior to this, Piperoglou (1967) studied the physical, aesthetic and cultural significance of the Greek western coastal region and attempted a quantifiable ranking exercise for comparative evaluation.
RESEARCH METHODOLOGY
This research is organized into six methodology stages. In the first stage,
preliminary studies and literature reviews on tourism were completed. The secondary data collection included information on tourism products, natural attractions, the role of nature in tourism development and the trend of nature-based tourism in Malaysia. The second stage intended to provide an inventory of tourist products identified within the research areas. Based on four different categories, the inventory was grouped into heritage, natural resource, rural resource and modern built attraction clusters. Stage three involved site selection and collection of primary data. The sites were selected based on the inventory of
Badaruddin !tfohamed, Rahmat A::am l'rfustafa, Aldrin Abdullah, A. Ghafar Ahmad. Shida ln1·a11a Omar: The E1·alumio11 Of Beaches In Northern Malaysia
tourism products identified through the groupings of the four categories mentioned above, while primary data was collected using observation and assessment method on the ground. The fourth stage included the synthesis between the data and the GIS database system in order to produce outputs. The fifth stage involved a discussion of the findings whereas the final stage presented the outcomes and recommendations.
Tourism Products Inventory
A product inventory encompasses established, new and potential tourism resources found within the study area of Kedah, Pulau Pinang, Perlis and Perak was collected. The products were selected from government reports such as the Structure Plans and Local Plans, brochures, websites, academic journals as well as words of mouth. Consequently, 329 resources were discovered within the study areas where 93 products were found in Pulau Pinang, 82 in Kedah, 26 in Perlis and 128 in Perak.
TABLE 1:
Tourism Resources in the Northern Region, Malaysia.
Resources P. Pinang Kedah. Perlis Perak Total
Natural 15 46 9 41 111
Heritage 62 11 5 58 136
Rural 4 2 1 5 12
Modern Attraction 9 14 3 13 39
Others 3 9 8 11 31
Total 93 82 26 128 329
As shown in Table 1, heritage resources in which Pulau Pinang and Perak are leading the packs dominate the Northern region. There are a total of 58 natural resources products in Perak whereas Pulau Pinang established 62 products around the state. The natural resources follow in second place with Kedah and Perak showing the highest counts with 41 and 46 respectively. While modern attractions and other types of resources can moderately be found in the study areas, rural resources have the least number of products within the four states. Other resources include major manmade locations like the Timah Tassoh Dam in Perlis. However, due to limitation of time and financial resources, the data collection exercise was also limited to only natural resources while abstaining the collection of heritage, modern attractions and rural data. The state of Perak was also omitted from the study for the same reason.
Evaluation Sheet
PLANNING iUALAYSJA
Jo11r11al of the Malaysian lnstilllte of Planners (2004)
Another important exercise in the study is the design of the evaluation sheet to enable the collection of primary data in stage two. Questions, classifications and criteria used in the sheet were based on reviews on previous works by Gunn (1994), Baud-Bovy and Lawson (1998), Morgan (1999), Georgulas (1970), Abdul Aziz and Badaruddin (2002) and others. This research attempts to quantify elements that contribute to a major tourism product taking into consideration the fact that supporting infrastructures like parking spaces, food availability and information system are part and parcels of the product. The sheet contains 10 different sections namely:
Particular
I. Resource Identification
2. Transportation and Accessibility
3. Accommodation
4. Eating and Drinking
5. Communication
6. Tourist information Service
7. Infrastructure
8. Type of Activities
9. Other information on the resources
Site Selection
Details
Identification number, name, type and location
Main road, entrance, transportation, parking
Type, distance, star rating, total
room
Number of establishments, distance, total seating
Hand phone coverage, number of facilities, distance
Number of services,
availability of printed materials Availability and regularity of
services
Swimming, snorkeling, recreational fishing etc. Beach length, water clarity, sand color etc.
Since there are thousands of tourism products within the areas, the study team was required to reduce the number of products for the purpose of assessment via careful selection and specific criteria. As a result, 13 site categories of natural resources based on ground accessibilities were identified. There are as listed below:
Badar11ddi111\foha111ed, Rahmat A~am Afustafa, t\ldrin Abdullah, A Ghafar Ahmad, Shida /n1"011a Omar: The E1·alua1ion Of Beaches /11 Northern Afalaysia
I. Island 8. Waterfall
2. Beach 9. Sea Park
3. Lake 10. Recreational Forest
4. River 11. Forest Reserve
5. Mountain 12. Hot Spring
6. Hill 13. Landscape and Scenery
7. Cave
The sites were evaluated using a mixed-method approach in which ground observation was supported by informal interviews with local tourism operators. The observation was designed to record the availability of public amenities, activities carried out by tourists, distances and photos on the nature and atmosphere of resources. Consequently, approximately 74% of the total products within the study areas were evaluated. Langkawi and Kedah recorded the highest percentages of completion with 83% and 87% respectively, while Perlis recorded the lowest with 44%. Variations in the outcomes are mainly due to unseen difficulties on the ground. For instance, many tourism resources in Perlis are located in the Taman Negeri (State Park) like Gua Wang Burma, Gunung Perlis, Tasik Meranti, Gunung Medan and Lata Kasih Waterfall. Visitors were actually required to obtain special permission from the authority in which the study team was unable to do.
Method of Assessment
Completed in three phases, the first involved the methods of storing and retrieving data while the second entailed data manipulation and analysis. The third phase described data output; that is, in the forms of reports and map reproductions.
Data Storage
Data collected from the ground survey is stored into a database system using Microsoft Access. Each data registered was uniquely differentiated by an ID No (or identification number) that identifies its name, location and category to enable the system to confirm the resource. Supportive secondary data was also used to ensure its precision. The total number of rooms in an accommodation facility was verified using the Accommodation Guide (Tourism Malaysia, 2002) while distances were measured from scaled maps. The database can further be extended into specific tables formed that are linked according to different levels and functions such as type of accommodation, transportation, sites etc.
Badaruddi11 /l.lohamed, Rahmar Az:am /l.1usraft1, Aldri11 Abdullah, A. Glmfar Ahmad, Shida Jnrr:ma Omar: The Eva/11atio11 Of Beftcl1es /11 Northern Malaysia
Data Coding
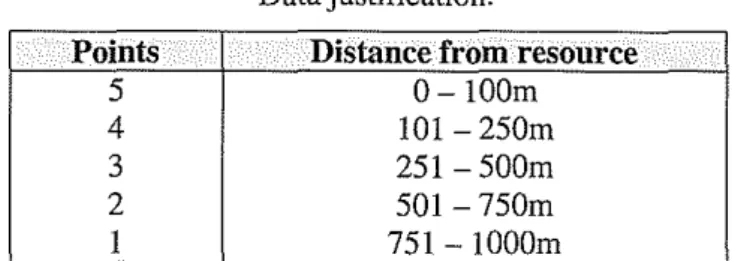
The data was then coded into specific categories using simple guidelines. Each data was transformed into points based on certain justifications (Table 2). The coded data was further analyzed using mathematical calculations.
Points 5 4 3 2 I Data Computation TABLE2 Data justification.
Distance from resource 0- lOOm
101 -250m 251 -500m 501- 750m 751- lOOOm
After the coding process was completed, the data was computed using Microsoft Excel worksheet that performed mathematical scores (Figure 2). Scores from all tables stored in the database were combined into a single worksheet to obtain total score counts. The outcomes were ranked accordingly.
,,~.i.31
l:!.t:1'dC\\
""'
.
-
•
x73%
.
Q\ » lO.
II o- ~...
-•'
L<Xo>.io.•
·~ OH-."'°'-"-' T'"""" ~=""cl Fodft:iH A<:Xr,<J"'
.
.
Jo\>.~ ~Cl> IW¥> M;~>. K~~~f.\..:4> ,,.,,.,,,i W:
"
!..'$-) m .,..
J;-.._,01.,CM'~OI-. •:.,. r,.,"'cl
'·"
x :ow"
:-01AJO>S""' ,.,,-,,a ""
'"
<00"
J.-.:mv .. ,r~:J e0<~H•rn~" /.IK.•cl
'"
"
00 " .,. J1'>o\'i.nhd, .,.,,, fl»-J<>! .,,,"
••
"
H'!..
!:'IAS<-"" Joo;•, Ei.rtic<". k~d;,I, """'.>! \'"
"
~"
...5".t-•0'1• "•'"''! ,.,
"
;g~ $) .,.L~'>l+i~~K0m IJw,,n! y~~ ;;)7 S.% 00 t:<'I P"'"' Y.>.,l'.•o~H·<l<h leMotcl y~~ m l>XI
"
hM>lM•l>'t!'<'ilu>''-\ Si'. k•d"' r;vw.i ,
.•.
"
·~ ·,~ .J~·mrmzyz . .,,L•t,o.P-»!¥4 Ttt¥> fiMCJHl 1-., m »O
"
....
1;~A,,Fl..<ih.JotitJ.Y1,K,,W, r~"'""'' Y•:
"
1:0"
..•
A• p,;;:,_3,_,.4.,S»•«; Ke~'h
"'"'"'"' )~, 00 :] ···
.
'
.
.
L~ J >-JlNUN
FIGURE 2: Data computation in MS Excel worksheet
The study team has considered five main criteria in determining the resource ranking. Each criterion was given equal weight based on its importance towards resource development (Table 3). The ranking was mainly based on transportation and accessibility, accommodation services, tourist facilities,
Badaruddin ,\fohamed, Ralmtal A.::am Mustafa, Aldri11 Abdullah, A. Glwfar Ahmad, Shida ln1'a11a Omar: The Evaluation Of Beaches In Northern Afalaysia
tourist activities and physical features. Finally, these rankings were incorporated with a GIS (Geographical Information System) to produce maps (of resources).
TABLE3 Weight of Assessment.
Criteria
Transoo1tation/ Accessibilitv Accommodation
Facilities Activities Physical features
Total
THE RESULT
Weight(%)
20 20 20 20 20
100
The natural resources evaluated comprises of 13 categories. However, this paper reports result of only one of the categ01ies, namely, beaches. Overall, the study analyzed 18 beaches along the northern states of Malaysia. Eleven beaches are in Langkawi, six beaches in Penang and one in mainland Kedah. Information obtained for each beach covers 5 main sections: physical features, accessibility, accommodation, public facilities and tourist activities. The general information that was recorded covers a description of the physical feature of the beach such as beach formation, length, color of sand and sand grade, degree of slope main vegetation type, known danger to swimmers and source of pollution. Accessibility was assessed based on available modes of transport for the public, distance of the beach from the nearest main road, airport and other transportation hubs as well as parking facilities available. For the accommodation section, the information recorded includes the number of rooms, star ratting as well as distance from the beach. Information under the section of tourist facilities included the availability of eating and drinking establishments, hand-phone coverage, amenities as well as infrastructure provided. The final section covers availability of tourist activities, which include, activities such as fishing, swimming and gliding. Although information collected regarding the description of the beach was very useful, in some cases, it was difficult to rank it, as the ranking would be highly subjective. For example, wave condition that is strong would be favorable to surfers but such a condition would not be generally appreciated by leisure swimmers especially those who worry about the safety of their children. Therefore, the final ranking of the beaches only included characteristics that can be accessed objectively. The final ranking of all the 18 beaches was made up of the five categories: transportation,
Badaruddill Mohamed, Rallmat Azam Mustafa, Aldri11 Abdullah, A. Ghafar Ahmad, Shida ln1•m1a Omar: The E1·aluatio11 Of Beaches /11 Northern Malaysia
accommodation, facilities, activities and physical features. It was decided that each category should be weighted equally as giving different weights create other problems (DeVellis, 1991).
Table 4 below illustrates the breakdown of marks given for all the beaches based on the 5 categories accessed. The Ferringhi Beach, which is located in the northern part of Penang Island, had the highest overall mark with a score of 72.35 out of 100%. The total score was contributed by 11.13% for transportation, 19.12% for accommodation, 18.80% for facilities, 9.6% for tourist activities and 13.60% for physical features. The highest ranking for Ferringhi Beach was made possible especially due to its excellent accommodation facilities (which was ranked highest), tourist facilities (also ranked highest) as well as good transport facilities (ranked third out of eighteen). Tanjung Bungah, also in Penang, came out second in the ranking with a total score of 41.74%. The overall mark comprises of 17.47% for transportation, 6.12% for accommodation, 0.55% for facilities, 5.60% for activities and 12.00% for physical features. The notable outstanding quality of Tanjung Bungah is its excellent transportation facilities (ranked highest) as well as accommodation (ranked third out of thirteen).
It is also notable that the ranking system used for this assessment showed a huge
gap between the marks obtained for Feringghi Beach compared to second ranked Tanjung Bungah Beach and the rest. The high score for Feringghi Beach was actually inflated due to extremely high scores for number of accommodations available as well as public facilities. The third ranked beach is in Langkawi Island and subsequently, beaches that were ranked between fourth and seventh were also from this famous tourist destination. Pantai Tengah, which is third in the ranking scored favorably in terms of activities (10.40%), accommodation (6.59%) and scored 7.40% for facilities (second highest for this category). The total score for this beach is 38.99%.
The fourth ranked beach is Pantai Teluk Burau, which obtained a total score of 36.90%. The excellent quality of Pantai Teluk Burau is its activities, which scored highest among the 18 beaches (14.40%) as well as public facilities (ranked fifth). Pantai Cenang, ranked overall fifth, with a total score of 34.66% came out second in the physical feature category with a score of 12.80%. The secluded Pantai Datai, famous for its luxurious resort: The Andaman and The Datai, Langkawi boast excellent physical feature qualities but their exclusivity (in the form of low number of accommodation) and secluded location (in the form of distance from airport) scored poorly in the ranking. The overall ranking for Pantai Datai was sixth, with a total score of 34.47%.
Badaruddin Afohamed, Rahmar A~m A1ustafa, Aldrin Abdullah, A. Glwfar Ahmad, Shida lrwana Omar: The Eva/11atio11 Of Beaches /11 Northern Malaysia
It is important to note that the overall ranking of the beaches was based on the parameters set by the research team. It only gives a general impression and that by setting the parameters differently (i.e. parameters can be set according to specific requirements), the rankings would give a different outcome.
TABLE4
Ranking of beaches in Northern Malaysia
Ranking Name Transportation Accommodation Facilities Activities Physical Total
20o/o 20% 20% 20% Features 100%
20%
1 Ferringhi 11,13 19,21 18,80 9,60 13,60 72,35 Beach
2 Tanjung 17,47 6,12 0.55 5,60 12,00 41,74
Bungah Beach
3 Pantai 2,60 6,59 7,40 10,40 12,00 38,99
Tengah
4 Pantai 2,20 4,50 4,60 14,40 11.20 36,90
Teluk Burau
5 Pantai 2,60 5,86 3.80 9,60 12,80 34,66
Cenang
6 Pantai 1,67 4,60 1.80 12,80 13,60 34,47
Datai
7 Pantai 7,20 0.18 3,95 12,00 9,60 32,93
Kok
8 Miami 7.87 3.78 1,55 4.00 13,60 30,80
Beach
9 Pantai 4,60 0,92 2.30 10,40 11.20 29,42
Teluk Baru
10 Shamrock 11,07 0,02 1,40 3,20 12,80 28,49 Beach
II Pantai 2,20 3.60 2,45 12,00 8,00 28,25
Tanjung Rhu
12 Pantai 5,87 0,01 3.60 7,20 ll,20 27,88
Teluk Yu
13 Pantai 3,00 0,23 S,40 6,40 12,00 27,03
Merdeka
14 Teluk 7,67 0,00 0,75 5,60 12,00 26,02
Bahang Beach
15 Pantai 2,93 2,78 1.75 7,20 11,20 25,87
Ba tu Ham par
16 Pantai 2,07 0,06 1,40 8,00 12,00 23.53
Pasir Tengkorak
Badar11ddi11 Mahamed, Rahmat Azam l\.1ustafa, Afdrin Abd11/lah, A. Glzafar Ahmad, Shida lnw111a Omar: The Ei·aluatio11 Of Beaches /11 Northern A1alaysia
17 Pasir 2,80 0,00 0,95 4,00 12,80 20,55
Panjang Beach
18 Pantai 1,53 0,02 5,00 4,80 8,80 20,16
Pasir Hi tarn
Note: High scores ui bold.
In addition, in most cases, the information would be very useful if examined individually, based on the sub category. For instance, those who are more interested in activities for tourists should focus more on what is provided as an indicator for visits. The information collected is also flexible in the sense that a ranking can be done to tailor suit different purposes. For example, ranking of physical features to suit surfers would be different compared to a ranking of features for families with children. Therefore, the information collected from this research, in the form of a database, would be especially useful for tourists and tourist operators.
It is important to note that this study has several limitations. Although it attempts to be comprehensive, it does not cover all available locations. In some instances, a site was not evaluated because no clearance was obtained from the authorities involved. In addition, some methods of data collection were based on crude assessments rather than a scientific approach (due to lack of resources and expertise). In addition, the assessments were also conducted based on one individual visit per site and that information on physical features (such as wind speed, clarity of water) might not be reflected accurately.
CONCLUDING REMARKS
This exploratory approach intends to evaluate the quality and attractiveness of natural resources that can abundantly be found in the three northern states of Peninsular Malaysia. By using a systematic evaluation technique and ranking, the result is further plotted into GIS maps which help portray the relationships between the resources. This research attempts to assist planners and decision makers to develop the resources accordingly and also pave the way for further evaluation in other parts of Malaysia as well.
Badaruddin Afohamed, Rahmat A.::am Mustafa, Aldrin Abd11/lail, A. Ghafar Ahmad, Shida lnmna Omar: The En1/uatio11 Of Beaches In Northern Afolaysia
ACKNOWLEDGEMENT
Authors would like to express appreciations to Universiti Sains Malaysia and the Ministry of Science, Technology and Environment (MOSTE) for extending the IRP A Long Term Grant that makes this research possible.
REFERENCES
Abdul Aziz Hussin and Badaruddin Mohamed. 2002. Analisis GIS Terhadap Produk-Produk Pelancongan di Kelantan Selatan. Unpublished IRPA Report. Penang, Malaysia: Universiti Sains Malaysia.
Alias Abdullah. 1995. An Integrated Method of MCDM and GIS for Land Use Planning and Environmental Resources Management. Unpublished Ph.D. Thesis. Kumamoto, Japan: .Kumamoto University.
Baud-Bovy, Manuel and Lawson, Fred. 1998. Tourism and Recreation
Handbook of Planning and Design. Oxford: Architectural Press.
Bauer, T.G. 2001. Tourism in the Allfarctic - Opportunities, Constraints and
Future Prospects. New York: The Haworth Hospitality Press.
Becherel, L., and Vellas, F. 1999. The Marketing Concept and International
Tourism Marketing. In The International Marketing Of Travel And
Tourism -A Strategic Approach, Becherel L. and Vellas F., New York:
Palgrave Macmillan. 4-5.
Boo, E. 1990. Ecotourisnz: Potentials and Pitfalls (Vo! 2). Washington D.C.: World Wildlife Fund.
Booms, B. and Bitner, M. 1980. New Management Tools for the Successful Tourism Manager. Annals of Tourism Research, 7(3), 337-351.
Ceballos-Lascurain, H. 1988. The Future of Ecotourism. Mexico Journal,
January 27, 13.
DeVellis, R.F. 1991. Scale Development: Theory and Application. London: Sage.
Georgulas, N. 1970. Tourist Destination Features. Journal Town Planning
Institute, 10, 442-446. ·
Gilbert, D.C. 1991. Tourism Marketing Its Emergence and Establishment.
Tourism Marketing, 1, 77-90.
Goeldner, C.R., Ritchie, J.R.B. and Mcintosh, R.W. 2000. eds. Tourist
-Principles, Practices, Philosophies. New York: John Wiley & Sons. Inc,.
Gunn, C.A. 1994. Tourism Planning 3rd Edition-Basics, Concepts, Cases. Washington: Taylor & Francis.
Hudson, B.J. 1998. Waterfalls - Resources for Tourism, Annals of Tourism
Research, 4, 958-973.
Jefferson, A. and Lickerish, L. 1988. Marketing tourism. Harlow: Longman.
Badar11ddi11 Afohamed, Ralmwt Azam Afustafa, Aldri11 Abdullah, A. G/wfar Ahmad, Shida /rwa11a Omar: The £valiu11io11 Of Beaches /ii Northern Afa/aysia
Kotler, P. 1984. 5'h ed. Marketing Management: Analysis, Planning and Control.
New York: Prentice-Hall.
Levitt, T. 1981. Marketing Intangible Products and Product Intangibles.
Harvard Business Review, (May/June), 37-44
Lewis, C.C. and Chamber, R.E. 1989. Marketing leadership in hospitality. New York: Van Nostrand Reinhold.
Lindberg, K. 1991. Policies for maximizing nature tourism's ecological and
economic benefits. World Resource Institute.
Lucas, P.H.C. 1984. How Protected Areas Can Help Meet Society's Solving Needs. In National parks, conservation and development, McNeely, J.A. and Miller, K.R., eds. Washington D.C.: Smithsonian Institution Press. 72-77.
McGrath, G. 1999. Managing the Service Encounter: Consistent High-Quality Delivery through 'Internal Marketing'. In The International Marketing of
Travel and Tourism -A Strategic Approach, Becherel L. and Vellas F.,
New York: Palgrave Macmillan. 160.
Medlik, S. and Middleton, V.T.C. 1973. Product Formulation in Tourism. In
Tourism and Marketing (Vol.13 ),Berne: AISET.
Middleton, V.T.C. 1989. Tourist Product. In Tourism Marketing and
Management Handbook, Witt, S. F. and Moutinho, L. eds. Hempel
Hempstead: Prentice-Hall. 573-576.
Morgan, R. 1999. A Novel, User-Based Rating System for Tourist Beaches.
Tourism Management, 20, 393-410.
Nae, W.K. and Yue, H. Y. 1999. An Evaluation System for National Park Selection in Taiwan. Joumal of Environmental Planning and
Management, 42(5), 735.
Piperoglou, J. 1967. Identification and Definition of Regions in Greek Tourist Planning, Papers, Regional Science Association, 169-176.
Smith, S.L.J. 1994. The Tourism Product. Annals of Tourism Research, 21(3), 582-595.
Valentine, P.S. 1993. Ecotourism and Nature Conservation: A Definition with Some Recent Developments in Micronesia. Journal of Travel Research,
Winter, 1993, 3-9.
Weaver, D. and Oppermann, M. 2000. Tourism Management. Australia: John Wiley & Sons Australia Ltd.
Wight, P. 1996. North American Ecotourism Markets: Motivations, Preferences and Destinations. Journal of Travel Research, 35(1), 3-10.