Application of Regression Tree Methodology in Predicting
the Body Weight of Uda Sheep
Abdulmojeed Yakubu
Nasarawa State University, Keffi, Department of Animal Science, Shabu-Lafia Campus, 950101- Lafia, Nigeria
Abstract
This study aimed at evaluating the relationship between body weight and nine morphometric traits (withers height, rump height, body length, face length, rump length, chest circumference, head width, shoulder width and rump width) of Uda sheep using regression tree technique. The data for the study were generated from 499 Uda rams randomly selected from different herds in Nasarawa State, north-central Nigeria. Pearson’s moment correlation (r) between body weight and morphometric traits ranged from moderate to high values (r = 0.43-0.76; P≤0.01). Based on the importance of the independent variables in predicting the body weight of sheep, five body measurements namely; chest circumference, shoulder width, rump width, body length and face length were found to be more efficient. Thus, they were the variables entered to obtain the optimal regression tree. Among these five variables, chest circumference was found to be the primary splitting variable; and together with face length accounted for about 62% of the variation in body weight. The regression tree analysis indicated that animals with chest circumference > 87.45cm or ≤ 94.05cm and face length > 28.85cm could be expected to have higher body weights. This information could be exploited by livestock producers for management, selection and genetic improvement of Uda sheep.
Keywords: body measurement, body weight, correlation, tree regression, Uda sheep
1. Introduction
Classification and regression trees can be used for interactive exploration and for description and prediction of patterns and processes. Advantages of trees include the flexibility to handle a broad range of response types, including numeric, categorical, ratings, and survival data; invariance to monotonic transformations of the explanatory variables; ease and robustness of construction, ease of interpretation and the ability to handle missing values in both response and explanatory variables [1]. The goal of regression tree analysis is to create groups or binary nodes that are internally more homogenous than the root node. Regression trees were introduced by [2].
The regression trees have a constant numerical value in leaves and use the variance as a measure of impurity. The reason for using variance as the
* Corresponding author: Abdulmojeed Yakubu,
Knowing the body weight of an animal is important for a number of reasons such as breeding, correct feeding and health matters as well as classification [5-7]. In the absence of scales, farmers rely on visual inaccurate estimates of their animals, and this in turn leads to inaccuracies in decision-making and husbandry [8]. In order to assist livestock farmers to overcome this challenge, the development of a simple, yet reasonably accurate method to predict live weight is needed. Application of regression tree methodology for both prediction and classification in many fields of science had been previously undertaken [9, 10]. However, there is dearth of information on the use of this classical statistical tool in small ruminants. Therefore, this study aimed at estimating the body weight of Nigerian Uda sheep using regression tree analysis. The results so obtained could aid in selection of breeding stock and could also be useful for management purposes.
2. Materials and methods
The experiment made use of a random sample of 499 Uda rams. The animals which were reared through the extensive management system originated from different herds sampled in Nasarawa state, north central Nigeria. They were not less than twenty two months of age as determined by dentition (presence of 4-8 permanent incisors).
Ten morphometric traits were measured on each animal. The body parameters were body weight (BW), withers height (WH), rump height (RH), body length (BL), face length (FL), rump length (RL), chest circumference (CC), head width (HW), shoulder width (SW) and rump width (RW). Anatomical reference points were as earlier described [11]. Body weight was taken using a spring balance. The height measurement (cm) was done using a graduated measuring stick. To achieve this, animals were placed on a flat ground and held by two field assistants. The length and circumference measurements (cm) were effected using a tape rule while the width measurements were taken using a calibrated wooden calliper. All measurements were carried out by the same person in order to avoid between-individual variations.
Descriptive statistics of the body weight and biometric traits of Uda rams were computed. Pearson’s moment correlation coefficients were calculated to determine the dependence between sheep body weight and body dimensions. In order to gain a comprehensive understanding of the influence of the different independent variables on body weight, their importance scores were determined. To calculate a variable importance score, emphasis is laid on the improvement measure attributable to each variable in its role as a surrogate to the primary split. The values of these improvements are summed over each node and summed, and are scaled relative to the best performing variable. The variable with the highest sum of improvements is scored 100, and all other variables will have lower scores ranging downwards towards zero [12].
The tree building process starts by partitioning a sample or the root node into binary nodes based upon a very simple question of the form: is X ≤ d? where X is a variable in the data set, and d is a real number. Initially, all observations are placed at the root node. This node is impure or heterogeneous. The goal is to devise a rule that will initially break up these observations and create groups
or binary nodes that are internally more homogenous than the root node [13]. In choosing the best splitter, the programme seeks to mazimize the average “purity” of the two child nodes. As the response variable in the present study (body weight) is a continuous variable, the Least Squared Deviation method was used as a measure of the homogeneity of nodes [14]. The tree building process continued until it became impossible. The maximum tree value was obtained after the tree reached a maximum dimension. 10-fold cross-validation was used as an error estimation method; this was to provide estimates of the future prediction error for each sub-tree [15]. The statistical package employed in the analysis was SPSS [16].
3. Results and discussion
Table 1. Descriptive statistics for body weight (kg) and body measurements (cm) of
Uda rams
Trait Mean±SE SD CV (%)
Body weight 48.85±0.32 7.18 14.70
Withers height 84.00±0.16 3.47 4.13
Rump height 82.80±0.15 3.34 4.03
Body length 76.80±0.21 4.73 6.16
Face length 26.86±0.08 1.88 7.00
Rump length 25.47±0.07 1.58 6.20
Chest circumference 92.08±0.20 4.57 4.96
Head width 13.86±0.10 2.33 16.81
Shoulder width 21.10±0.11 2.52 11.94
Rump width 18.56±0.11 2.43 13.09
SD: Standard deviation, SE: Standard error, CV: Coefficient of variation, Risk value: 19.681, Standard error: 1.503.
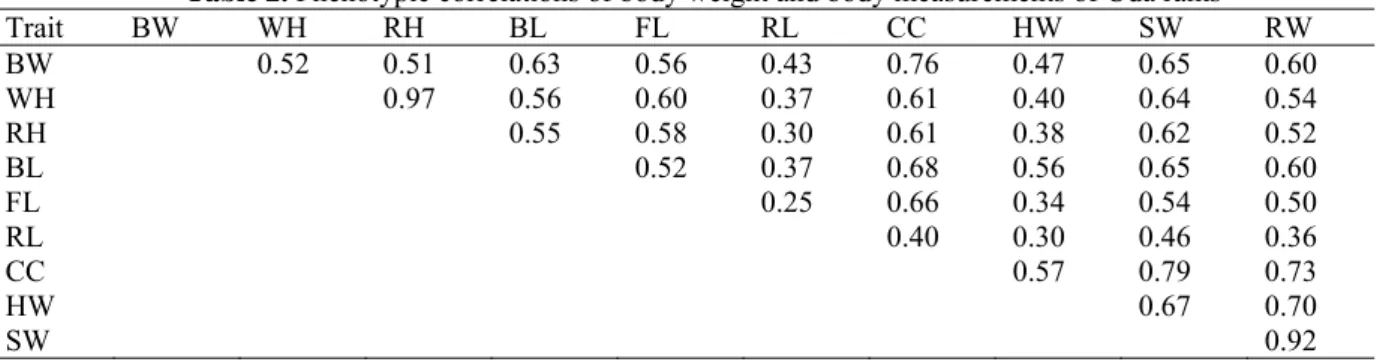
The phenotypic correlations between body weight and linear type traits (Table 2) ranged from moderate to high values (0.43-0.76; P≤0.01). However, the use of correlation
coefficients is not enough to show the relationship between body weight and linear body measurements.
Table 2. Phenotypic correlations of body weight and body measurements of Uda rams*
Trait BW WH RH BL FL RL CC HW SW RW
BW 0.52 0.51 0.63 0.56 0.43 0.76 0.47 0.65 0.60
WH 0.97 0.56 0.60 0.37 0.61 0.40 0.64 0.54
RH 0.55 0.58 0.30 0.61 0.38 0.62 0.52
BL 0.52 0.37 0.68 0.56 0.65 0.60
FL 0.25 0.66 0.34 0.54 0.50
RL 0.40 0.30 0.46 0.36
CC 0.57 0.79 0.73
HW 0.67 0.70
SW 0.92
*Significant at P≤0.01 for all correlation coefficients.
BW = body weight, WH = withers height, RH = rump height, BL = body length, FL = face length, RL = rump length, CC = chest circumference, HW = head width, SW = shoulder width and RW = rump width.
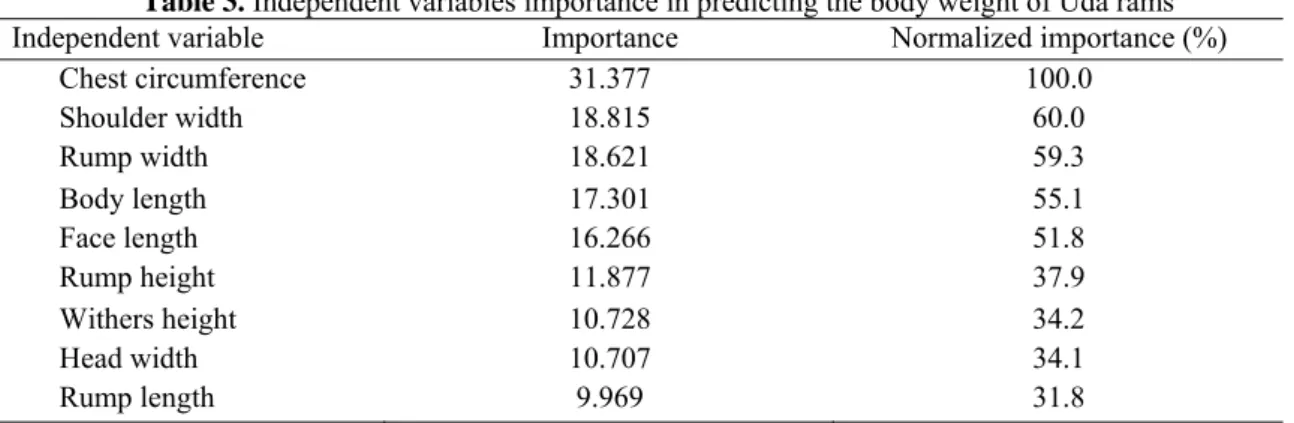
The importance of each independent (predictor) variable in predicting the body weight of sheep is presented in Table 3. Chest circumference was found as the most important variable (100%), chronologically followed by shoulder width (60.2%), rump width (59.3%), body length (55.1%), face length (51.8%), rump height (37.9%), withers height (34.2%), head width (34.1%) and rump length (31.8%). Among these variables, chest circumference, shoulder width, rump width, body length and face length were included in the regression model to predict body weight.
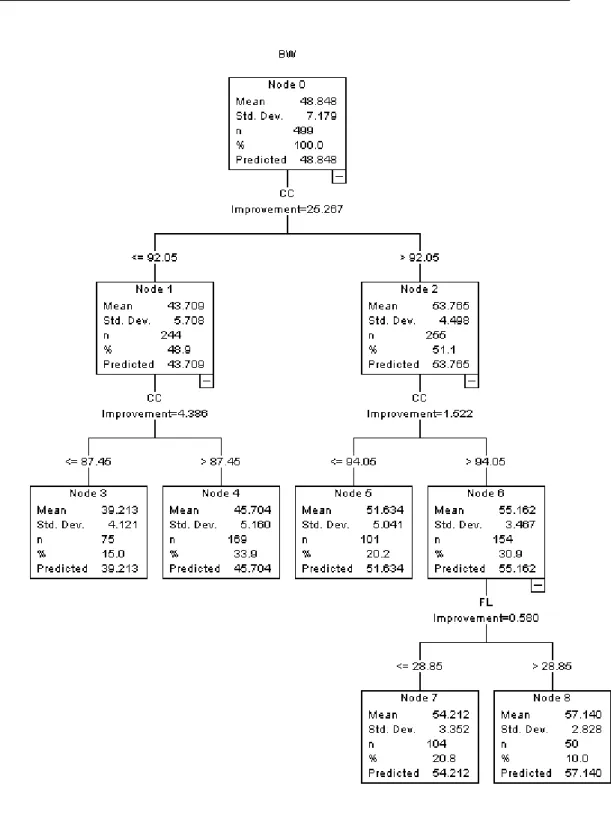
weight of animals in Node 2 was higher than that in Node 1, this information was not enough to base decision on, considering the fact that the two nodes were not homogenous enough. While Node 1, still on the basis of chest circumference, was subsequently broken into Node 3 (≤ 87.45cm) and Node 4 (>87.45cm) respectively, Node 2 on the other hand was divided into Node 5 (≤ 94.05cm) and Node 6 (> 94.05cm). Since Nodes 3 and 4 were not divided into subgroups, they could be said to be homogenous (terminal Nodes). However, Node 4 was better than Node 3 since the former made a higher prediction of body weight (45.704g) than the latter (39.213g). The proportions of rams in Nodes 3 and 4 were 15.0% and 33.9% respectively. Node 5 was a terminal
node, which prediction of body weight was equally high. However, Node 6 was sub-divided into Node 7 (≤ 28.85cm) and Node 8 (> 28.85cm) based on the values of face length. Node 8 appeared to offer better prediction of body weight (57.140g) with a lower variance [(2.828)2 = 7.998]
than the corresponding values of 54.212g and 11.236 recorded for Node 7. The variance of the root node or the dependent variable in the present study was: S2
y = (7.179)2 = 51.538. The
unexplained variation in the body weight was found to be: S2
e = risk value ٪ S2y = 19.681
٪51.538 = 0.382. The variation in the dependent variable (body weight) explained by the regression model was: S2
y = 1˗ S2e = 1- 0.382 = 0.618 =
61.8%.
Table 3. Independent variables importance in predicting the body weight of Uda rams
Independent variable Importance Normalized importance (%)
Chest circumference 31.377 100.0
Shoulder width 18.815 60.0
Rump width 18.621 59.3
Body length 17.301 55.1
Face length 16.266 51.8
Rump height 11.877 37.9
Withers height 10.728 34.2
Head width 10.707 34.1
Rump length 9.969 31.8
Preservation of local breeds is essential to maintain agricultural biodiversity and keep rare genes for future productive breeding purposes [17]. The present estimates for the morphometric characters of Uda rams are comparable to the range of values earlier reported for the same breed of sheep [11, 18, 19].
Positive relationship was observed between body weight and the body measurements investigated. Similar association had earlier been reported for native [20, 21] and exotic breeds of sheep [22]. Based on the structure of the optimal regression tree therefore, animals with chest circumference > 87.45cm or ≤ 94.05cm and face length > 28.85cm could be expected to have higher body weights. In a related study in broiler chickens, [23] successfully used regression tree methodology to predict the slaughter weight of broilers. Regression tree analysis has many advantages compared to traditional methods such as multiple regression, logistic regression, discriminant and cluster analyses. RTA is a non-parametric method;
Figure 1. Optimal regression tree structure.
The use of chest circumference as a good indicator of live body weight of animals had been reported by previous workers [21, 24-27]. Similarly, [28] reported that heart girth had the largest influence on body weight of Dorper rams; and was also the most important contributor to selection index. To maintain good animal husbandry, the measurement of live body weight is absolutely
measurements is of immense financial contribution to livestock production enterprises. This will be more useful in the rural settings to avoid errors associated with visual evaluation of animal weights, where weighing bridges are not accessible.
4. Conclusions
Predictions using a regression tree model can be made very efficiently.
The optimal regression tree indicated that the body weight of Uda rams could be predicted fairly accurate from chest circumference and face length.
The results obtained in this study may be used by livestock producers and researchers for selection and management purposes, since weight is the pivot on which animal production thrives.
References
1. Death, G., Fabricius, K. E., Classification and regression trees: A powerful yet simple technique for ecological data analysis, Ecology, 1999, 81, 3178-3192 2. Breiman, L., Friedman, J. H., Olshen, R. A., Stone, C. J., Classification and regression trees for bone marrow immunophenotyping, Cytometry, 1984, 20, 210-217
3. Dobra, A., Classification and regression tree cons-truction. Thesis proposal. Department of Computer Science, Cornell University, Ithaca NY, 2002, 18 pp. 4. Honeycutt, E., Gibson, G., Use of regression me- thods to identify motifs that modulate germline trans- cription in Drosophila melanogaster, Genetics Resear- ch, 2004, 83, 177-188
5. Slippers, S. C., Letty, B. A., De Villiers, J. F., Pred- icting the body weight of Nguni goats, South African Journal of Animal Science, 2000, 30 (Supplement 1), 127-128
6. Miclea, V., Zahan, M., Rau, V., Nagy A. L., Daraban S., Miclea I., Morphological and productive characteristics of two Tsigaie ecotypes, used as genetic stock, Scientific Papers: Animal Science and Biotechnologies, 2009, 42, 477-484
7. Gavojdian, D., Padeanu, I., Voia, S. and Bratu, I., Study regarding body weight of yearlings and mature indigenous sheep breeds reared in the western part of Romania, Scientific Papers: Animal Science and Biotechnologies, 2010, 43, 303-305
8. De Villers, J. F., Gcumisa, S. T., Gumede, S. A., Thusi, S. P., Dugmore, T. J., Cole, M., Du Toit, J. F., Vatta, A. F., Stevens, C., Estimation of live body
weight from the heart girth measurements in KwaZulu-Natal goats, Applied Animal Husbandry and Rural Development, 2009, 1, 1-8
9. Speybroeck, N., Berkvens, D., Mfoukou-Ntsakala, A., Aerts, M., Hens, N., Van Huylenbroeck, G. and Thys. E., Classification trees versus multinomial models in the analysis of urban farming systems in Central Africa, Agricultural Systems, 2004, 80, 133-149
10. Spurgeon S., Hsieh, Y, Rivadinera, A., Beer, T., Mori, M. , Garzotto, M., Classification and regressi- on tree analysis for the prediction of aggressive prostate cancer on biopsy, The Journal of Urology, 2009, 175, 918-922
11. Yakubu, A., Salako, A. E., Abdullah, A-R., Va- rimax rotated principal component analysis of the zoo- metrical traits of Uda sheep, Archivos de Zootecnia, 2009, 231, 813-816.
12. Banerjee, A. K., Arora, N., Murty, U. S. N., Classification and regression tree (CART) analysis for deriving variable importance of parameters influencing average flexibility of CaMK Kinase Family, Electronic Journal of Biology, 2008, 4, 27-33
13. Yohannes Y., Hoddinott J., Classification and regression trees: An introduction. A technical guide, International Food Research Institute, 2033 K Street, N.W., Washington, D.C., 20006, U.SA. 1999, pp.27 14. Bevilacqua, M., Braglia, M., Montanari, R., The classification and regression tree approach to pump rate analysis, Reliability Engineering and System Safety, 2003, 79, 59-67
15. Camdeviren, H., Mehmet, M., Ozkan, M. M., Toros, F., T. Sasmaz, T., Oner, S., Determination of depression risk factors in children and adolescents by regression tree methodology, Acta Medica Okayama, 2005, 59, 19-26
16. SPSS., Statistical Package for Social Sciences. SPSS Inc., 444 Michigan Avenue, Chicago, IL60611, 2010.
17. Hajas, P., Conservation of animal genetic resources in the Danubian valley. Scientific Papers: Animal Science and Biotechnologies, 2011, 44, 223-225
18. Yakubu, A., Akinyemi, M. O., An evaluation of sexual size dimorphism in Uda sheep using multifactorial discriminant analysis. Acta Agriculturae Scandinavica A., Animal Science, 2010, 60, 74-78 19. Yakubu A., Ibrahim I. A., Multivariate analysis of morphostructural characteristics in Nigerian indigenous sheep. Italian Journal of Animal Science, 2011, 10, 83-86
20. Yakubu, A., Abdullah, A. R., Ari, M. M., Ogah, D. M., Studies on live weight and linear body measurements of West African Dwarf sheep in North Central Nigeria, Production Agriculture and Technology, 2005, 1, 137– 145
measurements in Yankasa sheep. Czech Journal of Animal Science, 2006, 51, 343-348
22. Topal M., Yildiz, N. Esenbuga, N., Aksakal, V., Macit, M. and Ozdemir, M., Determination of best fitted regression model for estimation of body weight in Awassi sheep. Journal of Applied Animal Research, 2003, 23, 201-208
23. Mendes, M., Akkartal, E., Regression tree analysis for predicting slaughter weight in broilers, Italian Journal of Animal Science, 2009, 8, 615-624
24. Topal M., Macit M., Prediction of body weight from body measurements in Morkaraman sheep. Journal of Applied Animal Research, 2004, 25, 97-100 25. Kunene N. W., Nesamvuni, A. E. and Nsahlai, I. V., Determination of prediction equations for
estimating body weight of Zulu (Nguni) sheep. Small Ruminant Research, 2009, 84, 41-46
26. Yakubu, A., Path coefficient and path analysis of body weight and biometric traits in Yankasa lambs. Slovak Journal of Animal Science, 2010a, 43, 17-25 27. Yakubu, A., Fixing multicollinearity instability in the prediction of body weight from morphometric traits of White Fulani cows. Journal of Central European Agriculture, 2010b, 11, 487-492