BIROn - Birkbeck Institutional Research Online
Grawemeyer, Beate and Wollenschlaeger, Alex and Gutierrez, Sergio and
Holmes, W. and Mavrikis, M. and Poulovassilis, Alexandra (2017) Using
graph-based modelling to explore changes in students’ affective states during
exploratory learning tasks. In: 3rd International Workshop on Graph-based
Educational Data Mining (GEDM 2017), at EDM 2017, 25-28 Jun 2017,
Wuhan, China.
Downloaded from:
Usage Guidelines:
Please refer to usage guidelines at
or alternatively
Using Graph-based Modelling to explore changes in
students’ affective states during exploratory learning tasks
Beate Grawemeyer
Birkbeck Knowledge Lab Birkbeck, University of LondonLondon, UK
[email protected]
Alex Wollenschlaeger
Birkbeck Knowledge Lab Birkbeck, University of LondonLondon, UK
[email protected]
Sergio Gutierrez-Santos
Birkbeck Knowledge Lab Birkbeck, University of LondonLondon, UK
[email protected]
Wayne Holmes
Institute of Educational Technology The Open University
Milton Keynes, UK
[email protected]
Manolis Mavrikis
UCL Knowledge Lab UCL Institute of Education University College LondonLondon, UK
[email protected]
Alexandra Poulovassilis
Birkbeck Knowledge Lab Birkbeck, University of LondonLondon, UK
[email protected]
ABSTRACT
This paper describes how graph-based modelling can be used to explore interactions associated with a change in students’ affective state when they are working with an exploratory learning environment (ELE). We report on a user study with an ELE that is able to detect students’ affective states from their interactions and speech. The data collected during the user study was modelled, visualized and queried as a graph. We were interested in exploring if there was a difference between low- and high-performing students in the kinds of interactions that occurred during a change in their affective state. Our findings provide new insights into how students are interacting with the ELE and the effects of the system’s interventions on students’ affective states.
Keywords
Graph Modelling, Interaction Data, Exploratory Learning Environment, Affect
1.
INTRODUCTION
Much research recently has focussed onExploratory Learn-ing Environments(ELEs) which encourage students’ open-ended interaction with a knowledge domain, combined with intelligent components that aim to provide pedagogical sup-port to ensure students’ productive interaction [15]. Such components can provide different types of feedback to stu-dents, ranging from unsolicited prompts and nudges, to low-interruption feedback that students can choose to view if they wish. The aim of this feedback is to balance students’ freedom to explore alternative task solution approaches while at the same time providing sufficient support to ensure that the intended learning goals are being achieved [15].
The data gathered from students’ interactions with ELEs provides a rich source of information for understanding how students are using the ELE and how its intelligent support may be enhanced to support them better. The overarching aim of our research is to identify when students need support when working with ELEs and what kind of support should be provided by the system. In the present paper, our focus is on identifying key events that contribute towards a change in a student’saffective state.
It is well understood that affect interacts with and influences the learning process [19, 9, 1]. While positive affective states (such as surprise, satisfaction or curiosity) contribute to-wards learning, negative states (such as frustration or bore-dom) can undermine learning. Also, D’Mello et al. elaborate on how confusion, which superficially might be considered a negative affective state, is likely to promote learning un-der appropriate conditions [9]. It is therefore important to deepen our understanding of the role of affective states for learning, and to be able to move students out of states that inhibit learning. We focus on a subset of the affective states identified by Pekrun [21]: flow/enjoyment, surprise, frustra-tion, and boredom. We also add confusion, which has been identified elsewhere as an important affective state during learning [9, 23].
In this paper we are concerned with identifying interaction events that are associated with a change in students’ affec-tive state as they interact with an affect-aware ELE called
Fractions Labthat aims to develop their knowledge of frac-tions. Student-system interaction data from learning envi-ronments has an inherent temporal dimension, with succes-sive events being related through the “next event” relation-ship. It is therefore natural to model this data in graph form, with event occurrences being represented as nodes in the graph, and the “next event” connections between them as edges, and this is indeed the data modelling approach that we adopt in this paper.
ELE and its affect-aware intelligent support, to the level of detail needed for this paper. Section 4 describes a user study using Fractions Lab, the data collection, graph-based mod-elling, querying and analysis. Sections 5 and 6 present and discuss the results. Section 7 gives our concluding remarks and directions of further work.
2.
RELATED WORK
Only a limited amount of research has been undertaken to investigate how a student’s affect or motivation can be taken into account to provide learning material or motivational feedback. One early example is del Soldato & du Boulay [7] who use a student’s motivation to decide whether to pro-vide the next task or to propro-vide hints. Another example is Santos et al. [26] who show that affect as well as motiva-tion and self-efficacy impact the effectiveness of motivamotiva-tional feedback and recommendations. Additionally, Woolf et al. [31] developed an affective pedagogical agent which is able to mirror a student’s affective state, or acknowledge a student’s affective state if it is negative. Another example is Conati & MacLaren [5], who developed a pedagogical agent to provide support according to the affective state of the student and their personal goal. Also, Shen et al. [28] recommend learn-ing material to the student based on their affective state. D’Mello et al. [8] developed a system that is able to respond to students via a conversation that takes into account the affective state of the student. Grawemeyer et al. [13] use a student’s affective state to select the type and the presenta-tion of feedback within the Fracpresenta-tions Lab ELE with the aim of providing an enhanced learning experience. Grawemeyer et al. [14] report on findings that indicate that affect can be viewed as a proxy of how easy or difficult it is for students to carry out a particular reasoning step needed to perform a learning task; their results indicate that low-performing students have more difficulties in performing tasks when the tools provided to them do not fully match the reasoning step that is needed whereas high-performing students are more at ease with a range of different reasoning tools.
In this paper we add to the current literature by investi-gating key events that have an effect on students’ affec-tive state. We adopt a graph-based approach to modelling, querying and visualizing student-system interactions data arising from the use of ELEs, extending preliminary work in this area reported in [24]. Other work has also modelled learning-related data as graphs, e.g. [16] for providing sup-port to moderators in e-discussion environments; [22, 27] for supporting learning of argumentation; [3] for support-ing students’ “navigation” through learnsupport-ing objects; [6] for recognising students’ activity planning in ELEs; and [30] for gaining understanding of learners’ interactions in pro-fessional networks. Previous work closest to ours is that on interaction networks and hint generation [29, 10, 11], in which the graphs used consist of nodes representing states within a problem-solving space and edges representing stu-dents’ actions in transitioning between states. In these en-vironments, students are required to select and apply rules, and the interaction network aims to represent information relating to students’ problem-solving in moving from state to state. Our approach differs from this in that we use graphs to model fine-grained event-based interaction data arising from an ELE. In our graphs, nodes represent occurrences of key indicators that are detected, inferred or generated by the
ELE (i.e. nodes represent events, not problem states); and the edges between such nodes represent the “next event” rela-tionship. Also, we do not use the graph-modelled data to au-tomatically generate feedback for the student, but rather to investigate the effects of the system’s interventions in order to better understand how students interact with the ELE, with the aim of improving its support for students.
3.
THE FRACTIONS LAB ELE
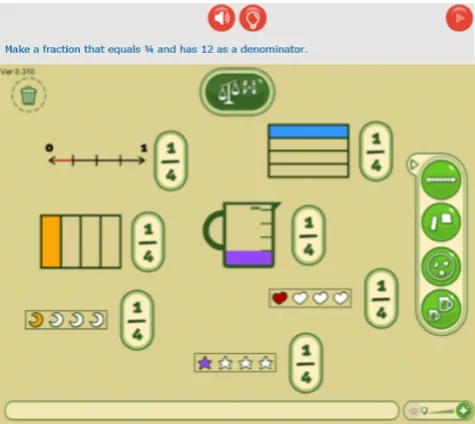
[image:3.595.318.556.193.405.2]Fractions Lab is an ELE that forms part of the iTalk2Learn learning platform targeted at children aged 8-12 years old who are learning about fractions. Figure 1 illustrates the
Figure 1: Exploratory learning environment - Frac-tions Lab.
Fractions Lab user interface. The learning task is displayed at the top of the screen. Students undertake the task by first choosing a fraction representation from the right-most ver-tical menu, which they then manipulate (in the work area at the centre of the interface) in order to construct their task solution. The different fraction representations are: a number line, rectangles, sets, and liquids. The large but-ton at the top of the work area provides access to a variety of tools (to compare, add and subtract fractions). As stu-dents are interacting with the learning environment they are asked to talk aloud about their reasoning process. This speech, together with their interactions with the ELE, are used to detect students’ affective states using a combination of Bayesian and rule-based reasoning [13]. The detection of the affective state is based on keywords and prosodic fea-tures that were identified through Wizard-of-Oz studies [18, 20], where students’ speech was recorded and used to deter-mine keywords and speech pause histograms that can pro-vide insights into the student’s affective state. Additionally, students’ interaction data is used to add evidence to the de-tected affective state, such as whether students viewed and followed the most recent feedback.
positive affective state as it indicates that the student is en-gaging with the learning task well. Confusion is mostly asso-ciated with realising misconceptions, which also contributes towards learning, while frustration and boredom are likely to have a negative effect on learning.
[image:4.595.53.295.384.583.2]Adaptive support is provided based on the student’s de-tected affective state and performance. Table 1 (from [13]) shows the different types of feedback provided by the sys-tem. The system’s adaptive support selects the feedback type and the feedback message based on a Bayesian network that aims to improve the student’s affective state (where — as discussed in Section 1 — flow and surprise are viewed as positive affective states, confusion as a neutral state, and boredom and frustration as negative states). A sec-ond Bayesian network determines whether the feedback mes-sage is presented to the student in low-interruption or high-interruption mode: low high-interruption is through the light-bulb at the top of the screen being lit up, and the student may or may not elect to click on the light-bulb to view the feedback message; high interruption is through a pop-up window that shows the message. The automatic affect de-tection shows good performance for detecting being in flow (precision: 86.2%, recall: 84.2%), but lower performance for the other affective states: confusion (precision: 67.9%, re-call: 86.8%), frustration (precision: 28.6%, rere-call: 80.0%), boredom (precision: 80.0%, recall: 10.8%). We refer readers to [13] for full details.
Table 1: Feedback Types and Examples
Feedback Type Example AFFECT
BOOSTS
Well done. You’re working really hard!
AFFIRMATION prompts
The way that you worked that out was excellent. Now go to the next task.
NEXT STEP
feedback
Use the comparison box to compare your fractions.
OTHER PROB-LEM SOLVING feedback
What do you need to do now, to complete the fraction?
REFLECTIVE prompts
What do you notice about the two fractions?
TALK ALOUD prompts
Please explain what you are doing.
TASK
SE-QUENCE prompts
Are you sure that you have answered the task fully? Please read the task again.
4.
USER STUDY
We conducted a user study in which iTalk2learn was used by students in a classroom setting, over several sessions, for the purpose of gathering student-system interaction data.
4.1
Participants
41 students took part in the study, all primary school stu-dents aged between 8 and 10 years old, recruited from two schools in the UK (one in the north of England, one in the south). These students were part of a larger evaluation of
iTalk2Learn that also included other conditions, which are not relevant for the research reported in this paper. For more information of these please see [25]. Parental consent for their involvement in the study was obtained for all stu-dents.
4.2
Procedure
At the start of each session, students were given a short in-troduction to iTalk2Learn and Fractions Lab. Students then completed an online questionnaire that assessed their knowl-edge of fractions (the pre-test). This was followed by 40 min-utes during which the students engaged with iTalk2learn, including the Fractions Lab ELE with the affect-aware sup-port. After the 40 minutes, the students completed a second online questionnaire that again assessed their knowledge of fractions (a post-test similar to the pre-test).
4.3
Data collection and modelling
In addition to the pre- and post-test questionnaire, the learn-ing platform logged every student-system interaction, such as fractions being created or changed by students, buttons clicked within Fractions Lab, feedback being provided by the system, feedback being viewed by students, and the system’s detection of students’ affective states. All these events were saved in the iTalk2Learn database, along with a timestamp.
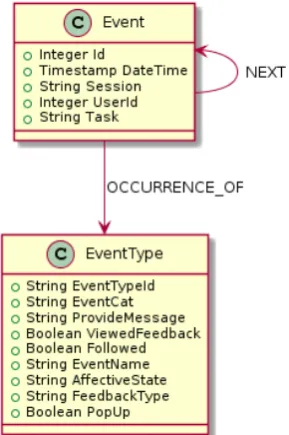
This data was then remodelled into a graph form, according to the graph data model shown in Figure 2. We see that the data model comprises two node types: Event nodes and EventType nodes. Event nodes capture occurrences of key
Figure 2: Graph data model for student-system in-teraction data.
interactions and have properties including:
• Id: a unique identifier for each event
[image:4.595.363.508.394.612.2]• Session: identifier for each session
• UserId: identifier for each student
• Task: identifier for each task
EventType nodes provide additional metadata about each event. The type of event determines which of the metadata fields are populated. The fields include:
• EventTypeId: a unique identifier for each event type
• EventCat: the category into which an event type falls: one of{system, intervention, fraction, affect}
• ProvideMessage: a feedback message available for the user to view.
• ViewedFeedback: indicates whether or not the previ-ous feedback was viewed.
• Followed: indicates whether or not the previous feed-back was followed.
• EventName: a description of the event type
• AffectiveState: the detected affective state of the user: one of{flow, surprise, confusion, frustration, boredom} • FeedbackType: the feedback type, as listed in Table 1.
• PopUp: if feedback was presented within a high inter-ruptive pop-up window or in a low-interinter-ruptive mode.
The data model includes two edge types: NEXT and OC-CURRENCE OF. Edges labelled NEXT link together suc-cessive Event nodes, allowing us to build up a sequence of consecutive events that describe the full history of student-system interactions as a student works on a task during a session. The OCCURRENCE OF relationship links each Event node to an EventType node.
In order to construct this graph representation, the data logged by iTalk2Learn was exported as text, which was then parsed and pre-processed using Python and the Pandas and py2neo libraries, and subsequently loaded into Neo4j Com-munity Edition graph database. To visualize the result-ing data graph we developed a custom visualization tool in JavaScript using the Node.js library. This tool was built on top of the linkurious.js library [17], which provides a cus-tomizable rendering engine for displaying graph data in a browser, and supports multiple graph layout algorithms.
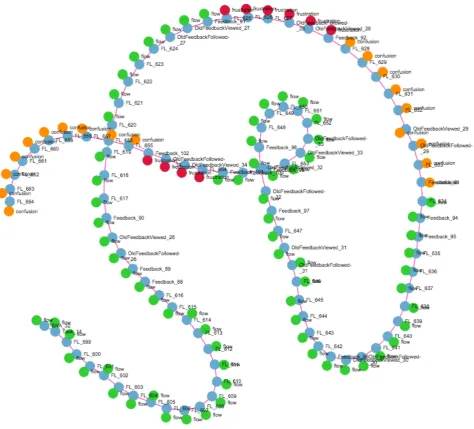
An example sequence of events visualized using our tool is shown in Figure 3. Nodes are placed using the Fruchterman-Rheingold algorithm [12] provided by the linkurious.js li-brary. Fruchterman-Rheingold is a force-directed algorithm which uses principles from physics for laying out the nodes of the graph. In our tool, the algorithm is used purely for aesthetic reasons. That said, without an effective layout algorithm, it would not be possible to make sense of the vi-sualization as the nodes would be positioned randomly and may lie on top of one another, obscuring the ability to see sequences of Event nodes. In addition to allowing the view-ing of large-scale changes in affective state, our visualization
tool also allows ‘zooming into’ a section of the graph. An example of this is shown in Figure 4, where we see part of an event sequence for a student working on a task. Combined with mouse-over tool-tips, the tool allows researchers to in-teractively explore the student-system interactions data.
4.4
Data analysis
Having viewed and interacted with visualizations such as these, we were interested to explore further the kinds of events that contribute towards changes in students’ affec-tive state as they work with Fractions Lab. To do this, we used Neo4j’s graph query language, Cypher, to extract the metadata relating to pairs of consecutive events that exhibit a change in a student’s affective state.
The Cypher query used is as follows:
MATCH (start_event: Event)-[:OCCURRENCE_OF]->(start_type: EventType), (end_event: Event)-[:OCCURRENCE_OF]->(end_type: EventType), p = (start_event)-[:NEXT]->(end_event)
WHERE start_type.affective_state in
["flow", "boredom", "confusion", "frustration"] AND end_type.affective_state in
["flow", "boredom", "confusion", "frustration"]
AND NOT start_type.affective_state = end_type.affective_state RETURN *
This query searches the graph for adjacent Event nodes con-nected by a NEXT relationship, and the EventType nodes they are connected to via OCCURRENCE OF relationships, such that the affective states associated with the EventType nodes are not equal. By adjusting the sets of affective states, the query can be modified to include specific transitions as needed. Note that we do not include ‘surprise’ in the sets of ‘from’ and ‘to’ affective states (nor in our analysis below) because it is currently not reliably detected by iTalk2Learn’s affect-detection algorithms.
5.
RESULTS
As part of our data analysis, we were interested to explore differences in students’ affective states and interactions com-pared with their post-test score performance. Students’ performance, based on the post-test score, was on average 3.83 (SD=1.46; min=0; max=6). A median split of stu-dents’ post-test scores resulted in a higher- and a lower-performing group (high: 27 students; low: 14 students). In the low-performing group, students increased their knowl-edge of fractions between the pre- and post-test from M=1.43 (SD=1.09) to M=2.50 (SD=1.02). In the high-performing group, students increased their knowledge between the pre-and post-test from M=3.04 (SD=1.63) to M=4.52 (SD=1.16). Students’ performance in the pre-test was significantly dif-ferent between the high- and low-performing students t(39)= -3.320 p=.000). There was also a significant difference in the post-test between the low- and high-performing students (t(39)=-5.51, p=.002).
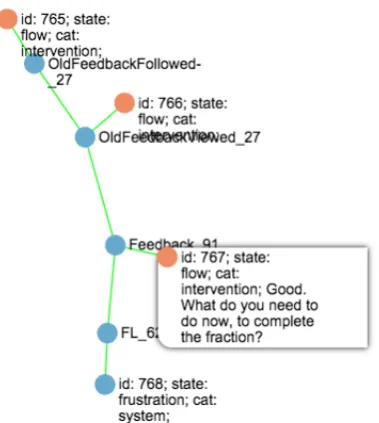
Figure 4: Zoomed-in view of an event sequence, showing Event nodes (blue, forming the “backbone”) and EventType nodes (orange, branching off ) in more detail. The NEXT and OCCURRENCE OF relationships are shown in green. The figure also shows tool-tips that provide information on the metadata associated with nodes.
5.1
Association Rule Learning
The data included in the association rule learning included four variables relating to the pairs of consecutive events ex-hibiting an affect change. Variable 1 was the affective state (AffectiveState) associated with the first event. Variable 2 was the type of feedback (FeedbackType, see Table 1) provided by the system in the first event; if the first event was not a system intervention then this variable was blank. Variable 3 was the affective state associated with the second event. Variable 4 was the description of the second event (EventName); if the second event was not associated with a user interaction then this variable was blank.
In our association rule mining, only rules that included the affective state of the first event on the left-hand side (LHS) of the rule and the affective state of the second event on the right-hand side (RHS) of the rule were considered. Figure 5 and Figure 6 show the top 5 rules inferred for each stu-dent group (ranked by ‘lift’). The ‘support’ indicates the frequency of the item-set appearing in the data (a number in the range 0-1). The ‘confidence’ indicates how often the rule has been found true i.e. the proportion of occurences of the LHS of the rule that also contain the RHS (a number in the range 0-1). The ‘lift’ indicates the performance of the rule at predicting the case (a number above 1) — the higher the lift, the higher the predictive performance of the rule.
The top two rules for low-performing students show that ac-knowledging receipt of feedback (by pressing the ‘Done’ but-ton in the pop-up window providing a high-interruption mes-sage) and receiving reflective prompts when being inflowis likely to result infrustration. This might imply that the
cog-Figure 5: Top 5 rules for low-performing group.
nitive demands on low-performing students on receiving this feedback were too high for them, possibly due to a lack of knowledge about fractions. The third rule shows that when students were in flow and changed the numerator of their fraction they were likely to move into frustration. Again this might imply that cognitive demands were too high for them to understand how the fraction representation changed based on their interaction with the numerator. The fourth rule shows that viewing high-interruption feedback (and in particular closing the pop-up window that contains the feed-back) can lead from being inflowto being inconfusion. This might be due to the feedback message causing students to realise a misconception. The fifth rule shows that providing the Task Not Finished message can lead from being inflow
toconfusion, possibly because students might not have been aware that they had not finished the task.
Figure 6: Top 5 rules for high-performing group.
The first two rules for high-performing students indicate that open-ended problem solving support is likely to move them from flow to frustration, in particular when subse-quently changing the denominator of their fraction. This might imply that the cognitive load was too high to reason about the learning task upon receiving support for open-ended problem solving. The third rule highlights that a change of the denominator when being in flow can move students to frustration. Similarly to rule 3 for the low-peforming students, this might imply that cognitive demands were too high for students to understand how the fraction representation changed based on their interaction with the denominator. The fourth rule indicates that when students press on a glowing light-bulb (and hence receive the low-interruption feedback) they may move from flow to confu-sion, possibly because they have become aware of a miscon-ception. The fifth rule shows that affect boosts can move students from frustration into the more positive affective state of confusion; this might imply that encouraging stu-dents to continue with their learning task can reduce cogni-tive load.
6.
DISCUSSION
[image:7.595.90.280.61.273.2]affective state (flow) to a negative one (frustration) via the provision of certain forms of feedback and via their interac-tion with either the numerator or the denominator of their current fraction. In the low-performing group, receiving re-flective prompts and working on the numerator were the main contributors to this affect change, while in the high-performing group it was support for open-ended problem solving and working on the denominator of their fraction. It is interesting to see that both reflective prompts and open-ended problem solving support encourage students to think about their reasoning steps, either what they have done so far (reflective prompts) or what they need to do in order to solve the task (open-ended problem solving support).
Students in the low-performing group may move fromflow
to confusionwhen viewing high-interruption feedback and when seeing the Task Not Finished message. Students in the high-performing group may move fromflowtoconfusion
when viewing low-interruption feedback. (We note that, by the design of Fractions Lab’s affect-aware support — see dis-cussion in [13] — low-performing students are more likely to receive high-interruption feedback, and high-performing students low-interruption feedback.) In both cases, students may be being prompted to reflect on their solution approach which may in turn be leading them to realise a misconcep-tion.
Finally, the analysis shows that the system’s affect boosts are able to move high-performing students fromfrustration
into the more positive affective state ofconfusion. A similar, but lower-ranked, rule was found to move low-performing students fromconfusionintoflow(with support 0.017, con-fidence 1.0 and lift 2.179).
7.
CONCLUSION
This paper has investigated key events that occur when students’ affective state changes as they interact with an exploratory learning environment called Factions Lab, tar-geted at learning about fractions. Modelling the student-system interactions data that was collected by the learning environment during a classroom-based User Study in a graph form allowed us to visualize and interact with this data, and ultimately to formulate queries for extracting the necessary data to perform our analyses. Specifically, association rule mining was used to identify events that are associated with a change in students’ affective state.
Students were divided into a low- and a high-performing group. We found that students are likely to move from
flow to frustration when provided with reflective prompts in the low-performing group and open-ended problem solv-ing support in the high-performsolv-ing group. This might imply that these types of support are imposing too high a cogni-tive demand on students and require modification. Addi-tionally, interaction with the numerator or denominator of their fraction is likely to move low or high performing stu-dents, respectively, fromflow tofrustration. Viewing high-interruption or low-high-interruption feedback may move low or high performing students, respectively, fromflow to confu-sion. Finally, our analysis points to the positive effect of Affect Boosts, for both categories of student.
These findings extend earlier findings reported in [13] with a
finer-grained analysis of students’ affective state changes as they interact with Fractions Lab. The study in [13] found that students are mostly in positive affective states when working with Fractions Lab, and that affect-aware support is more likely to reduce students’ boredom compared to non-affect aware support. Here, we have identified specific student-system interactions that may lead students from be-ing in flow to bebe-ing in confusion or frustration, thereby iden-tifying areas where further work may be needed in the design of Fraction Lab’s affect-aware support. We have also reaf-firmed the design goal of the system’s provision of Affect Boosts.
Situations where the system’s affect-aware feedback may need to be modified include: (i) Reviewing the content of both the high- and the low-interruption messages, to see if the incidences of confusion can be reduced. (ii) Con-sidering extending the provision of reflective prompts and open-ended support with additional affect boost messages and low-interruption hints that students might also select to view, in order to mitigate against frustration. (iii) Consider-ing providConsider-ing more scaffolds when students are manipulat-ing their fractions, for example additional low-interruption feedback.
These insights into the relationship between feedback, af-fect, the interactions with the ELE, and performance would not have been easy to make without the approach described here. Exploratory learning environments such as Fractions Lab can generate very large volumes of student-system inter-actions data, making their interpretation a challenging task for researchers. We have seen here how modelling such data as a graph can open up new data visualization, querying and analysis opportunities, leading to new insights into how students are interacting with the ELE and the effects of the system’s interventions, with the ultimate goal of designing improved support for students.
Future work includes further scrutiny of the graph-modelled data derived from this and follow-on User Studies with Frac-tions Lab, identification of additional research quesFrac-tions re-lating to the effectiveness of the system’s affect-aware sup-port, and development of additional queries, analyses and vi-sualizations to tackle these research questions. Particularly of interest is to look more closely at thesequenceof interac-tion events leading up to changes in students’ affective states (as opposed to just individual events). We are also interested to explore how our visualizations can help to identify pat-terns of interactions that are associated with misconceptions and with learning. Also important is the development of a fully-functional GUI through which researchers, designers or even teachers with little computing expertise can explore the data from their different perspectives.
8.
REFERENCES
[1] R. S. J. d. Baker, S. K. D’Mello, M. T. Rodrigo, and A. C. Graesser. Better to be frustrated than bored: The incidence, persistence, and impact of learners’ cognitive-affective states during interactions with three different computer-based learning environments.
Int. J. Hum.-Comput. Stud., 68, 2010.
assessments of association rule interestingness. In
Proceedings of EDM, 2014.
[3] N. Belacel, G. Durand, and F. LaPlante. A binary integer programming model for global optimization of learning path discovery.G-EDM, 2014.
[4] D. Ben-Naim, M. Bain, and N. Marcus. A user-driven and data-driven approach for supporting teachers in reflection and adaptation of adaptive tutorials. In
Proceedings of EDM, 2009.
[5] C. Conati and H. MacLaren. Empirically building and evaluating a probabilistic model of user affect.User Modeling and User-Adapted Interaction, 2009. [6] R. Dekel and K. Gal. On-line plan recognition in
exploratory learning environments.G-EDM, 2014. [7] T. del Soldato and B. du Boulay. Implementation of
motivational tactics in tutoring systems.Journal of Artificial Intelligence in Education, 6(4), 1996. [8] S. D’Mello and A. Graesser. Autotutor and affective
autotutor: Learning by talking with cognitively and emotionally intelligent computers that talk back.
ACM TiiS, 2013.
[9] S. K. D’Mello, B. Lehman, R. Pekrun, and A. C. Graesser. Confusion can be beneficial for learning.
Learning & Instruction, 29(1):153–170, 2014. [10] M. Eagle and T. Barnes. Exploring differences in
problem solving with data-driven approach maps.
EDM, 2014.
[11] M. Eagle, D. Hicks, B. Peddycord III, and T. Barnes. Exploring networks of problem-solving interactions.
LAK, pages 21–30, 2015.
[12] E. Fruchterman, T.M.J.and Reingold. Graph drawing by force-directed placement.Software: Practice and Experience.
[13] B. Grawemeyer, M. Mavrikis, W. Holmes,
S. Guti´errez-Santos, M. Wiedmann, and N. Rummel. Affective learning: Improving engagement and enhancing learning with affect-aware feedback.User Modeling and User-Adapted Interaction - Special Issue on Impact of Learner Modeling, 2017.
[14] B. Grawemeyer, M. Mavrikis, C. Mazziotti, A. Hansen, A. van Leeuwen, and N. Rummel. Exploring students’ affective states during learning with external representations. In18th International Conference on Artificial Intelligence in Education (AIED 2017), 2017.
[15] S. Gutierrez-Santos, M. Mavrikis, and G. D. Magoulas. A Separation of Concerns for Engineering Intelligent Support for Exploratory Learning Environments.J. Research and Practice in Inf. Tech., 44:347–360, 2013. [16] A. Harrer, R. Hever, and S. Ziebarth. Empowering
researchers to detect interaction patterns in
e-collaboration.Frontiers in Artificial Intelligence and Applications, 158:503, 2007.
[17] S. Heymann.
https://github.com/linkurious/linkurious.js. [18] R. Janning, C. Schatten, and L. Schmidt-Thieme.
Perceived task-difficulty recognition from log-file information for the use in adaptive intelligent tutoring systems.International Journal of Artificial
Intelligence in Education, pages 855–876, 2016. [19] B. Kort, R. Reilly, and R. Picard. An affective model
of the interplay between emotions and learning. In
IEEE International Conference on Advanced Learning Technologies, number 43-46, 2001.
[20] M. Mavrikis, B. Grawemeyer, A. Hansen, , and S. Guti´errez-Santos. Exploring the potential of speech recognition to support problem solving and reflection -wizards go to school in the elementary maths
classroom. InEC-TEL 2014, pages 263–276, 2014. [21] R. Pekrun. The control-value theory of achievement
emotions: Assumptions, corollaries, and implications for educational research and practice.J. Edu. Psych. Rev., pages 315–341, 2006.
[22] N. Pinkwart and et al. Graph grammars: An ITS technology for diagram representations.FLAIRS, pages 433–438, 2008.
[23] K. Porayska-Pomsta, M. Mavrikis, and H. Pain. Diagnosing and acting on student affect: the tutor’s perspective.User Modeling and User-Adapted Interaction, 18(1):125–173, 2008.
[24] A. Poulovassilis, S. Gutierrez-Santos, and M. Mavrikis. Graph-based modelling of students’ interaction data from exploratory learning environments. In
Proceedings of G-EDM, at EDM, 2015.
[25] N. Rummel, M. Mavrikis, M. Wiedmann, K. Loibl, C. Mazziotti, W. Holmes, and H. A. Combining exploratory learning with structured practice to foster conceptual and procedural fractions knowledge. In
Proceedings of ISLS, 2016.
[26] O. Santos, M. Saneiro, S. Salmeron-Majadas, and B. J.G. A methodological approach to elicit affective educational recommendataions. InIEEE ICALT, 2014. [27] O. Scheuer and B. McLaren. CASE: A configurable
argumentation support engine.IEEE Trans. Learn. Tech., 6(2):144–157, 2013.
[28] L. Shen, M. Wang, and R. Shen. Affective e-learning: Using “emotional” data to improve learning in pervasive learning environment.Educational Technology & Society, 12(2):176–189, 2009. [29] V. Sheshadri, C. Lynch, and T. Barnes. InVis: An
EDM tool for graphical rendering and analysis of student interaction data.G-EDM, 2014.
[30] D. Suthers. From contingencies to network-level phenomena: Multilevel analysis of activity and actors in heterogeneous networked learning environments.
LAK, 2015.