ATTENUATION OF NEURAL RESPONSE DURING SUBSTANCE-FREE ACTIVITY AND MONETARY REWARD PROCESSING IN INDIVIDUALS WITH OPIATE USE DISORDER
AND MODERATE DEPRESSIVE SYMPTOMS
Jennifer Youngshin Yi
A dissertation submitted to the faculty at the University of North Carolina at Chapel Hill in partial fulfillment of the requirements for the degree of Doctor of Philosophy in the Department
of Psychology and Neuroscience.
Chapel Hill 2020
Approved by: Stacey B. Daughters Gabriel S. Dichter Kathleen M. Gates
Regina M. Carelli Margaret A. Sheridan
© 2020
ABSTRACT
Jennifer Youngshin Yi: Attenuation of Neural Response during Substance-Free Activity and Monetary Reward Processing in Individuals with Opiate Use Disorder and Moderate Depressive
Symptoms
(Under the direction of Stacey B. Daughters)
Co-occurring opiate use disorder and depressive symptoms is prevalent and especially concerning given its association with more severe substance use characteristics and poorer outcomes compared to opiate use disorder in the absence of depressive symptoms. Theories and findings propose dysfunctional reward processing, namely reduced reward responsivity in populations with individuals with substance use disorder and depression; however,
inconsistencies across studies prompt the consideration of alternative conceptualizations of reward dysregulation, such as attenuation of reward responsivity across time. Thus, the current study tested attenuation of neural response in a priori regions-of-interest and task-based functional connectivity between reward-related and prefrontal cortical regions during
ACKNOWLEDGEMENTS
I would like to express my sincere gratitude to my advisor - Dr. Stacey Daughters, the Biobehavioral Research on Addiction and Emotion (BRANE) Laboratory, my dissertation committee - Dr. Stacey Daughters, Dr. Gabriel Dichter, Dr. Regina Carelli, Dr. Kathleen Gates, Dr. Margaret Sheridan, and Dr. Andrea Hussong, and my family and friends, all of whom have provided endless mentorship, support, and encouragement. I would also like to thank the
TABLE OF CONTENTS
LIST OF TABLES ... viii
LIST OF FIGURES ... ix
LIST OF ABBREVIATIONS ...x
INTRODUCTION ...1
Opioid Use Disorder and Co-Occurring Depressive Symptoms ...1
Reward Processing as a Shared Mechanism Contributing to Substance Use Disorders and Depressive Symptoms ...2
Neural Mechanisms of Reward Processing in Substance Use Disorders and Depressive Symptoms ...5
Sustained Neural Response during Reward Processing...10
Current Study ...14
METHODS ...16
Participants ...16
Procedure ...17
Reward Tasks ...17
Measures ...18
Behavioral Data Acquisition and Analysis ...22
Imaging Data Acquisition and Analysis ...22
Identification of Covariates...24
RESULTS ...30
Sample Characteristics ...30
Task Performance during Substance-Free Activity and Monetary Reward ...30
Attenuated Neural Response during Anticipation and Receipt of Substance-Free Activity and Monetary Reward ...31
Global Functional Connectivity during Anticipation and Receipt of Substance-Free Activity and Monetary Reward ...32
Attenuated Functional Connectivity during Anticipation and Receipt of Substance-Free Activity and Monetary Reward ...33
Attenuation of Functional Connectivity as Predictor of Anhedonia, Behavioral Activation, Environmental Reward, and Substance Use ...34
DISCUSSION ...36
Limitations and Future Directions ...43
APPENDIX 1: SUPPLEMENTARY TEXT ...61
APPENDIX 2: SUPPLEMENTARY TABLES ...64
APPENDIX 3: SUPPLEMENTARY FIGURES ...71
LIST OF TABLES
Table 1 - Sample characteristics ...45 Table 2 - Clinical correlates and mechanisms ...46 Table 3 - Repeated measures MANOVAs on response time for the AID
and MID tasks ...47 Table 4 - Group x Run MANOVAs on parameter estimates for a priori
ROIs during anticipation and receipt of substance-free activity
reward (AID) and monetary reward (MID) ...48 Table 5 - Group differences in global connectivity of rACC functional
connectivity during anticipation and receipt of substance-free
activity reward (AID) ...49 Table 6 - Group differences in global connectivity of rACC functional
connectivity during anticipation and receipt of monetary reward
(MID) ...50 Table 7 - Group differences in attenuation of rACC functional
connectivity during anticipation and receipt of substance-free
activity reward (AID) ...51 Table 8 - Group differences in attenuation of rACC functional connectivity
during anticipation and receipt of monetary reward (MID) ...52 Table 9 - Hierarchical linear regression models predicting anhedonia,
behavioral activation, environmental reward, and substance use at
the 1-month follow-up ...53 Table 10 - Hierarchical linear regression models predicting anhedonia,
behavioral activation, environmental reward, and substance use at
LIST OF FIGURES
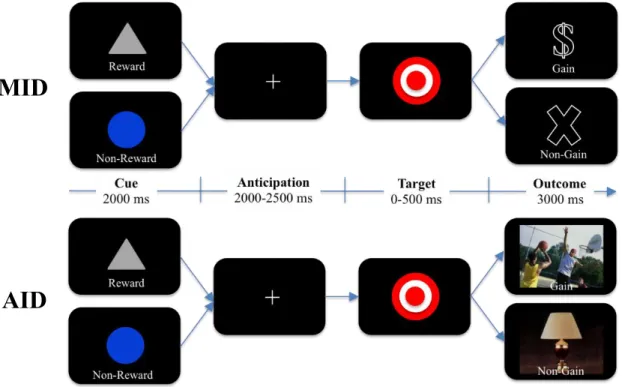
Figure 1 - Trial structure of the MID and AID tasks ...55 Figure 2 - PPI results for global connectivity with the rACC during anticipation
and receipt substance-free activity image reward (AID task) ...56 Figure 3 - PPI results for global connectivity with the rACC during anticipation
and receipt of monetary reward (MID task ...57 Figure 4 - PPI results for attenuation of connectivity (Run 1>Run 2) with the
rACC during anticipation and receipt of substance-free activity image
reward (AID task) ...58 Figure 5 - PPI results for attenuation of connectivity (Run 1>Run 2) with the
rACC during anticipation and receipt of monetary reward (MID task)...59 Figure 6 - Partial regression plot for connectivity attenuation between the rACC
and lMFG during receipt of substance-free activity image reward (AID task) and number of days used of any substance during the 30 days before the 1-month follow-up, after controlling for number of days used of any
LIST OF ABBREVIATIONS
AID Activity Incentive Delay
BADS Behavioral Activation for Depression Scale BDI Beck Depression Inventory-II
Cau Caudate
CI Confidence interval HC Healthy controls Ins Insular cortex
lACC Left anterior cingulate cortex lMFG Left middle frontal gyrus MID Monetary Incentive Delay NAcc Nucleus accumbens OFC Orbitofrontal cortex
OUDD Opiate use disorder with moderate depressive symptoms PPI Psychophysiological interaction
Put Putamen
rACC Right anterior cingulate cortex RPI Reward Probability Index SD Standard deviation
INTRODUCTION
Opioid Use Disorder and Co-Occurring Depressive Symptoms
The co-occurrence of substance use disorders and depression has been well established as studies estimate the prevalence of this co-occurrence to range from 8.5% to 21.4% and the lifetime prevalence of this co-occurrence to range from 27% to 40% in the general population (see Davis et al., 2008 for review). In the midst of the ongoing opioid epidemic (Skolnick, 2018), it is especially important to examine this co-occurrence within the context of opiate use disorder. Unsurprisingly, the prevalence of depression among individuals who use opioids is concerning with one study estimating 27% of individuals who use non-medical prescription opioids to have a diagnosis of depression and 57% of these individuals endorsing depressive symptoms
(Goldner, Lusted, Roerecke, Rehm, & Fischer, 2014). Furthermore, patients with opioid use disorder and co-occurring depressive symptoms evidence more severe substance use
characteristics and poorer outcomes including earlier age of onset of illicit opioid use, greater number of lifetime substance use diagnoses, greater risk for relapse, continued use during and after substance use treatment, poorer psychosocial adjustment, and poorer current functioning (i.e., employment, family, and psychological problems) compared to patients without
co-occurring depressive symptoms (Brewer, Catalan, Haggerty, Gainey, & Fleming, 1998; Hasin et al., 2002; Rounsaville, Kosten, Weissman, & Kleber, 1986). Furthermore, in a sample of
treatment-seeking substance users, depressive symptoms significantly predicted post-treatment substance use frequency only among individuals with opioid dependence compared to
prevalence and considerable impact of co-occurring opiate use disorder and depressive
symptoms on clinical severity, efforts to investigate the contributing mechanisms are warranted to better understand the etiology and maintenance of this co-occurrence and ideally inform the targets for intervention.
Reward Processing as a Shared Mechanism Contributing to Substance Use Disorders and Depressive Symptoms
One of the most prominent explanations emerging from clinical and epidemiologic research for the co-occurrence of substance use disorders and depressive symptoms is the shared etiologic factor of neurobiological alterations in reward processing and related marked
dysfunction in reward-seeking behaviors (Brady & Sinha, 2005; Rao, 2006). Drawing upon the principle of operant conditioning, reward processing serves the vital function of enabling individuals to make predictions about future events and adapt their behaviors accordingly to maximize reward and minimize punishment (Balodis & Potenza, 2015; Lutz & Widmer, 2014). In other words, rewards serve as positively reinforcing stimuli that have the potential to increase the probability of a specific behavior. Rewards can be dichotomously categorized as either primary or secondary. Primary rewards (e.g., food, sex, water) reinforce behavior without having to be learned, while secondary rewards (e.g., money) reinforce behavior after an association is learned between engaging in the behavior of interest and the increased likelihood of receiving or experiencing reward (McClure, York, & Montague, 2004). Although such learned associations allow for adaptive goal-oriented behaviors and efficient allocation of cognitive resources, habitual responding can become maladaptive and overly rigid when associated behaviors are no longer desirable (McKim, Bauer, & Boettiger, 2016).
disorders (Baler & Volkow, 2006). The development and maintenance of substance use disorders can be conceptualized as a series of transitions from voluntary and casual drug-seeking and – taking behaviors to compulsive drug use (Everitt & Robbins, 2005). This transition involves neurobiological alterations in reward circuitry, contributing to overlearned reward-seeking behaviors towards drugs. More specifically, initial substance use is described as largely voluntary and goal-oriented, motivated by the hedonic and reinforcing effects of drugs.
However, repeated substance use results in habit-based learning processes during which internal and external stimuli become more strongly associated with drug-seeking and –taking behaviors at the expense of other behaviors related to previously rewarding and positive-affect eliciting substance-free activities. Through this process, attribution of primary motivational salience shifts to drug-related stimuli and these drug-related behavioral patterns are integrated through
associative memory consolidation particularly of self-administration of substances (Goldstein & Volkow, 2002; Hyman, Malenka, & Nestler, 2006; Wise & Koob, 2014). These associations and behavioral patterns become what have been described as overlearned and automatic in the presence of learned cues (Hyman, 2005), procuring continued substance use, even in the face of a myriad of negative consequences (e.g., financial, social, legal; Volkow & Li, 2004).
Accordingly, individuals who engage in chronic substance use demonstrate decreased motivation for previously rewarding and natural, substance-free behaviors, as evidenced by decreased responsivity and impaired capacity to experience pleasure (i.e., anhedonia) to natural, substance-free, and positive affect-eliciting stimuli (for a review, see Garfield, Lubman, & Yucel, 2004).
behaviors and cognitions, which are thought to predispose individuals to depression (Ferster, 1973; Lewinsohn, 1974). Later behavioral models of depression have expanded on this
Neural Mechanisms of Reward Processing in Substance Use Disorders and Depressive Symptoms
Studies utilizing functional neuroimaging provide additional empirical evidence for the shared etiologic factor of disrupted reward processing between substance use disorder and depression. Functional neuroimaging allows for the examination of distinct components of maladaptive behavioral processes, as well as its interaction with psychological conditions of interest (Disner, Beevers, Haigh, & Beck, 2011; Sanislow, Pine, Quinn, Kozak, & Garvey, 2010). Of particular importance, reward-based functional neuroimaging tasks, such as the
commonly utilized Monetary Incentive Delay (MID) task, allow for the critical decomposition of the neural response during related, yet temporally distinct phases of reward processing, namely, reward anticipation and receipt.
Reward anticipation. Motivational theories of behavior posit that individuals may differentially recruit and engage neural regions in response to reward and non-reward cues (Grusser et al., 2004; Sinha & Li, 2007). Reward anticipation, the component of reward
In line with self-reported reductions in reward responsivity, individuals with substance use disorders and/or depression demonstrate differential patterns of neural response relative to healthy controls during reward anticipation. In a review of studies examining neural response during monetary reward anticipation among substance use populations, studies reporedt reduced activation in reward regions including the left VS, ACC, caudate, putamen, and right superior frontal gyrus (SFG) among substance use populations relative to healthy controls (for a review, see Balodis & Potenza, 2015). Moreover, activation in these reward-related regions during monetary reward anticipation was positively associated with various substance use disorder characteristics, including impulsivity and craving (Beck et al., 2009; Wrase et al., 2007).
Although there is some consistency across these studies in patterns of neural responsivity during reward anticipation, not all studies report differences in neural responsitivity between individuals who use substances and healthy controls in reward-related regions. For instance, studies comparing differences among alcohol detoxification patients and patients with substance dependence with healthy controls did not demonstrate activation differences in the VS during monetary reward anticipation (Bjork, Smith, Chen, & Hommer, 2012; Bjork, Smith, & Hommer, 2008). Additionally, two studies did not report any significant differences in activation of
reward-related regions-of-interest between treatment-seeking individuals with cocaine
dependence and healthy controls and among individuals who currently used cocaine, individuals who formerly used cocaine, and healthy controls, respectively, during monetary reward
anticipation (Jia et al., 2011; Patel et al., 2013). Additionally, a recent study did not report any significant differences in neural activation between opiate use disorder patients in detoxification and healthy controls during monetary reward anticipation (Yi et al., 2019)
Reward receipt. Reward receipt is a distinct phase of reward processing traditionally known as the consummatory phase (Craig, 1918; Sherrington, 1907). During this phase, individuals are presented with reward or non-reward feedback, allowing for the examination of recruitment and engagement of neural regions as a function of the motivational salience of the outcome (Knutson, Fong, Bennett, Adams, & Hommer, 2003). Reward receipt consistently activates the VS, ventromedial prefrontal cortex (vmPFC), medial orbital frontal cortex (OFC), and amygdala, suggesting engagement in processes involved in emotional arousal and
introspection when reward feedback is provided (Knutson et al., 2003).
Potenza, 2015), a number of studies report differential patterns of neural response during reward receipt among individuals with substance use disorders and/or depression relative to healthy controls. Patients with a substance dependence diagnosis demonstrated increased activation in the right NAcc, left anterior insula, and the mesofrontal cortex relative to healthy controls during reward receipt (Bjork, Smith, & Hommer, 2008). Individuals with cocaine dependence also demonstrated greater activation in the bilateral VS and right insula relative to healthy controls (Jia et al., 2011). Furthermore, among individuals with cocaine dependence, lower activation in the VS and culmen during reward receipt was associated with a longer length of cocaine
abstinence and a higher percentage of cocaine-negative urine toxicology results during the course of substance use treatment. Additionally, individuals who use cannabis regularly demonstrated reduced activation in the bilateral NAcc and bilateral caudate and increased activation in regions including the bilateral precuneus, bilateral putamen, and right caudate relative to healthy controls (Van Hell et al., 2010). A recent study also reports increased activation of the precuneus during reward receipt among individuals with opiate use disorder and co-occurring elevated depressive symptoms relative to healthy controls (Yi et al., 2019). Zhang and colleagues’ (2013) meta-analysis reported reduced activation in the caudate during reward receipt in depressed individuals relative to healthy controls. As with reward anticipation, it is also important to consider the nature of reward processing with non-monetary stimuli during reward receipt. In one study using pleasant images, depressed individuals demonstrated reduced activation in reward-related
responsivity to monetary stimuli to pleasant images during reward receipt relative to healthy controls.
Similar to studies that examined neural response to reward anticipation, not all studies that examined reward receipt reported differences between individuals who use substances and healthy controls. Abstinent males with cocaine dependence and healthy controls did not
demonstrate any significant activation differences in reward regions-of-interest (Bustamente et al., 2013). Similarly, Patel and colleagues (2013) did not report any significant activation differences in reward regions-of-interest among individuals who currently used cocaine, individuals who formerly used cocaine, and healthy controls.
heterogeneity in sample characteristics across studies, inconsistent findings prompt the
consideration of other conceptualizations and measurement approaches surrounding the nature of reward processing among individuals with substance use disorders and/or depression.
Sustained Neural Response during Reward Processing
A different, yet arguably more nuanced conceptualization of disrupted reward processing in individuals with substance use disorders and/or depressed individuals draws from theories of anhedonia, the loss of interest or responsivity to rewarding or pleasurable stimuli (American Psychiatric Association, 2013). More specifically, it has been suggested that anhedonia may reflect responsivity to reward over time or reduced capacity to sustain positive affect rather than a more simple tonic reduction in the propensity to respond to positive affect and reward-related cues (Myerson, 1922). Expanding upon this conceptualization, Tomarkenand and Keener (1998) propose that reduced capacity to sustain positive affect and responsivity to reward over time may result from dysregulation of positive emotion. Supporting evidence can be drawn from studies with rodents and healthy controls that implicate critical signaling from the prefrontal cortex to the nucleus accumbens, during the regulation of positive affect (Kim & Hamann, 2007; Wager, Davidson, Hughes, Lindquist, & Ochsner, 2008).
Accordingly, neurobiological theories of depression propose dysfunction in circuitry between the prefrontal cortex and reward-related regions (Nestler, Barrot, DiLeone, Eisch, Gold, & Monteggia, 2002; Nestler & Carlezon, 2006), leading to difficulties engaging in and
modulate behavior as a function of reinforcement provided in previous trials of the probabilistic monetary task. Specifically, depressed individuals evidenced a lower rate of correct
identification of cues associated with maximal reward relative to healthy controls. Moreover, higher rates of incorrect identifications were associated with the presence of anhedonic symptoms. Liu and colleagues (2011) reported similar findings as depressed individuals
demonstrated difficulty sustaining behavior to maximize reward under both non-stress and stress conditions, which was in turn was associated with lower levels of self-reported pleasure during a probabilistic reward task. In comparison, healthy controls only demonstrate a trend towards a decreased response bias to stimuli signaling maximal reward under the stress condition.
due to differences in task engagement as depressed individuals and healthy controls did not demonstrate differences in attention or motivation throughout the emotion regulation task. Two more recent studies linked these characterizations of anhedonia and deficits in sustained reward response among depressed individuals by testing their ability to predict treatment responsivity. In one study, greater sustained activation in ACC during reward receipt predicted greater reductions in depressive symptoms following behavioral activation (BA) therapy for depression (Carl et al., 2016). In another study, depressed individuals demonstrated attenuated functional connectivity between a left caudate seed and clusters in the ACC and paracingulate gyrus, as well as
attenuated connectivity between orbitofrontal seeds and clusters in the left and right caudate and left putamen during reward anticipation. Furthermore, greater connectivity between the left putamen and paracingulate gyrus during reward anticipation predicted greater reductions in depressive symptoms following BA therapy for depression among depressed individuals (Walsh et al., 2017).
Although preliminary support for reduced capacity to sustain reward responsivity and positive affect and its relation to clinical characteristics drawn from depressed individuals is promising, this proposed deficit has not yet been examined in individuals with substance use disorders. Additionally, the vast majority of studies testing neural response and circuitry
involved in reward anticipation and receipt have utilized monetary reward cues, such as with the Monetary Incentive Delay (MID) task (e.g., for a review, see Balodis & Potenza, 2015).
support, studies have demonstrated the association between engagement in rewarding substance-free activities and improved rates of post-treatment abstinence for individuals with substance use disorders (Daughters et al., 2008; Daughters, Magidson, Anand, Seitz-Brown, Chen, & Baker, 2018; Jacobson et al., 1996). Thus, testing reward responsivity to natural, substance-free activity engagement may be more relevant than existing approaches using monetary reward cues in understanding reward-related deficits contributing to the etiology and maintenance of substance use disorders.
possibilities, such as attenuation of neural response to substance-free activity images over time and potential differences in the capacity to sustain reward response and positive affect between opiate use disorder patients with depressive symptoms and healthy controls. Thus, examining the capacity to sustain neural response to substance-free reward cues, as well as monetary reward cues, presents a logical next step to further elucidate the nature of dysfunctional reward processing in individuals with opiate use disorder and co-occurring moderate depressive symptoms.
Current Study
The current study proposes to test attenuation of neural response during reward anticipation and receipt of (1) substance-free activity images using the AID task and (2) monetary images using the MID task among individuals with opiate use disorder and co-occurring moderate depressive symptoms (OUDD) relative to gender- and education-matched healthy controls (HC) through three aims.
Aim 1. To test attenuation of neural response in reward-related regions. The OUDD group was hypothesized to demonstrate greater attenuation of neural response in reward-related regions relative to HC during the AID and MID tasks.
Aim 2. To test functional connectivity and attenuation of functional connectivity between reward-related and prefrontal cortical regions. The OUDD group was hypothesized to
demonstrate reduced functional connectivity and greater attenuation of functional connectivity between reward-related and prefrontal cortical regions relative to HC during the AID and MID tasks.
METHODS
Participants
Participants were 16 individuals with opiate use disorder and co-occurring moderate depressive symptoms (OUDD; Mage=32.19±8.17 years) recruited from an inpatient detoxification
unit in Raleigh, NC and 17 gender- and education-matched healthy controls (HC; Mage=26.82±5.29 years) recruited from the community via the Internet (i.e., Craigslist,
ResearchMatch, Join the Conquest), fliers, and UNC’s Biomedical Research Imaging Center’s (BRIC) healthy control pool. Inclusion criteria for all participants were 21 to 50 years of age. Inclusion criteria for OUDD participants were current opiate use disorder (OUD), according to the Diagnostic and Statistical Manual of Mental Disorders, 5th Edition (DSM-5; American
Procedure
OUDD participants were screened on the inpatient detoxification unit, while HC engaged in an initial phone screen, followed by an onsite screen at UNC. At the baseline assessment, participants provided written informed consent approved by the UNC Institutional Review Board (IRB). Participants completed a scan assessment at the BRIC, which involved self-report
measures, out-of-scanner task trainings, MRI safety screening, and functional magnetic
resonance imaging (fMRI) with task stimuli displayed with E-Prime 2.0 (Psychology Software Tools, Incorporated, Pittsburgh, PA), followed by an image rating task. At the one- and three-month follow-up assessments, participants completed self-report measures. At the end of each assessment, participants were compensated with a gift card.
Reward Tasks
At the baseline assessment, participants completed a structural scan, followed by a functional scan with two reward tasks presented in counterbalanced order. Both reward tasks were individually titrated such that participants were successful on approximately 66% of trials, regardless of individual response times. Before the scan, participants completed out-of-scanner task trainings during which they were required to achieve greater than or equal to 66% accuracy in order to proceed to the scan portion of the assessment. Response time to the target bullseye on reward and non-reward trials will be measured for each reward task.
(4) a 3000 ms feedback screen indicating whether the response resulted in a win, depicted by an image of a basket with money (win) or a red “X” (non-win), and (5) a variable intertrial interval (ITI) so the total trial duration is 12 seconds (Figure 1). Participants had the potential to win $1 per trial and the running total amount won was displayed during the receipt phase of each trial (M=26.62±1.44 dollars).
Activity Incentive Delay (AID) Task. The Activity Incentive Delay (AID; Yi et al., 2019) task is a modified version of the Monetary Incentive Delay (MID) task (Knutson et al., 2000) with identical trial structure (Figure 1). However, on the 3000 ms feedback screen, participants were presented with either a substance-free activity image (win) or a neutral image (non-win). Details of the development of this modified task are described elsewhere (Yi et al., 2019).
Assessment of task performance. Task performance for the MID and AID tasks was measured with response time to the target bullseye to reflect task engagement and motivation (Balodis & Potenza, 2015).
Measures
Screening measures.
Demographics. At the baseline assessment, participants completed the self-report Demographics Form, which included questions about basic demographic information such as age, ethnicity/race, and years of education.
reading level of fifth grade or higher (score>40) in order to read and comprehend written portions of the study.
DSM-IV Axis I disorders. The Mini International Neuropsychiatric Interview (MINI) 7.0 for the DSM-5 (Sheehan, 2014) is a structured interview administered during the screening procedure to assess for the presence of current posttraumatic stress disorder (PTSD; Module J) and/or psychotic disorders (Module K), which were exclusion criteria for all participants.
Magnetic resonance imaging (MRI) safety. BRIC’s MRI screening form includes
questions about MRI contraindications (e.g., pacemaker, cochlear implants, pregnancy, claustrophobia). It was administered during the screening procedure and again with a MRI technician before the participant entered the scanner to determine eligibility and ensure that all participants would be able to safely undergo the scan.
Depressive symptoms. The Beck Depression Inventory-II (BDI-II; Beck, Steer, & Brown, 1996) is a 21-item self-report questionnaire administered during the screening procedure to assess depressive symptoms. Each item is rated on a 0-to-3 Likert scale. Depressive symptoms were measured by total scores ranging from 0 to 63, with greater scores indicating greater severity of depressive symptoms. The BDI-II for the total sample in the current study demonstrated high internal consistency at the baseline assessment (α=0.95).
Outcome measures.
Behavioral activation. The Behavioral Activation for Depression Scale (BADS; Kanter et al., 2007) is a 25-item self-report questionnaire administered to all participants at the baseline, one-month, and three-month follow-ups to assess level of behavioral activation over the past week on a 7-point Likert scale ranging from 0 (not at all) to 6 (completely). The BADS is
aversive states and rumination, Social Impairment, five items assessing social consequences of inactivity, passivity, and isolation, School/Work Impairment, five items assessing school- and work-related consequences of inactivity and passivity, and Activation, seven items assessing focused, goal-directed activation and completion of scheduled activities; however, the total score was used in the current study with higher scores reflecting greater levels of behavioral activation. The BADS for the total sample in the current study demonstrated high internal consistency (α=0.96 at the baseline assessment, α=0.95 at the one-month follow-up, and α=0.94 at the three-month follow-up).
Environmental reward. The Reward Probability Index (RPI; Carvalho et al., 2011) is a 20-item self-report questionnaire administered to all participants at the baseline, one-month, and three-month follow-ups to assess availability of environmental reward. The RPI has two
subscales: Reward Probability Index, 11 items assessing potential to obtain reinforcement through instrumental behaviors and Environmental Suppressors Index, 9 items assessing
availability of potential environmental reinforcers and aversive stimuli; however, the total score was used in the current study, with higher scores reflecting greater self-reported availability of environmental reward. Items are rated on a 4-point Likert scale ranging from 1 (not at all) to 4 (extremely). The RPI for the total sample in the current study demonstrated high internal
consistency (α=0.90 at the baseline assessment, α=0.92 at the one-month follow-up, and α=0.88 at the three-month follow-up).
Substance use. The Timeline Followback (TLFB; Sobell & Sobell, 1992) is a widely used tool to obtain self-reported estimates of frequency of substance use across drug classes over a targeted time interval using a calendar method and other recall-enhancing techniques
participants at the baseline, one-month, and three-month follow-up assessments to assess for frequency of substance use, defined as the number of days individuals used one or more substances during the 30 days prior to the assessment.
Anhedonia. Anhedonia symptoms will be measured by the sum of BDI-II (Beck, Steer, & Brown, 1996) items #4 (loss of pleasure), #12 (loss of interest), and #21 (loss of interest in sex), with higher scores indicating greater severity of anhedonia symptoms (Joiner et al., 2003; Pizzagalli et al., 2005). Anhedonia for the total sample in the current study demonstrated high internal consistency at the baseline assessment (α=0.80) and one-month follow-up (α=0.79), but poor internal consistency at the three-month follow-up (α=0.49).
Covariates.
Demographics. At the baseline assessment, participants reported their age, ethnicity/race, and years of education.
Motivation for substance use treatment. The Circumstances, Motivation, and Readiness Scales (CMRS) for Substance Abuse Treatment (De Leon et al., 1994) is an 18-item self-report questionnaire administered to OUDD participants at the baseline assessment to assess an individual’s perceptions of one’s motivation and readiness for substance use treatment. The Motivation subscale, consisting of 5 items rated on a 5-point Likert scale ranging from 1 (strongly disagree) to 5 (strongly agree), was used as it assesses for positive and negative inner reasons for personal change. Higher scores indicate greater motivation for substance use treatment. Motivation for the total sample in the current study demonstrated high internal consistency at the baseline assessment (α=0.89).
Image ratings. In order to assess how rewarding participants found the presented substance-free activity images during the AID task, arousal and valence of 40 substance-free activity images using the Self-Assessment Manikin (SAM) scale (Bradley & Lang, 1994) on 5-point Likert scales ranging from 1 (more positive/aroused) to 5 (less positive/aroused).
Likelihood of engaging in the depicted substance-free activity was rated on a 10-point Likert scale ranging from 1 (not at all likely) to 10 (extremely likely). Twenty (50%) of the images were substance-free activity engagement images that were not included in the AID task to reduce the potential impact of familiarity on image ratings.
Behavioral Data Acquisition and Analysis
Acquisition. Behavioral data for the Activity Incentive Delay (AID) and Monetary Incentive Delay (MID) tasks were collected using E-Prime Version 2.0 (Schneider, Eschman, & Zuccolotto, 2002).
Analysis. Response time was extracted and meaned by Group (OUDD, HC), Trial Type (Reward, Non-Reward), and Run (Run 1, Run 2) for the AID and MID tasks in E-Prime 2.0 Data Aid, and entered into SPSS Version 23 (IBM Corp, 2015). Response time was analyzed with Group (OUDD vs. HC) x Trial Type (Reward vs. Non-Reward) x Run (Run 1 vs. Run 2) repeated measures MANOVAs with Group as a between-subjects factor and Reward Type and Run as within-subjects factors for each task. Significant interactions were probed with repeated measures ANOVAs.
Imaging Data Acquisition and Analysis
sagittal slices using a single-shot gradient-echo-planar imaging (EPI) sequence (voxel
size=1x1x1 mm, repetition time (TR)=2200 ms, echo time (TE)=2.78 ms, FA=7 degrees, and field of view (FOV)=220x220 mm) for normalization and co-registration with functional data. Whole-brain functional images were acquired with 70 transverse slices using a single shot, T2*-weighted gradient-echo, echo planar imaging (EPI) sequence (voxel size=1.5x1.5x1.5 mm, TR=2000 ms, TE=22 ms, FOV=220x220 mm, flip angle (FA)=80 degrees).
Detection Tool, were censored (Siegel et al., 2014) by entering these time points as confound regressors within first-level, participant-specific analyses.
Identification of Covariates Aim 1.
Region-of-interest analyses. Age was tested as a potential covariate for inclusion in region-of-interest (ROI) analyses testing group differences in attenuation of neural response. Pearson’s (r) correlations were conducted between age and mean parameter estimates for each ROI for each task phase. If significant correlations (p<0.05) were found, age was included as a covariate in the repeated-measures MANCOVA models for the specific ROI.
Supplementary analyses. Given the documented impact of age on neural activation during reward processing (e.g., Eppinger et al., 2013; Vink et al., 2015), age was tested as a potential covariate for inclusion in whole-brain analyses testing group differences in attenuation of neural response. A whole-brain general linear model (GLM) was conducted to test attenuation of neural response across the total sample with age, demeaned across the total sample, as the sole regressor for each task phase (whole-brain method is discussed later in more detail). If
significant activation clusters were yielded on whole-brain activation maps thresholded at z>2.3 with a corrected cluster significance of p<0.05, age was included as a covariate in the third level of the whole-brain GLM analyses for the specific task phase.
Aim 2. Age was tested as a potential covariate for inclusion in functional connectivity analyses testing group differences in global connectivity and attenuation of functional
connectivity between reward-related and prefrontal cortical regions. Generalized
total sample, as the sole regressor for each task phase (gPPI method is discussed later in more detail). If significant activation clusters were yielded on PPI maps thresholded at z>2.3 with a corrected cluster significance of p<0.05, age was included as a covariate in the third level of the gPPI analyses.
Aim 3. Motivation for substance use treatment was tested as a potential covariate for inclusion in hierarchical regression analyses testing whether attenuation of neural response predicted reward-related clinical correlates (i.e., anhedonia, substance use) and mechanisms (i.e., behavioral activation, environmental reward) at the one- and three-month follow-ups. If
significant correlations (p<0.05) were found, motivation for substance use treatment was included as a covariate in the regression model(s) specifically predicting the clinical correlate and/or mechanism of interest.
Aim Analyses
Aim 1. In order to test attenuation of neural response in reward-related regions in the OUDD participants relative to HC, a region-of-interest (ROI) approach was utilized. A priori
regions-of-interest (ROIs) were selected based on their theory- and empirically-based
cingulate cortex (ACC), all of which were lateralized and defined using anatomical masks from the Harvard Oxford cortical and subcortical probabilistic atlases in FSLView, Version 3.2.0. For each task phase and ROI, participant- and run-specific mean parameter estimates were extracted using FSL’s featquery tool with Reward>Non-Reward as the contrast of interest for anticipation task phases and Win>Non-Win as the contrast of interest for receipt task phases. Mean parameter estimates were analyzed with a 2 (Group: OUDD, HC) x 2 (Run: Run 1, Run 2) repeated
measures mixed analyses of variance (MANOVAs) or analyses of covariance (MANCOVAs) for each ROI to examine potential Group x Run interactions and main effects of Group and Run, if interactions were non-significant using a significance level of p<0.05.
OUDD>HC and OUDD<HC. Within- (OUDD, HC) and between-group (OUDD vs. HC) whole-brain activation maps were generated and Z (Gaussianized T/F) statistic images were thresholded at z>2.3 with a corrected cluster significance of p<0.05. Localizations of significant activation clusters were determined using the Harvard-Oxford cortical and subcortical structural atlases, set at 10% and overlaid on the MNI standard-space T1-weighted structural template image in
FSLView.
Aim 2. Building upon findings from Aim 1, Aim 2 was conducted to further test group differences in attenuation of neural response to reward, but more specifically focusing on functional connectivity to measure temporally-based correlations between reward-related and prefrontal cortical regions. Task-based functional connectivity was tested using a generalized psychophysiological interaction (gPPI) approach (Cisler et al., 2014). The seed ROI was identified if there was observed attenuation of neural response in the OUDD group, HC group, and/or between-group comparisons. For each participant, mean fMRI timecourses (physiological regressors) were extracted from the seed regions for each task run using FSL’s fslmeants
command-line utility and multiplied by the psychological regressors of interest, consisting of Reward or Non-Reward for the anticipation task phases and Win or Non-Win for the receipt task phases, to form the PPI interaction terms. The contrasts of interest tested the difference in
functional connectivity during Reward vs. Non-Reward trials (Reward>Non-Reward) for anticipation task phases and Win vs. Non-Win trials (Win>Non-Win) for receipt task phases.
connectivity attenuation, defined as changes in seed-based connectivity from Run 1 to Run 2 or more specifically, reductions in seed-based connectivity from Run 1 to Run 2, for each task phase. Within- and between-group whole-brain activation maps for each task phase were
generated with Bayesian estimation techniques using FMRIB’s Local Analysis of Mixed Effects (FLAME; Woolrich, Behrens, Beckmann, Jenkinson, & Smith, 2004). Resulting images were thresholded at z>2.3 and a corrected cluster significance of p<0.05. Significant clusters generated by the PPI were localized using the Harvard-Oxford cortical and subcortical structural atlases, set at 10% and overlaid on the MNI standard-space T1-weighted structural template image in
FSLView, Version 3.2.0.
Aim 3. Extending findings from Aims 1 and 2, hierarchical linear regression models tested whether significant attenuation of functional connectivity predicted anhedonia, behavioral activation, environmental reward, and substance use at one- and three-month follow-ups among OUDD participants. In step 1, baseline values of the clinical or mechanism measure and
covariates (if applicable) were entered. In step 2, parameter estimates from the clusters that reflected significant group differences in attenuation of functional connectivity from Run 1 to Run 2 in the AID and/or MID tasks from Aim 2 were entered. A separate model was run for each clinical or mechanism measure, cluster, and timepoint.
Analytic Design Considerations
A psychophysiological interaction (PPI) approach was utilized as it allows for the examination of how neural regions interact with psychological factors elicited by the
experimental context (Friston et al., 1997; Cisler, Bush, & Steele, 2014). For the current study, it allowed for the potential to uncover changes in patterns of information processing among
reward. More specifically, a generalized PPI (gPPI) approach was utilized to analyze changes in task-based functional connectivity given its ability to more accurately estimate
RESULTS
Sample Characteristics
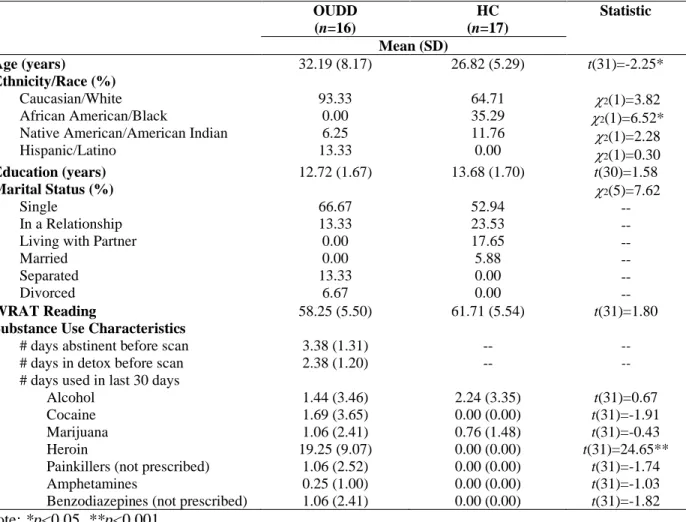
Sample characteristics are reported in Table 1 and measures of clinical correlates and mechanisms are reported in Table 2. OUDD participants were significantly older and were less likely to be African American/Black. There were no significant group differences in frequency of Caucasian/White, Native American/American Indian, or Hispanic/Latino participants. The majority of both OUDD participants and HC were single, followed by in a relationship, and living with a partner. Additionally, there were no significant group differences in the number of years of education and WRAT reading score.
On average, OUDD participants were abstinent for 3.38 days (SD=1.31 days) days before undergoing the fMRI scan and had been on the inpatient detoxification for a 2.38 days (SD=1.20 days). OUDD participants predominantly used heroin in the 30 days before the scan, but also reported use of alcohol, cocaine, marijuana, painkillers (not prescribed, amphetamines, and benzodiazepines (not prescribed). HC reported low use of alcohol and marijuana in the 30 days before the scan. OUDD participants reported significantly higher levels of depressive symptoms and anhedonia, as well as lower levels of behavioral activation and environmental reward than HC.
Task Performance during Substance-Free Activity and Monetary Reward
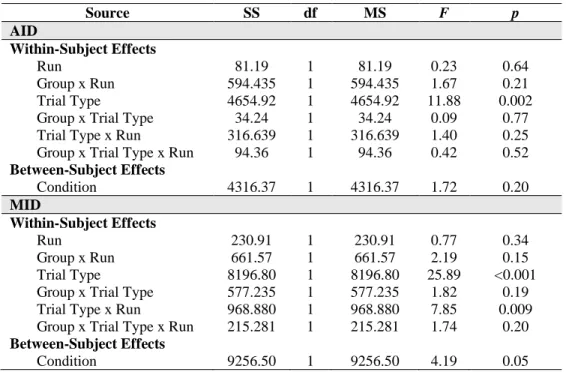
Substance-free activity reward. The repeated measures MANOVA on response time did
response times for reward trials relative to non-reward trials across both groups. The main effects of Run and Condition on response time were not significant.
Monetary reward. The repeated measures MANOVA on response time did not reveal a significant Group x Trial Type x Run interaction (Table 3). The interaction effect of Trial Type x Run was significant with post-hoc tests revealing significantly slower response times during Run 1 (M=198.42, SD=22.56) relative to Run 2 (M=190.36, SD=20.77) during reward trials, F(1,32)=11.58, p<0.01, but no significant difference in response times between Run 1 (M=208.42, SD=28.46) and Run 2 (M=211.53, SD=37.43) during non-reward trials, F(1,32)=0.47, p=0.55, across both groups.
Attenuated Neural Response during Anticipation and Receipt of Substance-Free Activity and Monetary Reward
Substance-free activity reward.
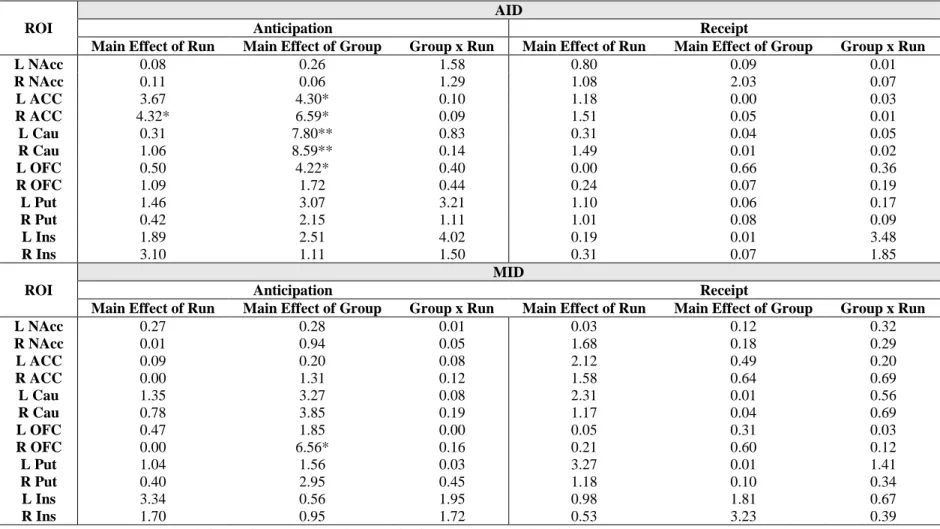
Anticipation. Repeated measures MAN(C)OVAs did not reveal any significant
interaction effects of Run x Group on neural response in any of the ROIs (Table 4). A significant main effect of Run was found on neural response in the right anterior cingulate cortex (ACC) with greater neural response in Run 1 relative to Run 2 across both groups. Additionally, significant main effects of Group on neural response were found for the left ACC, right ACC, left and right caudate, and left orbitofrontal cortex (OFC) with greater neural response in HC relative to the OUDD group across runs. There were no other significant interaction or main effects on neural response in any other ROIs.
Receipt. Repeated measures MAN(C)OVAs did not reveal any significant interaction effects of Run x Group or main effects of Run or Group on neural response in any of the ROIs (Table 4).
Anticipation. Repeated measures MAN(C)OVAs did not reveal any significant
interaction effects of Run x Group or main effects of Run on neural response in any of the ROIs (Table 4). A significant main effect of Group on neural response in the right OFC was found with greater neural response in HC relative to the OUDD group across runs. There were no other significant interaction or main effects on neural response for any other ROIs.
Receipt. Repeated-measures MAN(C)OVAs did not reveal any significant interaction effects of Run x Group or main effects of Run or Group on neural response in any of the ROIs (Table 4).
Global Functional Connectivity during Anticipation and Receipt of Substance-Free Activity and Monetary Reward
Substance-free activity reward.
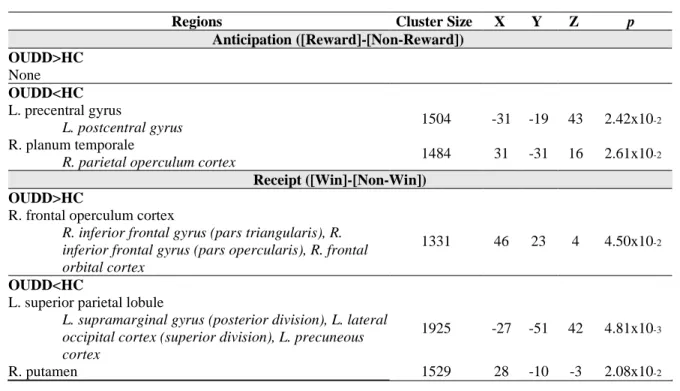
Anticipation. Between-group analyses yielded two significant clusters in which the OUDD group demonstrated significantly reduced functional connectivity with the right ACC relative to the HC group in the left precentral gyrus and right planum temporale (Table 5, Figure 2). The OUDD group did not demonstrate significantly greater functional connectivity relative to the HC group in any clusters of connectivity.
Receipt. Between-group analyses yielded two significant clusters in which the OUDD group demonstrated significantly reduced functional connectivity with the right ACC relative to the HC group in the left superior parietal lobule (SPL) and right putamen (Table 5, Figure 2). Additionally, the OUDD group demonstrated significantly greater functional connectivity in relative to the HC group in one significant cluster, the right frontal operculum cortex/inferior frontal gyrus (IFG).
Anticipation. Between-group analyses yielded five significant clusters in which the OUDD group demonstrated significantly reduced functional connectivity with the right ACC relative to the HC group in the left SPL, left precentral gyrus, left juxtapositional lobule cortex, right supracalcaine cortex, and right juxtapositional lobule cortex (Table 6, Figure 3).
Additionally, the OUDD group demonstrated significantly greater functional connectivity in relative to the HC group in one significant cluster, the right frontal operculum cortex/IFG/insular cortex.
Receipt. Between-group analyses yielded one significant cluster in which the OUDD group demonstrated significantly reduced functional connectivity with the right ACC relative to the HC group in the SPL (Table 6, Figure 3). Additionally, the OUDD group demonstrated significantly greater functional connectivity in relative to the HC group in one significant cluster, the right frontal operculum cortex/IFG/OFC.
Attenuated Functional Connectivity during Anticipation and Receipt of Substance-Free Activity and Monetary Reward
Substance-free activity reward.
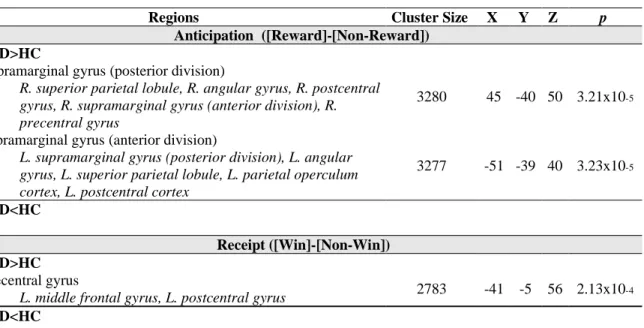
Anticipation. Between-group analyses yielded two significant clusters of activation in which the OUDD group demonstrated significantly greater attenuation of functional connectivity with the right ACC relative to the HC group in the right posterior supramarginal gyrus and the left anterior supramarginal gyrus (Table 7, Figure 4).
Receipt. Between-group analyses yielded one significant cluster of activation in which the OUDD group demonstrated significantly greater attenuation of functional connectivity with the right ACC relative to the HC group in the left precentral gyrus/middle frontal gyrus (MFG) (Table 7, Figure 4).
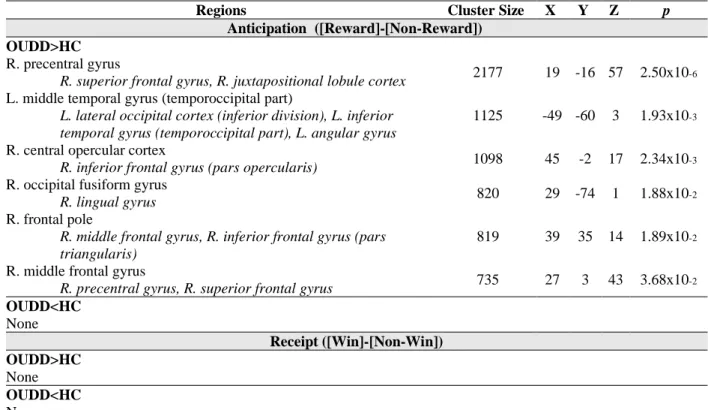
Anticipation. Within-group analyses for the OUDD group of attenuation of functional connectivity with the right ACC during anticipation of monetary reward yielded four significant clusters in the right central opercular cortex/IFG (pars opercularis), left precentral gyrus, left superior frontal gyrus (SFG)/MFG, and the right MFG/SFG (Table 8, Figure 5). Within-group analyses for the HC group yielded two significant clusters in the right paracingulate gyrus and left putamen. Between-group analyses yielded six significant clusters in which the OUDD group demonstrated significantly greater attenuation of functional connectivity with the right ACC relative to the HC group in the right precentral gyrus, left middle temporal gyrus
(temporoccipital part), right central opercular cortex/IFG (pars opercularis), right occipital fusiform gyrus, right frontal pole/MFG/IFG (pars triangularis), and right MFG/SFG.
Receipt. Within-group analyses for the OUDD group of attenuation of functional
connectivity with the right ACC during anticipation of monetary reward yielded two significant clusters in the right SFG and left paracingulate gyrus (Table 8, Figure 5). Within group analyses for the HC group and between-group analyses did not yield any significant clusters of
connectivity.
Attenuation of Functional Connectivity as Predictor of Anhedonia, Behavioral Activation, Environmental Reward, and Substance Use
environmental reward at the one-month follow-up (Table 9) and anhedonia, behavioral
DISCUSSION
The current study tested differences in the attenuation of neural response during both anticipation and receipt of substance-free activity and monetary reward between individuals with opiate use disorder and co-occurring moderate depressive symptoms (OUDD) and healthy controls (HC). Contrary to expectation, the OUDD and HC groups did not demonstrate significant differences in neural ROI attenuation. However, hypothesized group differences in functional connectivity were observed.
emotional information and subsequent regulation of emotional responses (Bush, Luu, & Posner, 2000). Although the current study did not test functional subdivisions of the ACC, previous studies suggest that the rostral ACC may be particularly relevant to the regulation of emotional responses while attending to positively or negatively valenced stimuli (Bush et al., 2000). Attenuation of right ACC activation over time may reflect difficulties in sustained recruitment and engagement of the ACC to represent and/or signal reward value associated with substance-free activity images from the first to the second half of the Activity Incentive Delay (AID) task across both OUDD and HC groups. Importantly, these difficulties were observed during
anticipation, but not receipt of substance-free activity reward, suggesting difficulties in incentive processing of reward stimuli as opposed to the related, but distinct ability to receive reward feedback and to respond accordingly (e.g., sustain positive affect).
One possibility contributing to the attenuation of neural response in the right ACC during anticipation of substance-free activity reward across both OUDD and HC groups may be
The second aim of the current study tested group differences in global functional
connectivity (across both task runs) during the anticipation and receipt of substance-free activity and monetary reward. Compared to the ROI approach, this connectivity approach allows for the consideration of how spatially distinct reward and prefrontal cortical regions are coupled or functionally integrated to perform specific functions (Friston, 2011; Rogers et al., 2007; Smith et al., 2012), such as the representation of expected reward values, active performance monitoring during goal-directed activity, and regulation of positive affect. The right ACC was chosen as the seed ROI given the findings of right ACC neural attenuation across both OUDD and HC groups.
In support of our hypothesis, OUDD participants demonstrated significantly reduced global connectivity between the right ACC and the left precentral gyrus and the right planum temporale during anticipation of substance-free activity reward. In addition, OUDD participants demonstrated significantly reduced global connectivity between the right ACC and the left SPL, precentral gyrus, juxtapositional lobule cortex, right supracalcarine cortex, and juxtapositional lobule cortex during anticipation of monetary reward. One of the central functions of the precentral gyrus is the execution of stimulus-response associations with coordinated activity in motor regions such as the juxtapositional lobule and the superior parietal lobule (SPL) for sensorimotor integration (Brass et al., 2009). Moreover, OUDD participants demonstrated significant reduced global connectivity between the right ACC and the left SPL and right putamen during receipt of substance-free activity reward and between the right ACC and left SPL during receipt of monetary reward relative to HC, further supporting the proposed notion of weaker reward stimulus-response associations among OUDD. Namely, the putamen’s
the parietal lobule is implicated in the integration of sensory and reward information
(Summerfield & Koechlin, 2010). Together, reduced global functional connectivity of the right ACC with these regions may reflect weaker generation of reward stimulus-response associations during both anticipation and receipt of substance-free activity and monetary reward among OUDD participants relative to HC further attributed to substance-free reward and goal
devaluation among individuals with substance use disorder (Montague, Hyman, & Cohen, 2004). Unexpectedly, OUDD participants demonstrated significantly greater global connectivity between the right ACC and right frontal operculum cortex/inferior frontal gyrus (IFG) during anticipation of substance-free activity reward. The right IFG is well understood to be a critical region for emotion regulation, in both healthy and clinical populations, including individuals with depressive symptoms (Johnstone et al., 2007). At rest, increased functional connectivity between the right ACC and right IFG has been found to be associated with increased severity of depressive symptoms among individuals with subclinical depression (Philippi et al., 2015). However, under task demands, increased functional connectivity between the right ACC and right IFG may reflect compensatory recruitment and engagement among OUDD participants to engage in the same degree of integration of attentional engagement and positive emotion regulation as HC. Similarly, OUDD participants also demonstrated significantly greater global connectivity between the right ACC and right frontal operculum cortex/IFG/OFC during receipt of substance-free activity reward relative to HC, further suggesting compensatory recruitment and engagement of attentional processes when receiving reward feedback, not only when anticipating reward.
connectivity between the right ACC and MFG was also found for OUDD participants relative to HC during anticipation of monetary reward, as opposed to receipt of monetary reward.
Therefore, it is important to consider how dysfunctional reward processing may look different depending on the type of reward stimuli. For instance, OUDD participants may have greater challenges with regulating responses to monetary stimuli when anticipating its receipt, rather than during and after the delivery of monetary reward.
In line with findings during the anticipation of reward, OUDD participants demonstrated and between the right ACC and left precentral gyrus/middle frontal gyrus (MFG) during receipt of substance-free activity reward relative to HC, as well as between the right ACC and left paracingulate gyrus and right SFG during receipt of monetary reward relative to HC. Difficulties among OUDD participants to engage in goal-oriented performance monitoring and adjustment of regulatory behavior appear to be consistent throughout both the anticipation and receipt of
reward, suggesting more of an overall, as opposed to a cue or feedback prompted deficit. Taken together, although attenuation of right ACC activation during anticipation of substance-free activity reward was found across both OUDD and HC groups, significant group differences in both global functional connectivity and attenuation of functional connectivity suggest differential mechanistic contributors to ACC activation when temporal relationships and information
processing between spatially distinct regions are considered.
(Walsh et al., 2017). Additionally, MDD outpatients demonstrated greater attenuation of
functional connectivity between striatal seeds and bilateral OFC and right frontal pole. The OFC is well-documented to have numerous connections with limbic areas, such as the amygdala, thalamus, and insula (Peters & Buchel, 2010) allowing for associative information between reward cues and receipt to be encoded in representational memory (Schoenbaum & Roesch, 2005). Thus, attenuation of functional connectivity between these regions may reflect difficulties in associative learning and subsequent generation of reward expectancies. Contrastingly,
attenuation of functional connectivity between the right ACC and bilateral MFG may differently reflect difficulties in the actual execution of positive emotion regulation.
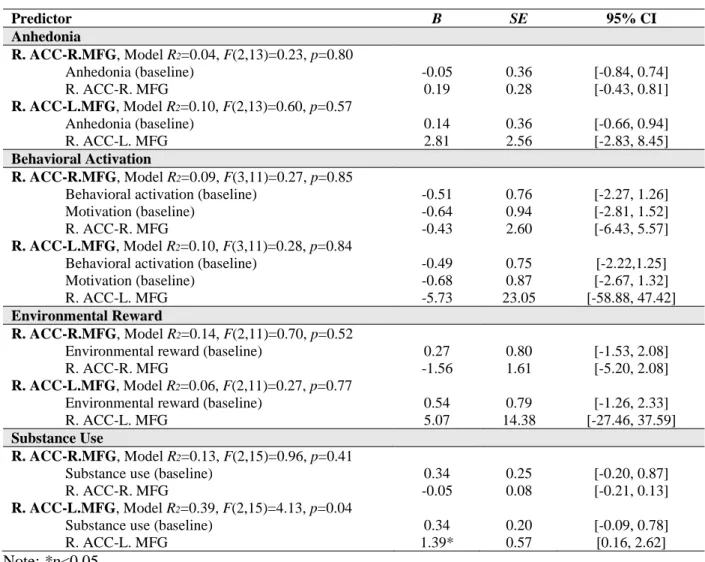
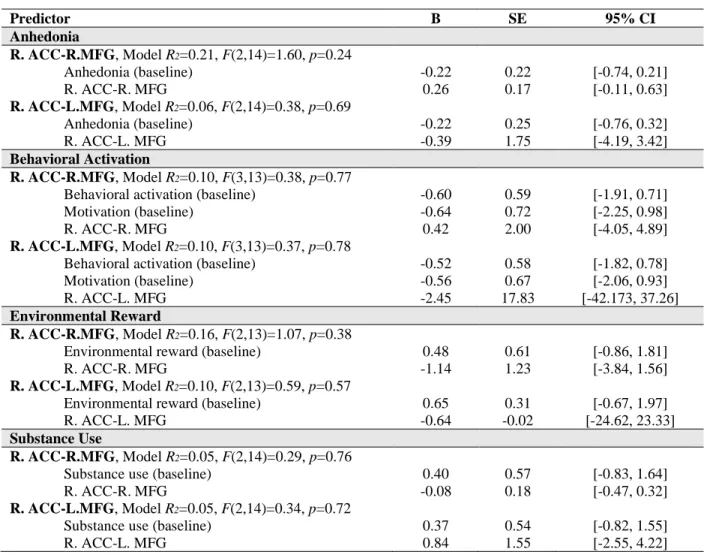
Lastly, in partial support of our third hypothesis, greater attenuation of functional
connectivity between the right ACC and left MFG during anticipation of substance-free activity reward significantly predicted greater frequency of substance use one month later, while it did not significantly predict anhedonia, environmental reward, or reward availability. Interestingly, the ACC and MFG are recognized as major hubs of large-scale networks (Menon, 2011). More specifically, the salience network (SN), primarily involved in the detection and integration of interoceptive and emotional information and stimuli, is anchored in the ACC. The central
responsivity. This is in line with conceptualizations of substance use among individuals with substance use disorder as a loss of control over regulatory behavior when processing reward stimuli (Everitt & Robbins, 2005; Koob & Volkow, 2010). Importantly, attenuation of functional connectivity during the anticipation of substance-free reward may serve as a useful biomarker of substance use outcomes, such as frequency of prospective substance use.
Limitations and Future Directions
Findings should be interpreted considering several limitations. Current findings were reported using a relatively liberal statistical threshold and small sample size. Additionally, given the current OUDD group was male and recruited from an inpatient detoxification facility, findings may not generalize to other substance use populations (e.g., female, outpatient treatment, substance use disorders other than opiate use disorder). Accordingly, future studies should seek to replicate these findings in other samples prior to generalizing these findings. It is also important to note that the current study did not aim to test any casual pathways among neural indicators of reward processing and clinical and mechanistic measures. Rather, findings suggest these neural indicators of reward processing may be potential biomarkers of opiate use disorder and co-occurring moderate depressive symptoms.
Table 1. Sample characteristics OUDD (n=16) HC (n=17) Statistic Mean (SD)
Age (years) 32.19 (8.17) 26.82 (5.29) t(31)=-2.25*
Ethnicity/Race (%) Caucasian/White African American/Black
Native American/American Indian Hispanic/Latino 93.33 0.00 6.25 13.33 64.71 35.29 11.76 0.00
2(1)=3.82
2(1)=6.52*
2(1)=2.28
2(1)=0.30
Education (years) 12.72 (1.67) 13.68 (1.70) t(30)=1.58
Marital Status (%) Single
In a Relationship Living with Partner Married Separated Divorced 66.67 13.33 0.00 0.00 13.33 6.67 52.94 23.53 17.65 5.88 0.00 0.00
2(5)=7.62 -- -- -- -- -- --
WRAT Reading 58.25 (5.50) 61.71 (5.54) t(31)=1.80
Substance Use Characteristics
# days abstinent before scan 3.38 (1.31) -- --
# days in detox before scan 2.38 (1.20) -- --
# days used in last 30 days Alcohol
Cocaine Marijuana Heroin
Painkillers (not prescribed) Amphetamines
Benzodiazepines (not prescribed)
1.44 (3.46) 1.69 (3.65) 1.06 (2.41) 19.25 (9.07) 1.06 (2.52) 0.25 (1.00) 1.06 (2.41) 2.24 (3.35) 0.00 (0.00) 0.76 (1.48) 0.00 (0.00) 0.00 (0.00) 0.00 (0.00) 0.00 (0.00) t(31)=0.67 t(31)=-1.91 t(31)=-0.43 t(31)=24.65** t(31)=-1.74 t(31)=-1.03 t(31)=-1.82
Table 2. Clinical correlates and mechanisms OUDD (n=16) HC (n=17) Statistic Mean (SD) TLFB
# days used any substance in past 30 days Baseline
1-month follow-up 3-month follow-up
# days used heroin in past 30 days Baseline
1-month follow-up 3-month follow-up
# days used painkillers in past 30 days Baseline 1-month follow-up 3-month follow-up 22.25 (7.51) 2.00 (2.37) 5.87 (10.29) 19.25 (9.07) 1.50 (2.58) 1.40 (3.20) 1.06 (2.52) 0.06 (0.25) 0.47 (1.13) -- -- -- -- -- -- -- -- -- -- -- -- -- -- -- -- -- -- BDI Baseline 1-month follow-up 3-month follow-up 23.56 (7.13) 12.21 (11.00) 13.33 (9.96) 3.00 (3.30) -- -- t(31)=-10.74** -- -- Anhedonia Baseline 1-month follow-up 3-month follow-up 3.38 (1.67) 1.50 (1.99) 1.73 (1.39) 0.29 (0.47) -- -- t(31)=-7.32** -- -- BADS Baseline 1-month follow-up 3-month follow-up 33.20 (9.78) 50.08 (14.82) 50.87 (12.85) 62.00 (7.16) -- -- t(29)=9.40** -- -- RPI Baseline 1-month follow-up 3-month follow-up 52.40 (4.29) 57.46 (10.49) 57.47 (8.98) 66.31 (5.83) -- -- t(29)=7.53** -- --
Table 3. Repeated measures MANOVAs on response time for the AID and MID tasks
Source SS df MS F p
AID
Within-Subject Effects
Run 81.19 1 81.19 0.23 0.64
Group x Run 594.435 1 594.435 1.67 0.21
Trial Type 4654.92 1 4654.92 11.88 0.002
Group x Trial Type 34.24 1 34.24 0.09 0.77
Trial Type x Run 316.639 1 316.639 1.40 0.25
Group x Trial Type x Run 94.36 1 94.36 0.42 0.52
Between-Subject Effects
Condition 4316.37 1 4316.37 1.72 0.20
MID
Within-Subject Effects
Run 230.91 1 230.91 0.77 0.34
Group x Run 661.57 1 661.57 2.19 0.15
Trial Type 8196.80 1 8196.80 25.89 <0.001
Group x Trial Type 577.235 1 577.235 1.82 0.19
Trial Type x Run 968.880 1 968.880 7.85 0.009
Group x Trial Type x Run 215.281 1 215.281 1.74 0.20
Between-Subject Effects
Table 4. Group x Run MANOVAs on parameter estimates for a priori ROIs during anticipation and receipt of substance-free activity
reward (AID) and monetary reward (MID)
ROI
AID
Anticipation Receipt
Main Effect of Run Main Effect of Group Group x Run Main Effect of Run Main Effect of Group Group x Run
L NAcc 0.08 0.26 1.58 0.80 0.09 0.01
R NAcc 0.11 0.06 1.29 1.08 2.03 0.07
L ACC 3.67 4.30* 0.10 1.18 0.00 0.03
R ACC 4.32* 6.59* 0.09 1.51 0.05 0.01
L Cau 0.31 7.80** 0.83 0.31 0.04 0.05
R Cau 1.06 8.59** 0.14 1.49 0.01 0.02
L OFC 0.50 4.22* 0.40 0.00 0.66 0.36
R OFC 1.09 1.72 0.44 0.24 0.07 0.19
L Put 1.46 3.07 3.21 1.10 0.06 0.17
R Put 0.42 2.15 1.11 1.01 0.08 0.09
L Ins 1.89 2.51 4.02 0.19 0.01 3.48
R Ins 3.10 1.11 1.50 0.31 0.07 1.85
ROI
MID
Anticipation Receipt
Main Effect of Run Main Effect of Group Group x Run Main Effect of Run Main Effect of Group Group x Run
L NAcc 0.27 0.28 0.01 0.03 0.12 0.32
R NAcc 0.01 0.94 0.05 1.68 0.18 0.29
L ACC 0.09 0.20 0.08 2.12 0.49 0.20
R ACC 0.00 1.31 0.12 1.58 0.64 0.69
L Cau 1.35 3.27 0.08 2.31 0.01 0.56
R Cau 0.78 3.85 0.19 1.17 0.04 0.69
L OFC 0.47 1.85 0.00 0.05 0.31 0.03
R OFC 0.00 6.56* 0.16 0.21 0.60 0.12
L Put 1.04 1.56 0.03 3.27 0.01 1.41
R Put 0.40 2.95 0.45 1.18 0.10 0.34
L Ins 3.34 0.56 1.95 0.98 1.81 0.67
R Ins 1.70 0.95 1.72 0.53 3.23 0.39
Note: *p<0.05, **p<0.01. L=left, R=right. Presented values indicate F-values with df=(1,31).
Table 5. Group differences in global connectivity of rACC functional connectivity during
anticipation and receipt of substance-free activity reward (AID)
Regions Cluster Size X Y Z p
Anticipation ([Reward]-[Non-Reward])
OUDD>HC None OUDD<HC L. precentral gyrus
L. postcentral gyrus 1504 -31 -19 43 2.42x10⁻²
R. planum temporale
R. parietal operculum cortex 1484 31 -31 16 2.61x10⁻²
Receipt ([Win]-[Non-Win]) OUDD>HC
R. frontal operculum cortex
R. inferior frontal gyrus (pars triangularis), R. inferior frontal gyrus (pars opercularis), R. frontal orbital cortex
1331 46 23 4 4.50x10⁻²
OUDD<HC
L. superior parietal lobule
L. supramarginal gyrus (posterior division), L. lateral occipital cortex (superior division), L. precuneous cortex
1925 -27 -51 42 4.81x10⁻³
Table 6. Group differences in global connectivity of rACC functional connectivity during
anticipation and receipt of monetary reward (MID)
Regions Cluster Size X Y Z p
Anticipation ([Reward]-[Non-Reward])
OUDD>HC
R. frontal operculum cortex
R. inferior frontal gyrus (pars triangularis), R. inferior frontal gyrus (pars opercularis), R. frontal orbital cortex, R. insular cortex
2791 46 23 4 1.97x10⁻⁶
OUDD<HC
L. superior parietal lobule
L. lateral occipital cortex (superior division), L. supramarginal gyrus (posterior division)
1744 -22 -53 42 3.00x10⁻⁴
L. precentral gyrus 1414 -13 -26 55 1.78x10⁻³
L. juxtapositional lobule cortex 1107 -14 -1 50 1.05x10⁻²
R. supracalcarine cortex
R. precuneous cortex 1102 29 -53 17 1.08x10⁻²
R. juxtapositional lobule cortex
R. precentral gyrus 902 11 -3 54 3.74x10⁻²
Receipt ([Win]-[Non-Win]) OUDD>HC
R. frontal operculum cortex
R inferior frontal gyrus (pars triangularis), R. inferior frontal gyrus (pars opercularis), R. frontal orbital cortex
2365 45 23 5 1.04x10⁻³
OUDD<HC
L. superior parietal lobule
L. lateral occipital cortex (superior division), L. supramarginal gyrus (posterior division)