Association of sputum and blood eosinophil concentrations
with clinical measures of COPD severity: an analysis of the
SPIROMICS cohort
Annette T Hastie, Fernando J Martinez, Jeffrey L Curtis, Claire M Doerschuk, Nadia N Hansel, Stephanie Christenson, Nirupama Putcha, Victor E Ortega, Xingnan Li, R Graham Barr, Elizabeth E Carretta, David J Couper, Christopher B Cooper, Eric A Hoffman, Richard E Kanner, Eric Kleerup, Wanda K O’Neal, Richard Paine III, Stephen P Peters, Neil E Alexis, Prescott G Woodruff, MeiLan K Han, Deborah A Meyers, Eugene R Bleecker, for the SPIROMICS investigators*
Summary
Background Increased concentrations of eosinophils in blood and sputum in chronic obstructive pulmonary disease
(COPD) have been associated with increased frequency of exacerbations, reduced lung function, and corticosteroid responsiveness. We aimed to assess whether high eosinophil concentrations in either sputum or blood are associated with a severe COPD phenotype, including greater exacerbation frequency, and whether blood eosinophils are predictive of sputum eosinophils.
Methods We did a multicentre observational study analysing comprehensive baseline data from SPIROMICS in
patients with COPD aged 40–80 years who had a smoking history of at least 20 pack-years, recruited from six clinical sites and additional subsites in the USA between Nov 12, 2010, and April 21, 2015. Inclusion criteria for this analysis were SPIROMICS baseline visit data with complete blood cell counts and, in a subset, acceptable sputum counts. We stratified patients on the basis of blood and sputum eosinophil concentrations and compared their demographic characteristics, as well as results from questionnaires, clinical assessments, and quantitative CT (QCT).We also analysed whether blood eosinophil concentrations reliably predicted sputum eosinophil concentrations. This study is registered with ClinicalTrials.gov (NCT01969344).
Findings Of the 2737 patients recruited to SPIROMICS, 2499 patients were smokers and had available blood counts,
and so were stratified by mean blood eosinophil count: 1262 patients with low (<200 cells per μL) and 1237 with high (≥200 cells per μL) blood eosinophil counts. 827 patients were eligible for stratification by mean sputum eosinophil percentage: 656 with low (<1·25%) and 171 with high (≥1·25%) sputum eosinophil percentages. The high sputum eosinophil group had significantly lower median FEV1 percentage predicted than the low sputum eosinophil group
both before (65·7% [IQR 51·8–81·3] vs 75·7% [59·3–90·2], p<0·0001) and after (77·3% [63·1–88·5] vs 82·9% [67·8–95·9], p=0·001) bronchodilation. QCT density measures for emphysema and air trapping were significantly higher in the high sputum eosinophil group than the low sputum eosinophil group. Exacerbations requiring corticosteroids treatment were more common in the high versus low sputum eosinophil group (p=0·002). FEV1
percentage predicted was significantly different between low and high blood eosinophil groups, but differences were less than those observed between the sputum groups.The high blood eosinophil group had slightly increased airway wall thickness (0·02 mm difference, p=0·032), higher St George Respiratory Questionnaire symptom scores (p=0·037), and increased wheezing (p=0·018), but no evidence of an association with COPD exacerbations (p=0·35) or the other indices of COPD severity, such as emphysema measured by CT density, COPD assessment test scores, Body-mass index, airflow Obstruction, Dyspnea, and Exercise index, or Global Initiative for Chronic Obstructive Lung Disease stage. Blood eosinophil counts showed a weak but significant association with sputum eosinophil counts (receiver operating characteristic area under the curve of 0·64, p<0·0001), but with a high false-discovery rate of 72%.
Interpretation In a large, well characterised cohort of former and current smoking patients with a broad range of COPD severity, high concentrations of sputum eosinophils were a better biomarker than high concentrations of blood eosinophils to identify a patient subgroup with more severe disease, more frequent exacerbations, and increased emphysema by QCT. Blood eosinophils alone were not a reliable biomarker for COPD severity or exacerbations, or for sputum eosinophils. Clinical trials targeting eosinophilic inflammation in COPD should consider assessing sputum eosinophils.
Funding National Institutes of Health, and National Heart, Lung, and Blood Institute.
Introduction
Airway inflammation in chronic obstructive pulmonary disease (COPD) is characterised by increased concen trations of neutrophils,1 macrophages,2 proteases,
interleukin 6 and 8, and Thelper1 (Th1) cytokines,3 whereas airway inflammation in asthma is characterised by increased concentrations of eosinophils and Th2 cytokines.4 However, some research has challenged these
Lancet Respir Med 2017;
5: 956–67
Published Online November 13, 2017 http://dx.doi.org/10.1016/ S2213-2600(17)30432-0 See Commentpage 913 *Investigators listed in the
appendix
Wake Forest School of Medicine, Winston-Salem, NC, USA (Prof A T Hastie PhD,
V E Ortega MD, Prof S P Peters MD); Weill
Cornell Medical College of Cornell University, New York, NY, USA (Prof F J Martinez MD); VA Ann Arbor Healthcare System, Ann Arbor, MI, USA
(Prof J L Curtis MD); University
of Michigan, Ann Arbor, MI, USA (Prof J L Curtis,
M K Han MD); University of
North Carolina School of Medicine, Chapel Hill, NC, USA
(Prof C M Doerschuk MD, W K O’Neal PhD); Johns Hopkins
University, Baltimore, MD, USA
(N N Hansel MD, N Putcha MD);
University of California San Francisco, San Francisco, CA, USA (S Christenson MD,
Prof P G Woodruff MD);
University of Arizona College of Medicine, Tucson, AZ, USA
(X Li PhD, Prof D A Meyers PhD, Prof E R Bleecker MD); Columbia
University/Presbyterian Hospital, New York, NY, USA
(Prof R G Barr MD); University of
North Carolina at Chapel Hill, Chapel Hill, NC, USA
(E E Carretta MPH, Prof D J Couper PhD, Prof N E Alexis PhD); David
Geffen School of Medicine, Los Angeles, CA, USA
(Prof C B Cooper MD, E Kleerup MD); University of
Iowa, Iowa City, IA, USA
(Prof E A Hoffman PhD);
University of Utah Health Sciences Center, Salt Lake City, UT, USA (Prof R E Kanner MD,
presumed differences between the characteristic markers of asthma and COPD.
The ECLIPSE study1 reported that in COPD, sputum neutrophil concentrations were weakly associated with lung function and health status, but not associated with exacerbations, emphysema, or systemic inflammation. ECLIPSE reported a mean 1·3% (SD 2·6) sputum eosinophil concentration in 359 patients with COPD,1 but did not observe associations of blood eosinophils with radiological measures of emphysema or with COPD exacerbations and hospital admissions. ECLIPSE reported that concentrations of persistently 2% or more blood eosinophils (150 cells per μL) were associated with evidence of higher FEV1, lower St George Respiratory Questionnaire (SGRQ) score, and modified M edical Research Council score compared with intermittent concentrations or concentrations persistently less than 2%.5 Other COPD studies have reported that increased eosinophils in both blood and sputum are associated with respiratory exacerbations and greater hyperinflation when assessed by quantitative CT (QCT),6,7 suggesting that Th2 inflammation m ight c ontribute t o C OPD p rogression. Furthermore, increased epithelial Th2 signature gene expression has been associated with more severe airflow obstruction in two COPD cohorts.8 Eosinophils might therefore be a potential biomarker in COPD because eosinophilia is related to corticosteroid responsiveness.1,9–11 In a phase 2 clinical trial, antiinterleukin5 receptor
therapy reduced the occurrence of COPD exacerbations in a subgroup of patients with high concentrations of blood and sputum eosinophils.12
Establishing disease severity in patients with COPD is complex and involves more than lung function assessments; additional clinical characteristics have been incorporated in successive revisions of the Global Initiative for Chronic Obstructive Lung Disease (GOLD) severity stages.13 The current classification includes lung function, symptom scores, and exacerbation frequency. Thus, the severity of COPD is dependent on multiple characteristics, and eosinophilic inflammation might contribute.
Previous reports suggest that blood eosinophil counts might be a useful surrogate measure of airway eosinophils in COPD,11,14 although blood eosinophils appear to correlate poorly with sputum eosinophils in asthma,15,16 and do not distinguish between populations who are asthma dominant, COPD dominant, or those who have asthma–COPD overlap.17 However, larger studies of comprehensively phenotyped patients with COPD often do not have robust sputum eosinophil data either because sputum induction was not done or sputum induction cohorts were small.18–21 Thus, whether or not peripheral eosinophils do accurately predict airway eosinophils is unknown.
We investigated the hypotheses that high concentrations of blood and sputum eosinophils in patients with a history
and Department of Veterans Affairs Medical Center, Salt Lake City, UT, USA
(Prof R Paine III) Correspondence to: Prof Annette T Hastie, Center for Genomics and Personalized Medicine Research, Wake Forest School of Medicine, Winston-Salem, NC 27157, USA
See Online for appendix Research in context
Evidence before this study
We did a PubMed search for original research reports using the search terms “eosinophils”, “sputum”, “blood”, and “COPD”from April 15, 2014, to May 18, 2017, which yielded 154 articles, of which 32 were reviews. No publication date or language restrictions were used. Addition of “severity” as a search term reduced the publication number to 33 (seven reviews) and addition of “exacerbation” reduced the number to 35 (one review). However, many of these reports have further limitations. Some did not have sputum or blood eosinophil data for comparison, did not specifically focus on the severity of chronic obstructive pulmonary disease (COPD; eg, exacerbations), or were based on small numbers of patients (<100 per group), which limits the power to make conclusions for broader COPD populations. Generally, eosinophils in COPD have been linked to more frequent exacerbations and responsiveness to
corticosteroid therapy, suggesting more severe disease. Often, studies are done primarily in populations that have met selection criteria for clinical trials, including the presence of COPD exacerbations. Thus, comparison of blood and sputum eosinophil concentrations for an association with severity of COPD phenotype has not been well studied in a general smoking population with a broad range of COPD severity, nor has possible substitution of blood eosinophils as a biomarker for sputum eosinophils in COPD populations been carefully examined.
Added value of this study
This study shows that in a large, comprehensively characterised smoking cohort with a broad range of COPD severity, increased sputum eosinophils, but not blood eosinophils alone, had significant associations with multiple measures of COPD severity, including exacerbations, increased emphysema and air trapping, St George Respiratory Questionnaire scores, and Global Initiative for Chronic Obstructive Lung Disease spirometric stage. Blood eosinophils showed weak association with sputum eosinophils and as a single biomarker had few significant associations with COPD severity and exacerbations. However, this study does show that increased blood eosinophils in combination with increased sputum eosinophils show associations with COPD exacerbations and severity. Implications of all the available evidence
of tobacco use are associated with a more severe COPD phenotype, identified by diminished lung function, QCT measurements of emphysema or airtrapping, clinical COPD characteristics, and exacerbations. We also investigated relationships between blood and sputum eosinophils to establish whether blood eosinophil concentrations reliably predicted sputum eosinophil concentrations. Measuring blood eosinophils is an easier and less expensive option than sputum induction in a clinical setting. Thus, an ability to predict sputum eosinophils accurately from blood eosinophil concentrations would be useful for clinical studies and patient care. These hypotheses were assessed in the comprehensively characterised SPIROMICS cohort.22 A portion of these studies were presented as an abstract at the 2016 American Thoracic Society meeting.23
Methods
Study design and patients
We did a multicentre observational study of baseline data of the Subpopulations and Intermediate Outcome Measures in COPD Study (SPIROMICS) cohort. Individuals aged 40–80 years with current or former history of tobacco use (≥20 packyears) were enrolled in SPIROMICS at six clinical sites and additional subsites in the USA.22 2737 patients were recruited to the SPIROMICS cohort between Nov 12, 2010, and April 21, 2015. Inclusion criteria for this analysis were SPIROMICS baseline visit data with complete blood cell counts and, in a subset, acceptable sputum counts. The cohort included specific groups of smokers with preserved lung function (31%), GOLD stages 1 and 2 (41%), or GOLD stages 3 and 4 (21%), and a control group of nonsmokers (7%). COPD was defined in longterm smokers as a postbronchodilator FEV1:forced vital capacity (FVC) ratio of less than 0·7. All SPIROMICS participants had extensive baseline phenotypic characterisation as follows: lung function assessment before and after bronchodilation with salbutamoland ipratropium; CT total lung capacity (TLC) and residual volume measurements using QCT indicators for emphysema (% voxels less than –950 Hounsfield Units [HU]) at TLC and air trapping (% voxels less than –856 HU) at residual volume; airway metrics (VIDA Diagnostics, Coralville, IA, USA)24 and parametric response mapping (PRM) for functional small airways disease;25 collection of blood (for DNA, RNA, plasma, sera, IgE, and complete blood cell counts), urine (for cotinine and nicotine metabolites, prolineglycineproline, and others as requested), 6min walk distance, GOLD stage, Bodymass index, airflow Obstruction, Dyspnea, and Exercise (BODE) index, COPD assessment test (CAT) score, SGRQ, and medical history questionnaires; and records of numbers of exacerbations (from previous year), hospital admissions, respiratory exposures to vapours, gases, or fumes, and medications.22 Sputum was induced in a subset of the SPIROMICS patients, which was based on those who were capable of sputum induction and produced a sufficient
sample (appendix p 23). Individuals with a primary asthma diagnosis were excluded, but all participants were asked if they had ever had a healthcare professional say that they had asthma (previous asthma label). Information on the selection of stratification cutoffs, reproducibility, and other details are provided in the appendix (pp 2–5).
In the SPIROMICS study, patients with post bronchodilator FEV1 percentage predicted of 35% or more were eligible for sputum induction with saline solutions, and nebulised for three 7min intervals each. Expectorated sputum samples were processed (appendix pp 3–4) and cytospin slides were read by the central reading centre at University of North Carolina (Chapel Hill, NC, USA). Other exclusion criteria were total leucocyte count of 100 or less, or more than 80% squamous epithelial cells. Patients
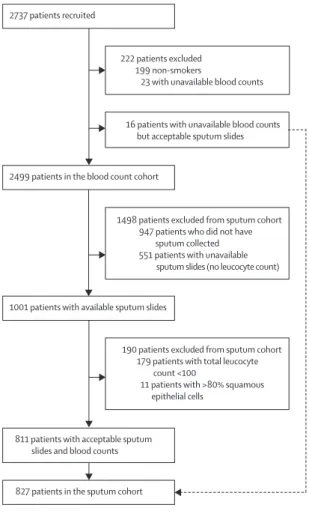
Figure 1: Patient flow diagram
All never-smokers were excluded. Reasons for the reduced number of sputum slide samples available for analysis were as follows: no sputum produced upon completion of induction; no sputum processing form entered; removal of aliquots for mucus analysis and microbiome before processing leaving too little remaining sample for cytospin slide preparation; slides not sent to central slide-reading centre; and slide counts that were deemed unacceptable (leucocyte cell count <100 or >80% squamous epithelial cells). 16 patients with acceptable sputum differential counts but without blood counts were added to those with both acceptable sputum counts and blood counts to form the sputum cohort.
190 patients excluded from sputum cohort 179 patients with total leucocyte count <100
11 patients with >80% squamous epithelial cells
1498 patients excluded from sputum cohort 947 patients who did not have
sputum collected 551 patients with unavailable
sputum slides (no leucocyte count) 16 patients with unavailable blood counts but acceptable sputum slides 222 patients excluded 199 non-smokers
23 with unavailable blood counts 2737 patients recruited
2499 patients in the blood count cohort
1001 patients with available sputum slides
with no sputum collected or no slides prepared were also excluded from sputum analyses.
All SPIROMICS sites that enrolled patients obtained informed consent from patients and were approved by their institutional review boards.
Statistical analysis
Measures not meeting the KolmogorovSmirnov test for normal distribution were transformed by log, or square root values. Continuous variables were tested by parametric or nonparametric tests (appendix p 5; SAS
version 9.2 and Sigmastat version 12.5). We analysed categorical variables with χ² or Fisher’s exact tests. Correlations were examined by Pearson correlation coefficient or linear regression. Receiver operating characteristic (ROC) analysis was done for blood eosinophil prediction of sputum eosinophils. We examined the false discovery rate, which was the number of false positives divided by false positives plus true positives. We did a classification tree analysis of sputum and blood eosinophils to model exacerbations using Rpart routines in R software package. p values of less
Blood eosinophils <200
cells per μL (n=1262) Blood eosinophils ≥200 cells per μL (n=1237)
p value* Sputum eosinophils
<1·25% (n=656) Sputum eosinophils ≥1·25% (n=171) p value*
Age, years 65 (56–70) 65 (59–71) 0·001 65 (57–71) 64 (57–71) 0·87
Sex <0·0001 0·99
Male 631 (50%) 730 (59%) ·· 377 (57%) 99 (58%) ··
Female 631 (50%) 507 (41%) ·· 279 (43%) 72 (42%) ··
Race <0·0001 0·90
White 934 (74%) 1004 (81%) ·· 511 (78%) 132 (77%) ··
Black 285 (23%) 173 (14%) ·· 110 (17%) 29 (17%) ··
Other 43 (3%) 60 (5%) ·· 35 (5%) 10 (6%) ··
Body-mass index 26·8 (23·7–30·9) 28·2 (24·5–32·1) <0·0001 28·3 (24·5–32·2) 28·1 (25·2–31·7) 0·92
Smoking pack-years 41 (30–60) 45 (34–60) 0·008 43 (32–60) 44 (33–60) 0·70
Cigarettes per day 15 (9–20) 15 (8–20) 0·97 15 (10–20) 15 (6–20) 0·52
Current smoker 522 (42%) 451 (37%) 0·003 293 (45%) 70 (41%) 0·39
Inhaled corticosteroids 404 (32%) 470 (38%) 0·002 169 (26%) 66 (39%) 0·002
IgE, IU/mL 34 (14–93) 49 (19–166) <0·0001 41 (16–104) 56 (15–203) 0·32
Sputum eosinophils, % 0·23 (0·00–0·76) 0·65 (0·12–2·42) <0·0001 ·· ·· ··
Blood eosinophils, cells per
μL ·· ·· ·· 150 (100–200) 230 (160–350) <0·0001
Previous asthma 249 (20%) 255 (21%) 0·48 122 (19%) 48 (29%) 0·003
Childhood asthma 97 (8%) 118 (10%) 0·10 52 (8%) 20 (12%) 0·07
Data are median (IQR) or n (%). *Mann-Whitney rank sum test for continuous variables, χ² for categorical variables.
Table 1: Demographics for patients stratified by mean blood or sputum eosinophils
Blood eosinophils <200 cells per μL (n=1262)
Blood eosinophils ≥200 cells per μL (n=1237)
p value* Sputum eosinophils
<1·25% (n=656) Sputum eosinophils ≥1·25% (n=171) p value*
Lung function before bronchodilator
FEV1, L 1·86 (1·22–2·54) 1·81 (1·16–2·55) 0·38 2·15 (1·57–2·77) 1·83 (1·38–2·32) <0·0001
FEV1 percentage predicted 70·5 (46·6–88·2) 66·3 (42·0–85·6) 0·006 75·7 (59·3–90·2) 65·7 (51·8–81·3) <0·0001
FVC percentage predicted 87·2 (74·1–99·3) 84·4 (70·1–96·7) 0·0002 90·9 (78·9–100·0) 87·1 (76·9–97·1) 0·06
FEV1:FVC 0·64 (0·49–0·73) 0·61 (0·47–0·72) 0·016 0·66 (0·58–0·74) 0·61 (0·52–0·69) <0·0001
Lung function after bronchodilator
FEV1, L 2·05 (1·43–2·72) 2·03 (1·39–2·75) 0·62 2·34 (1·78–2·59) 2·11 (1·69–2·59) 0·003
FEV1 percentage predicted 77·7 (53·9–94·4) 74·2 (51·6–91·4) 0·008 82·9 (67·8–95·9) 77·3 (63·1–88·5) 0·001
FVC percentage predicted 92·9 (81·3–103·8) 90·5 (78·8–101·6) 0·001 94·5 (85·1–105·2) 94·2 (85·9–104·1) 0·84
FEV1:FVC 0·66 (0·50–0·76) 0·63 (0·49–0·74) 0·004 0·68 (0·59–0·76) 0·64 (0·55–0·72) 0·0002
Percentage FEV1 reversibility 9·3 (4·2–17·7) 9·8 (4·5–19·0) 0·46 8·0 (3·7–15·4) 11·6 (6·0–21·8) <0·0001
Data are median (IQR). FVC=forced vital capacity. *Mann-Whitney rank sum test for continuous variables.
than 0·05 were considered significant.26 An observational studies monitoring board meets annually to review the study and make recommendations to the National Heart, Lung, and Blood Institute. The SPIROMICS study is registered with ClinicalTrials.gov (NCT01969344).
Role of the funding source
The funder had no role in the study design, data collection, analysis, interpretation, or writing of this report. The corresponding author had full access to all data in the study and all coauthors gave final approval for the decision to submit for publication.
Results
Of the 2737 patients recruited to SPIROMICS, 2499 patients were smokers and had available blood counts (figure 1). Mean blood eosinophil count in these 2499 patients was 200 cells per μL (SD 240; median 190 cells per μL [IQR 100–250]; range 0–8300 cells per μL), thus, 200 cells per μL was used as the cutoff for analyses. A higher eosinophil cutoff of 300 cells per μL was also examined. The 2499 patients were grouped according to their blood eosinophil count: 1262 patients with low (<200 cells per μL) and 1237 with high (≥200 cells per μL) blood eosinophil counts.
Sputum slides were available for 1001 patients (figure 1). 179 patients with differential counts (500–600 total cells) of 100 leucocytes or less in total and 11 patients with 80% or more squamous epithelia were excluded from the analysis. In the 811 individuals with sputum counts, plus 16 other SPIROMICS patients who had sputum counts but not blood eosinophil counts available (total 827), the mean sputum eosinophil percentage was 1·25% (SD 4·25%; median 0·3% [IQR 0·00–0·97]; range 0–75%), so 1·25% was used as the cutoff for analyses. A higher cutoff of 2% for sputum eosinophils was also examined. The 827 patients
with available sputum counts were grouped according to sputum eosinophil concentrations: 656 with low (<1·25%) and 171 with high (≥1·25%) sputum eosinophil counts.
We compared demographic characteristics between patients with high versus low mean blood eosinophil counts and between patients with high versus low mean sputum eosinophil percentages (table 1). Patients with low blood eosinophils (<200 cells per μL) differed significantly with regard to age, sex, race, bodymass index (BMI), smoking history (packyears), the proportion who were current smokers, and the proportion who used inhaled corticosteroids from the patients with high blood eosinophil counts (≥200 cells per μL), although differences between the groups were small at less than 10%. Although the proportion of current smokers was smaller in the high eosinophil group, the number of cigarettes smoked each day was similar. Proportions of patients taking five different medications were not significantly different (appendix p 10). Total serum IgE concentrations and percentage sputum eosinophils were significantly higher in the high blood eosinophil group than the low blood eosinophil group, but no significant difference was recorded in the proportions of patients with a previous asthma label or childhood asthma (table 1). The median sputum eosinophil percentage in both groups was lower than the overall sputum eosinophil mean of 1·25%.
No significant difference was recorded between patients with low sputum eosinophil counts (<1·25%) and patients with high sputum eosinophils (≥1·25%) in terms of age, sex, race, BMI, smoking history (packyears), cigarettes smoked per day, or the proportion who were current smokers. Lymphocyte counts were significantly different between the high and low sputum eosinophil groups (appendix p 11).The high sputum eosinophil group had a significantly greater proportion of patients who had used
Blood eosinophils <200 cells per μL (n=1262)
Blood eosinophils ≥200 cells per μL (n=1237)
p value* Sputum eosinophils
<1·25% (n=656) Sputum eosinophils ≥1·25% (n=171) p value*
TLC left upper lobe,
percentage <–950 HU 3·22 (1·11 to 1·84) 3·77 (1·20 to 1·50) 0·66 2·24 (0·89 to 5·74) 2·88 (1·09 to 7·65) 0·046
TLC right upper lobe,
percentage <–950 HU 2·78 (0·72 to 12·97) 2·87 (0·73 to 11·96) 0·76 1·73 (0·59 to 5·58) 2·43 (0·91 to 7·24) 0·011
TLC left lower lobe,
percentage <–950 HU 2·09 (0·81 to 7·09) 2·42 (0·88 to 7·50) 0·23 1·60 (0·72 to 3·78) 1·98 (0·76 to 5·32) 0·044
Residual volume both lungs,
percentage <–856 HU 17·4 (6·71 to 39·38) 18·91 (7·39 to 40·71) 0·28 12·52 (5·34 to 25·27) 17·20 (8·57 to 33·13) 0·001
PRM for functional small
airways disease, % 14 (4 to 33) 15 (4 to 34) 0·21 9 (3 to 22) 13 (6 to 26) 0·011
Wall thickness of apical
right upper lobe, mm 1·26 (1·15 to 1·37) 1·28 (1·16 to 1·39) 0·032 1·28 (1·18 to 1·38) 1·29 (1·19 to 1·42) 0·08
Taper ratio of apical
right upper lobe 0·04 (–0·01 to 0·09) 0·04 (–0·01 to 0·09) 0·87 0·03 (–0·01 to 0·08) 0·03 (–0·01 to 0·08) 0·93
Data are median (IQR). TLC=total lung capacity. HU=Hounsfield units. PRM=parametric response mapping.*Mann-Whitney rank sum test for continuous variables.
inhaled corticosteroids (table 1) and inhaled or nebulised bronchodilators than the low sputum eosinophil group (appendix p 10). The sputum eosinophil groups, unlike the blood eosinophil groups, did not have significantly different I gE c oncentrations. R egardless, t he I gE concentrations in the low and high sputum eosinophil groups were similar to those in the low and high blood eosinophil groups. The high sputum eosinophil group had a higher concentration of blood eosinophils than the low sputum eosinophil group (median 230 cells per μL [IQR 160–350] vs 150 cells per μL [100–200], p<0·0001) and a greater proportion of patients reporting a previous asthma label (48 [29%] vs 122 [19%], p=0·003). Similar results for blood or sputum eosinophil stratification were obtained with the higher cutoffs of 300 cells per mL blood eosinophils or 2% sputum eosinophils (appendix p 12).
Lung function assessments showed that the high blood eosinophil group had lower prebronchodilator FEV1 percentage predicted than the low blood eosinophil group (median 66·3% [IQR 42·0–85·6] vs 70·5% [46·6–88·2], p=0·006; table 2), and a significant d ifference in po st bronchodilator values was seen (74·2% [51·6–91·4] vs 77·7
[53·9–94·4], p=0·008; table 2). The high sputum eosinophil group had significantly lower FEV1 percentage predicted versus the low sputum eosinophil group both before (65·7% [51·8–81·3] vs 75·7% [59·3–90·2], p<0·0001) and after (77·3% [63·1–88·5] vs 82·9% [67·8–95·9], p=0·001) broncho dilation. Because of the safety exclusion of patients with postbronchodilator FEV1 percentage predicted less than 35% from sputum induction, fewer patients with GOLD stages 3 and 4 were included in the sputum cohort than in the blood cohort. However, the difference between FEV1 percentage predicted before and after bronchodilation was greater between the sputum eosinophil groups than between the blood eosinophil groups. A significant difference was recorded in reversibility of baseline FEV1 percentage predicted between the high and the low sputum eosinophil groups (11·6 [6·0–21·7] vs 8 [3·7–15·4], p<0·0001), but no significant difference was observed between the blood eosinophil groups (p=0·46). Similar observations were noted between subgroups stratified by the 300 cells per μL blood eosinophil and 2% sputum eosinophil cutoffs (appendix p 13).
Blood eosinophils
<200 per μL (n=1262) Blood eosinophils ≥200 per μL (n=1237) p value* Sputum eosinophils <1·25% (n=656) Sputum eosinophils ≥1·25% (n=171) p value*
GOLD stage 0·10† 0·001†
0 505 (40%) 425 (34%) 295 (45%) 51 (30%)
1 150 (12%) 153 (12%) 106 (16%) 31 (18%)
2 323 (26%) 359 (29%) 200 (31%) 76 (44%)
3 190 (15%) 200 (16%) 47 (7%) 11 (6%)
4 79 (6%) 86 (7%) 0 (0%) 1 (1%)
6-min walk distance, m 418 (354–482) 410 (341–471) 0·12 426 (372–482) 426 (363–478) 0·40
BODE index 1 (0–2) 1 (0–2) 0·29 0 (0–1) 1 (0–2) 0·09
COPD score (CAT) 13 (7–20) 13 (7–19·5) 0·45 12 (7–19) 13 (8–20) 0·18
SGRQ (total) 31·5 (14·9–48·2) 31·2 (16·4–47·1) 0·81 26·2 (14·0–43·6) 31·8 (17·2–47·1) 0·05
SGRQ (symptoms) 45·3 (22·9–66·3) 48·8 (27·0–66·3) 0·037 45·2 (23·5–65·1) 53·6 (34·0–69·7) 0·004
Wheezing 741 (59%) 788 (64%) 0·018 389 (60%) 116 (68%) 0·07
Data are median (IQR) or n (%). GOLD=Global Initiative for Chronic Obstructive Lung Disease. BODE=Body-mass index, airflow Obstruction, Dyspnea, and Exercise. COPD=chronic obstructive pulmonary disease. CAT=COPD assessment test. SGRQ=St George Respiratory Questionnaire. *Mann-Whitney rank sum test for continuous variables or χ² for categorical variables. †Value for all GOLD stages combined.
Table 4: Clinical characteristics for patients stratified by mean blood or sputum eosinophils
Blood eosinophils <200 per μL (n=1262)
Blood eosinophils ≥200 per μL (n=1237)
p value* Sputum eosinophils
<1·25% (n=656) Sputum eosinophils ≥1·25% (n=171) p value*
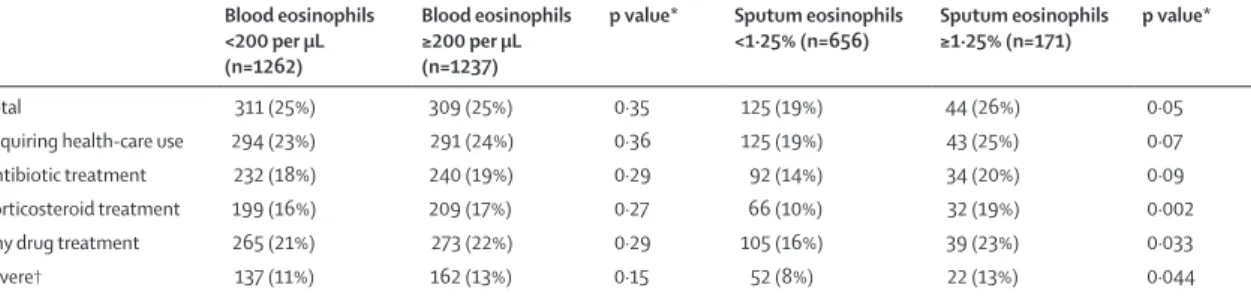
Total 311 (25%) 309 (25%) 0·35 125 (19%) 44 (26%) 0·05
Requiring health-care use 294 (23%) 291 (24%) 0·36 125 (19%) 43 (25%) 0·07
Antibiotic treatment 232 (18%) 240 (19%) 0·29 92 (14%) 34 (20%) 0·09
Corticosteroid treatment 199 (16%) 209 (17%) 0·27 66 (10%) 32 (19%) 0·002
Any drug treatment 265 (21%) 273 (22%) 0·29 105 (16%) 39 (23%) 0·033
Severe† 137 (11%) 162 (13%) 0·15 52 (8%) 22 (13%) 0·044
Data are n (% positive). *χ² test. †Exacerbations involving a trip to an emergency department or admission to hospital.
QCT imaging showed that indices of emphysema (TLC, % voxels less than –950 HU) and air trapping (residual volume, % voxels less than –856 HU)24 did not differ between the blood eosinophil groups (table 3). By contrast, significantly higher emphysema indices were observed in the high sputum eosinophil group versus the low sputum eosinophil group. Additionally, air trapping (residual volume) and PRM for functional small airways disease25 were significantly higher in the high sputum eosinophil group than in the low sputum eosinophil group. A small, 0·02 mm increase in median airway wall thickness at the prespecified RB1 pathway in the apical segment of the right upper lobe (appendix pp 4–5) was seen in the high versus low blood eosinophil groups (p=0·032), but no difference was seen between the sputum eosinophil groups (p=0·08). Neither blood nor sputum stratification showed any significant difference in airway tapering (an index of bronchiectasis).
With the higher 300 cells per μL blood eosinophil cutoff, the density measures for emphysema or air trapping were not significantly different between groups; but the RB1 airway wall thickness difference was less significant with the higher cutoff than the difference seen with the 200 cells per μL cutoff (p=0·044 vs p=0·032). The higher cutoff maintained significant differences between low (<2%) and high (≥2%) sputum eosinophil groups in terms of both emphysema and air trapping indices (appendix p 14).
GOLD stages were significantly different between the high and low sputum eosinophil groups (p=0·001; table 4). 295 (45%) of 656 patients with low sputum eosinophils were GOLD stage 0 versus 51 (30%) of 171 in the high sputum eosinophil group; and 200 (31%) of 656 were GOLD stage 2 in the low sputum eosinophil group versus 76 (44%) of 171 in the high eosinophil group. No significant difference in GOLD stages was recorded between the low and high blood eosinophil groups (p=0·10). The 6min walk distance, BODE index, and COPD assessment score were not significantly different in either blood or sputum eosinophil stratifications. The high blood eosinophil group had significantly higher proportion of patients who reported wheezing (788 [64%] of 1237 patients) than the low blood eosinophil group (741 [59%] of 1262; table 4). SGRQ symptom score was significantly higher in the high blood eosinophil group than the low blood eosinophil group; and both SGRQ total and symptom scores were significantly higher in the high sputum eosinophil group than the low sputum eosinophil group.
With the higher blood eosinophil cutoff of 300 cells per μL, a significant difference in GOLD stages was seen between the high and low groups (appendix p 15). With the higher sputum eosinophil cutoff of 2%, GOLD stages and SGRQ total and symptoms scores remained significantly different between the high and low count groups. BODE index, SGRQ impact, and selfreported wheezing, which were not significantly different with the 1·25% sputum cutoff, were significantly different with the 2% cutoff.
Exacerbations were compared for associations with blood and sputum eosinophil counts (table 5). Blood eosinophil counts were not significantly associated with any of the different categories of reported exacerbations. By contrast, the high sputum eosinophil group had a higher proportion of patients with exacerbations requiring corticosteroids than the low sputum eosinophil group (32 [19%] of 171 vs 66 [10%] of 656; p=0·002), as well as a higher proportion of patients with exacerbations requiring any drug treatment (39 [23%] of 171 vs 105 [16%] of 656; p=0·033) and with severe exacerbations requiring an emergency department visit (22 [13%] of 171 vs 52 [8%] of 656; p=0·044).
With the higher eosinophil cutoff of 300 cells per μL blood, still no significant differences were seen between the high and low count groups in terms of the proportions of patients with exacerbations; however, the higher 2% sputum eosinophil cutoff showed significant differences for all categories of COPD exacerbations (appendix p 16).
Tree classification analysis of the association of sputum and blood eosinophil counts with exacerbations selected sputum eosinophils before blood eosinophils, with similar cutoffs to those used in the sputum and blood eosinophil stratification (1·25% or 2% sputum eosinophils and 200 or 300 cells per μL blood eosinophils). The cutoffs were less than 1·9% or 1·9% or more for sputum eosinophils and less than 176 cells per μL or 176 cells per μL or more for blood eosinophils. These cutoffs suggest that the 2% sputum eosinophils and 200 cells per μL blood eosinophils investigated in our study were appropriate (appendix p 23). Exacerbations were recorded in 27 (23%) of 119 patients with sputum eosinophils of more than 1·9%. By contrast, 65 (9%) of 692 patients with less than 1·9% sputum eosinophils had exacerbations (appendix p 23).
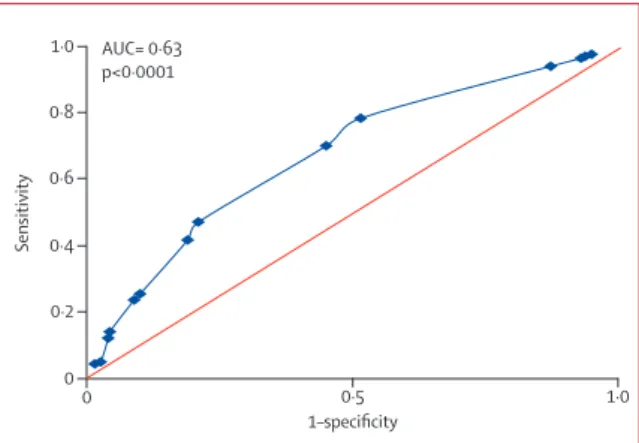
Figure 2: Receiver operating characteristic analysis for blood eosinophil prediction of sputum eosinophils
Blood eosinophils at cutoffs from 50 cells per μL (highest sensitivity) to 500 cells per μL (lowest sensitivity) were examined for correct prediction of sputum eosinophils less than 1·25% or 1·25% or more. Maximum sensitivity and specificity were observed at a blood eosinophil cutoff of 150 cells per μL. AUC=area under the curve.
0 0·5 1·0
Sensitivity
1–specificity 1·0
0·8
0·6
0·4
0·2
AUC= 0·63 p<0·0001
ROC analyses for blood eosinophil prediction of sputum eosinophils showed a weak, although significant, prediction of sputum eosinophils of 1·25% or more (AUC 0·63, p<0·0001; figure 2); ROC to predict sputum eosinophils of 2% or more showed similar results (AUC 0·64, p<0·0001; appendix p 24). The highest sensitivity and specificity ( shown b y Y ouden i ndex; appendix p 17) for predicting sputum eosinophils of 1·25% or more were at 150 cells per μL blood eosinophils; and highest sensitivity and specificity f or sputum eosinophils 2% or more were at 250 cells per μL blood eosinophils. Similar significant A UCs w ere observed at all the assessed adjacent cutoffs, suggesting that the blood eosinophil concentration above which one can confidently and accurately predict increased sputum eosinophils is not sharply defined (appendix p 1 7). Regardless, both associations had very large false discovery rates; 72% for blood eosinophils of 150 cells per μL or more to predict sputum eosinophils 1·25% or more (falsenegative rate of 22%), and 74% for blood eosinophils of 250 cells per μL or more to predict sputum eosinophils of 2% or more (falsenegative rate of 50%).
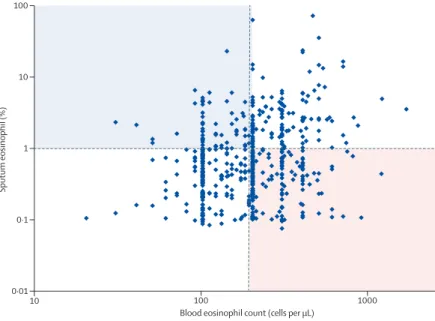
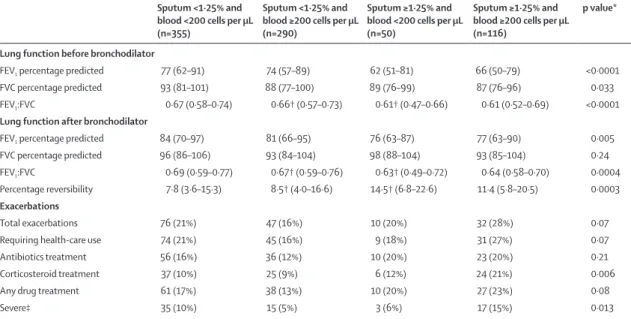
The correlation between sputum eosinophils and blood eosinophils was weak, but significant (figure 3; correlation coefficient r=0·178, p< 0·0001). 34 0 (4 2%) of 81 1 patients had discordant blood and sputum eosinophil counts; either high in blood or sputum counts, but not both simultaneously (figure 3). We compared lung function and reported exacerbations for patients in the two discordant and concordant groups (table 6). Both groups with high sputum eosinophils with or without high blood eosinophils had the lowest lung function indicators before bronchodilation. Lung function for the high blood plus low sputum eosinophils group was not significantly different from the group with low blood and low sputum eosinophils (p values not shown). The high blood plus high sputum eosinophil group had a greater proportion of patients with COPD exacerbations than the group with high blood but low sputum eosinophils; exacerbations treated with corticosteroids (p=0·006) or severe exacerbations requiring emergency department visit or hospital admission (p=0·013) were both significantly different.
Patients were stratified by previous asthma label or inhaled corticosteroid use and examined for interaction with high eosinophil counts (blood eosinophils ≥200 cells per μL or sputum eosinophils ≥1·25%) in terms of lung function and exacerbations. No significant i nteractions were seen (appendix pp 18–19).
Patients who did not have acceptable sputum slides (n=1498) were stratified by blood eosinophil counts to establish whether these patients had a phenotype with different characteristics (appendix p 20). Of these patients, the high eosinophil group had a slightly higher proportion of patients who used inhaled corticosteroids, had worse lung function, and had GOLD stages 3 and 4 than the low count group, as would be expected in
these patients who were ineligible for sputum induction, but otherwise resembled the larger cohort of smokers.
Another stratification examined whether the blood eosinophil groups showed differences when restricted to just the 811 patients who were also in the sputum cohort (appendix p 21). Compared with the wholecohort proportions, the sputum cohort had slightly greater proportions of current smokers (low blood eosinophil group 47% and high group 42% in sputum subcohort vs low group 42% and high group 37% in whole cohort), less inhaled corticosteroid use (low group 26% and high group 31% vs low group 32% and high group 38%), and slightly better lung function, but did not show the same radiological, clinical, or exacerbation differences observed for sputum eosinophil stratification (table 1; appendix p 21).
We examined whether the associations with worse lung function and quality of life, and greater exacerbations, emphysema, and air trapping in the high sputum eosinophil group were associated with increased sputum neutrophils as well as eosinophils. No difference in mean sputum neutrophil percentage between the high and low sputum eosinophil groups was seen (p=0·12; appendix p 11). Stratification of the sputum cohort into four groups of less than 1·25% or 1·25% or more eosinophils plus less than 68% or 68% or more neutrophils (on the basis of the mean sputum neutrophils of 68% [SD 21]), confirmed differences across low and high sputum eosinophil groups but did not show significant posthoc differences between the high eosinophil plus high neutrophil and high eosinophil plus low neutrophil subgroups (appendix p 22).
Figure 3: Distribution of blood eosinophils with respect to sputum eosinophils
Although a significant association between blood and sputum eosinophils was seen (Pearson correlation coefficient r=0·178, p<0·0001), use of the cutoff of 200 cells per μL blood or more eosinophils (vertical red line) to predict sputum eosinophils of at least 1·25% (horizontal red line) will mistakenly identify many patients with lower sputum eosinophil percentages (lower right quadrant, pink) and miss many patients with actual sputum eosinophils of 1·25% or more (upper left quadrant, blue).
10 100 1000
0·01
Sputum eosinophil (%)
Blood eosinophil count (cells per µL) 0·1
1 100
Discussion
This study in patients from the SPIROMICS cohort, who were smokerswith COPD of varying severity as defined by GOLD stages, confirms that high concentrations of sputum eosinophils, but not blood eosinophils (unless in combination with high sputum eosinophils), identify a subset of patients with COPD with more severe airflow obstruction, worse quality of life, greater emphysema and air trapping, and greater number of exacerbations. Using sputum eosinophil stratification with cutoffs at either the mean (1·25%) or 2%, we found significant associations of high sputum eosinophil counts with numbers of COPD exacerbations, including those that are severe and those requiring corticosteroid therapy. Additionally, significant associations were seen between sputum eosinophil concentration and lung function, before and after bronchodilation, including increased bronchodilator reversibility, respiratory symptoms, emphysema and air trapping assessed by QCT, and COPD severity by GOLD stage. By contrast, blood eosinophils alone, with cutoffs at 200 cells per μL or 300 cells per μL, showed no association with COPD exacerbations, and associations with other phenotypic markers were small or nonsignificant. Although SGRQ symptom scores were associated with high eosinophil counts in both blood and sputum, the differences between groups for this variable was greater with the sputum stratification. Furthermore, no difference in CAT scores was seen with either blood or sputum stratification, which diminishes the validity of use of this score.
Notably, although the relationship between blood and sputum eosinophil counts was statistically significant, blood eosinophils did not reliably predict sputum eosinophils, showing a 72–74% falsediscovery rate and a 50% falsenegative rate for sputum eosinophils of 2% or more. Lung function data stratified by high and low sputum and blood eosinophils showed no relationship with high blood eosinophils unless combined with high sputum eosinophils, whereas high sputum eosinophil count, regardless of blood eosinophil count, was associated with worse lung function. However, patients with COPD who had both high sputum and high blood eosinophil concentrations had both decreased lung function and more frequent exacerbations. These findings in a large multicentre cohort of smokers with a specified range of COPD severity have important implications for the proposed use of blood eosinophils alone as a predictive biomarker to guide individualised COPD therapies.
Our results extend observations from previous studies in COPD cohorts, including ECLIPSE,1 which focused primarily on neutrophilic airways inflammation, and, although reporting eosinophil presence,5 did not address the association of eosinophil counts with indices of COPD severity.4,5 The importance of our findings and of Th2 inflammation in COPD are emphasised by the recent report of Th2 gene expression overlap in airway epithelial samples from asthma and COPD cohorts,8 and by the shared clinical and biological characteristics between asthma and COPD that have been reported in
Sputum <1·25% and blood <200 cells per μL (n=355)
Sputum <1·25% and blood ≥200 cells per μL (n=290)
Sputum ≥1·25% and blood <200 cells per μL (n=50)
Sputum ≥1·25% and blood ≥200 cells per μL (n=116)
p value*
Lung function before bronchodilator
FEV1 percentage predicted 77 (62–91) 74 (57–89) 62 (51–81) 66 (50–79) <0·0001
FVC percentage predicted 93 (81–101) 88 (77–100) 89 (76–99) 87 (76–96) 0·033
FEV1:FVC 0·67 (0·58–0·74) 0·66† (0·57–0·73) 0·61† (0·47–0·66) 0·61 (0·52–0·69) <0·0001
Lung function after bronchodilator
FEV1 percentage predicted 84 (70–97) 81 (66–95) 76 (63–87) 77 (63–90) 0·005
FVC percentage predicted 96 (86–106) 93 (84–104) 98 (88–104) 93 (85–104) 0·24
FEV1:FVC 0·69 (0·59–0·77) 0·67† (0·59–0·76) 0·63† (0·49–0·72) 0·64 (0·58–0·70) 0·0004
Percentage reversibility 7·8 (3·6–15·3) 8·5† (4·0–16·6) 14·5† (6·8–22·6) 11·4 (5·8–20·5) 0·0003
Exacerbations
Total exacerbations 76 (21%) 47 (16%) 10 (20%) 32 (28%) 0·07
Requiring health-care use 74 (21%) 45 (16%) 9 (18%) 31 (27%) 0·07
Antibiotics treatment 56 (16%) 36 (12%) 10 (20%) 23 (20%) 0·21
Corticosteroid treatment 37 (10%) 25 (9%) 6 (12%) 24 (21%) 0·006
Any drug treatment 61 (17%) 38 (13%) 10 (20%) 27 (23%) 0·08
Severe‡ 35 (10%) 15 (5%) 3 (6%) 17 (15%) 0·013
Data are median (IQR) or n (%). p values are for comparisons of all four groups; for variables with significant values, post-hoc pairwise comparisons (Dunn’s method) were done (p values not shown). *Kruskal-Wallis for continuous variables, χ² for exacerbation categories. †High sputum eosinophils plus low blood eosinophils was significantly different from low sputum eosinophils plus high blood eosinophils by post-hoc Dunn’s test. ‡Exacerbations involving a trip to an emergency department or admission to hospital.
several studies.5,7,17,27,28 However, differences should be noted between the SPIROMICS cohort and other COPD cohorts. The COPDGene study29 enrolled a larger cohort of 10 000 patients who had an older minimum age (45 years) and a lower minimum smoking history (>10 packyears) than the SPIROMICS cohort, but phenotyping with induced sputum was not done. Sputum was also unavailable in the Copenhagen general
population study,20 WISDOM,21 INSPIRE, and
TRISTAN.30 Although these studies reported
exacerbations associated with highblood eosinophils, the entry requirements included past history of COPD exacerbations, which can affect the results because a past history of exacerbation is the most important factor in predicting future exacerbations.18
Emphasis on persistent Th2 inflammation in COPD31 has focused on eosinophils as predictors of exacerbations. Bafadhel and colleagues6 reported a cluster analysis using blood and sputum biomarkers, and peripheral blood eosinophils predicted sputum eosinophil associated exacerbations of COPD. Sputum and peripheral blood eosinophils have been used to direct corticosteroid treatment and reduce occurrence of COPD exacerbations.9–11 The ECLIPSE study reported that 1483 patients stratified by blood eosinophil counts did not have different numbers of COPD exacerbations in the previous year.5 We confirm that h igher b lood eosinophils are not associated with COPD exacerbations except when combined with increased sputum eosinophils or with other characteristics, such as a previous history of exacerbation.18 However, we established that in the SPIROMICS cohort, higher sputum eosinophil counts alone are associated with exacerbations even in mild to moderate COPD.
Eosinophil counts have been suggested to indicate the response to corticosteroids, antiinterleukin5, or anti interleukin5 receptor therapy.9–12,32 In a retrospective analysis of two COPD exacerbation studies with long acting β agonists and inhaled corticosteroids, Pascoe and colleagues33 showed that patients with high blood eosinophil counts had greater reductions in COPD exacerbations than those with low blood eosinophil counts. These observations suggest that eosinophils might be important in development of COPD exacerbations or as a potential biomarker of some COPD exacerbations. However, two factors might have influenced p revious observations that associated high blood eosinophil counts with greater numbers of COPD exacerbations: selection criteria requiring recent exacerbation and perhaps worse lung function are both related to future COPD exacerbations and might be surrogate markers of increased sputum eosinophils. Increased blood eosinophils, if also combined with increased sputum eosinophils, were associated with COPD exacerbations in our results in the SPIROMICS cohort. However, blood eosinophils alone were not associated with exacerbations, even when the patient had a previous asthma label. This observation
contrasts with the association of blood eosinophil count of 275 cells per μL or more with allcause mortality in 662 patients in a previous study;34 however, that study found no change after exclusion of patients with asthma.
We also examined other characteristics in the blood and sputum eosinophil subgroups of SPIROMICS patients that might suggest overlap with asthma: bronchodilator reversibility, IgE concentrations, and previous asthma label. High blood eosinophil counts with two different cutoffs (≥200 or ≥300 cells per μL) did not have greater acute bronchodilator reversibility, whereas increased sputum eosinophils groups did show significantly greater reversibility. IgE concentrations were significantly higher in the high versus low blood eosinophil groups, but no difference was seen between the sputum groups. However, the IgE concentrations in the SPIROMICS blood and sputum eosinophil subgroups were well below the median (91 IU per mL) and high (173 IU per mL) IgE cutoffs reported in a study of asthma–COPD overlap syndrome.35 Only grouping by 2% or more sputum eosinophils showed differences in proportions of patients who reported previous asthma label; but the proportion reporting asthma was still small (12·5% of the ≥2% group).
A higher proportion of patients had been prescribed inhaled corticosteroids in the high blood and sputum eosinophil groups than in the low eosinophil groups. This observation was made despite an expected reduction in eosinophil concentrations with corticosteroid therapy. Use of corticosteroids in the higher eosinophil groups potentially reflects individuals who are more likely to have had exacerbations, consistent with GOLD guideline recommendations for corticosteroids in patients with COPD who have frequent exacerbations.13
sputum induction and processing, some factors still prevented sputum analysis on all eligible patients (appendix pp 2–5). However, analysis of those who did not have sputum analysis stratified by blood eosinophil concentrations did not differ substantially from the larger cohort who did have sputum samples taken.
Of interest, longitudinal followup of the SPIROMICS cohort might be used to confirm the observations of Hospers and colleagues,34 that peripheral eosinophils are associated with allcause mortality over a period of 30 years. Alternatively, the differences in lung function associated with blood eosinophil counts (cutoff 2%) observed in the much smaller study over 9 years by Rogliani and colleagues37 should be examined in the larger SPIROMICS cohort longitudinally.
In summary, using the large and comprehensive phenotypic characterisation of the SPIROMICS cohort, we show that stratification by increased sputum eosinophil inflammation identified a subgroup with more severe COPD, decreased lung function, worse emphysema and air trapping, and more COPD exacerbations. Peripheral blood eosinophil counts identified a subgroup with decreased lung function without other indices of more severe COPD, specifically exacerbations, unless examined on the background of increased sputum eosinophils. Furthermore, blood eosinophil counts did not accurately predict sputum eosinophil counts. These observations confirm the importance of assessing eosinophils in the airways. In future, patients with high sputum eosinophil concentrations should be followed longitudinally to establish whether this factor has longterm effects on the progression of COPD.
Contributors
ATH, FJM, JLC, CBC, CMD, NNH, RGB, EAH, REK, EK, WKO’N, SPP, PGW, MKH, and ERB contributed to the concept and design of the study. ATH, FJM, JLC, CMD, NNH, SC, NP, VEO, RGB, EEC, DJC, CBC, EAH, REK, EK, RP, NEA, PGW, MKH, DAM, and ERB recruited the cohort and acquired the data. ATH, FJM, JLC, NNH, NP, XL, RGB, EEC, CBC, DJC, EAH, RP, PGW, MKH, DAM, and ERB analysed and interpreted the data. All authors drafted and critically revised the manuscript, approved the final version for publication, and agreed to be accountable, ensuring the accuracy and integrity of the work.
Declaration of interests
ATH, CMD, and DAM report support from the National Heart, Lung, and Blood Institute (NHLBI) and the Foundation for the National Institutes of Health (FNIH) during conduct of study. FJM reports grants from NIH; personal fees from Forest, Janssens, GlaxoSmithKline (GSK), Nycomed/ Takeda, Amgen, AstraZeneca, Boehringer Ingelheim, Ikaria/Bellerophon, Genentech, Novartix, Pearl, Pfizer, Roche, Sunovion, Theravance, Axon, CME Incite, California Society for Allergy and Immunology, Annenberg, Informa, Integritas, InThought, Miller Medical, National Association for Continuing Education, Paradigm, Peer Voice, UpToDate, Haymarket Communications, Western Society of Allergy and Immunology, Unity Biotechnology, ConCert, Lucid, Methodist Hospital, Prime, and WebMD. JLC reports grants from NHLBI, National Institute of Allergy and Infectious Disease of the National Institute of Health, the Department of Veterans Affairs, FNIH, and the COPD Foundation. NNH reports grants from AstraZeneca, NIH, the COPD Foundation, Boehringer Ingelheim, and GSK. SC reports grants from MedImmune; personal fees from AstraZeneca; and nonfinancial support from Genentech. FJM reports grants from NIH; personal fees from Forest, Janssens, GSK, Nycomed/
Takeda, Amgen, AstraZeneca, Boehringer Ingelheim, Ikaria/Bellerophon, Genentech, Novartix, Pearl, Pfizer, Roche, Sunovion, Theravance, Axon, CME Incite, California Society for Allergy and Immunology, Annenberg, Informa, Integritas, InThought, Miller Medical, National Association for Continuing Education, Paradigm, Peer Voice, UpToDate, Haymarket Communications, Western Society of Allergy and Immunology, Unity Biotechnology, ConCert, Lucid, Methodist Hospital, Prime, and WebMD. VEO reports personal fees from CSL Behring. RGB reports grants from NIH, FNIH, and the COPD Foundation; grants from Alpha1 Foundation; and personal fees from UpToDate. EEC reports support from NHLBI, FNIH, Genentech, and the COPD Foundation during conduct of study. DJC reports support from NHLBI and the COPD Foundation. CBC reports grants from Equinox Health Clubs, Amgen, and Spiration; personal fees from Equinox Health Clubs, PulmonX, Boehringer Ingelheim, GSK, and SPIRATION; and parttime work for scientific engagement for GSK Global Respiratory Franchise outside of submitted work. EAH is a founder and shareholder of VIDA Diagnostics, a company commercialising lung image analysis software developed, in part, at the University of Iowa. EK reports grants from the NIH and the FNIH; non financial support (inhalers for spirometry testing) from Boehringer Ingelheim and GSK during the conduct of the study; and grants from Boehringer Ingelheim, Novartis, Pearl/AstraZeneca, and Sunovion/ Sepracor. RP reports support from NHLBI and the COPD Foundation; and a grant from the Department of Veterans Affairs. MKH reports support from NIH, FNIH, and the COPD Foundation; consulting fees from GSK, Boehringer Ingelheim, Novartis, AstraZeneca, and Sunovion; and royalties from UptoDate. SPP reports grants from NIH, NHLBI, and the COPD Foundation. PGW reports grants from Medimmune; personal fees from Genentech/Roche, AstraZeneca, Novartis, Neostem, and Janssen; and a patent for Asthma diagnostics pending. All other authors declare no competing interests.
Acknowledgments
SPIROMICS was supported by contracts from the NIH/NHLBI (HHSN268200900013C, HHSN268200900014C, HHSN268200900015C, HHSN268200900016C, HHSN268200900017C, HHSN268200900018C HHSN268200900019C, HHSN268200900020C), which were supplemented by contributions made through the FNIH from AstraZeneca; Bellerophon Therapeutics; Boehringer Ingelheim Pharmaceuticals; Chiesi Farmaceutici; Forest Research Institute; GSK; Grifols Therapeutics; Ikaria; Nycomed; Takeda Pharmaceutical Company; Novartis Pharmaceuticals Corporation; Regeneron Pharmaceuticals; Sanofi, and the COPD Foundation. Additional CT analyses were made possible by NIH/NHLBI HL122438. We thank the SPIROMICS participants and participating physicians, investigators, and staff for making this research possible. We would like to acknowledge the following current and former investigators of the SPIROMICS sites and reading centres: Wayne H Anderson, Russell P Bowler,
Alejandro P Comellas, Gerard J Criner, Ronald G Crystal, Mark T Dransfield, Christine M Freeman, Robert J Kaner, Jerry A Krishnan, Stephen C Lazarus, John D Newell Jr, Elizabeth C Oelsner, Stephen I Rennard, Donald P Tashkin, Mary Beth Scholand, J Michael Wells, and Robert A Wise.
References
1 Singh D, Edwards L, TalSinger R, Rennard S. Sputum neutrophils as a biomarker in COPD: findings from the ECLIPSE study.
Respir Res 2010; 11: 77–89.
2 Hiemstra PS. Altered macrophage function in chronic obstructive pulmonary disease. Ann Am Thorac Soc 2013; 10 (suppl): S180–85. 3 Chung KF. Cytokines in chronic obstructive pulmonary disease.
Eur Respir J Suppl 2001; 34: 50s–59s.
4 Sethi S, Mahler DA, Marcus P, Owen CA, Yawn B, Rennard S. Inflammation in COPD: implications for management. Am J Med 2012; 125: 1162–70.
5 Singh D, Kolsum U, Brightling CE, et al. Eosinophilic inflammation in COPD: prevalence and clinical characteristics. Eur Respir J 2014; 44: 1697–700.
7 Hardin M, Silverman EK, Barr RG, et al. The clinical features of the overlap between COPD and asthma. Respir Res 2011; 12: 127. 8 Christenson SA, Steiling K, van den Berge M, et al.
Asthma–COPD overlap: clinical relevance of genomic signatures of type 2 inflammation in chronic obstructive pulmonary disease.
Am J Respir Crit Care Med 2015; 191: 758–66.
9 Brightling CE, Monteiro W, Ward R, et al. Sputum eosinophilia and shortterm response to prednisolone in chronic obstructive pulmonary disease: a randomized controlled trial. Lancet 2000; 356: 1480–85. 10 Siva R, Green RH, Brightling CE, et al. Eosinophilic airway
inflammation and exacerbations of COPD: a randomized controlled trial. Eur Respir J 2007; 29: 906–13.
11 Bafadhel M, McKenna S, Terry S, et al. Blood eosinophils to direct corticosteroid treatment of exacerbations of chronic obstructive pulmonary disease, a randomized placebocontrolled trial.
Am J Respir Crit Care Med 2012; 186: 48–55.
12 Brightling CE, Bleecker ER, Panettieri RA Jr, et al. Benralizumab for chronic obstructive pulmonary disease and sputum eosinophilia: a randomized, doubleblind, placebocontrolled phase 2a study.
Lancet Respir Med 2014; 2: 891–901.
13 Global Strategy for the Diagnosis, Management, and Prevention of COPD. Global Initiative for Chronic Obstructive Lung Disease (GOLD), 2017. http://goldcopd.org/gold2017globalstrategy diagnosismanagementpreventioncopd/ (accessed Nov 16, 2016). 14 Negewo NA, McDonald VM, Baines KJ, et al. Peripheral blood
eosinophils: a surrogate marker for airway eosinophilia in stable COPD. Int J Chron Obstruct Pulmon Dis 2016; 11: 1495–504. 15 Hastie AT, Moore WC, Li H, et al. Biomarker surrogates do not
accurately predict sputum eosinophil and neutrophil percentages in asthmatic subjects. J Allergy Clin Immunol 2013; 132: 72–80. 16 Mukherjee M, Nair P. Blood or sputum eosinophils to guide asthma
therapy? Lancet Respir Med 2015; 3: 824–25.
17 Ghebre MA, Bafadhel M, Desai D, et al. Biological clustering supports both “Dutch” and “British” hypotheses of asthma and chronic obstructive pulmonary disease. J Allergy Clin Immunol 2015; 135: 63–72.
18 Hurst JR, Vestbo J, Anzueto A, et al. Susceptibility to exacerbation in chronic obstructive pulmonary disease. N Engl J Med 2010; 363: 1128–38.
19 Siddiqui SH, Guasconi A, Vestbo J, et al. Blood eosinophils: a biomarker of response to extrafine beclomethasone/formoterol in chronic obstructive pulmonary disease. Am J Respir Crit Care Med 2015; 192: 523–25.
20 VedelKrogh S, Nielsen SF, Lange P, Vestbo J, Nordestgaard BG. Blood eosinophils and exacerbations in COPD: the Copenhagen general population study. Am J Respir Crit Care Med 2016; 193: 965–74. 21 Watz H, Tetzlaff K, Wouters EF, et al. Blood eosinophil count and
exacerbations in severe chronic obstructive pulmonary disease after withdrawal of inhaled corticosteroids: a posthoc analysis of the WISDOM trial. Lancet Respir Med 2016; 4: 390–98.
22 Couper D, LaVange LM, Han M, et al. Design of the Subpopulations and Intermediate Outcomes in COPD Study (SPIROMICS). Thorax 2014; 69: 491–94.
23 Hastie AT, Alexis NE, Doerschuk C, et al. Blood eosinophils poorly correlate with sputum eosinophils, and have few associations with spirometry, clinical and quantitated computed tomography measures compared to sputum eosinophils in the SPIROMICS cohort. Am J Respir Crit Care Med 2016; A6168 (abstr). 24 Sieren JP, Newell JD Jr, Barr RG, et al. SPIROMICS protocol for
multicenter quantitative computed tomography to phenotype the lungs. Am J Respir Crit Care Med 2016; 194: 794–806.
25 Boes JL, Hoff BA, Bule M, et al. Parametric response mapping monitors temporal changes on lung CT scans in the
Subpopulations and Intermediate Outcomes Measures in COPD Study (SPIROMICS). Acad Radiol 2015; 22: 186–94.
26 Ott RL, Longnecker MT. An introduction to statistical methods and data analysis, 7th edn. Boston: Brooks/Cole, 2015.
27 Carolan BJ, Sutherland ER. Clinical phenotypes of chronic obstructive pulmonary disease and asthma: recent advances.
J Allergy Clin Immunol 2013; 131: 627–34.
28 Postma DS, Rabe KF. The asthma–COPD overlap syndrome.
N Engl J Med 2015; 373: 1241–49.
29 Regan EA, Hokanson JE, Murphy JR, et al. Genetic epidemiology of COPD (COPDGene) study design. COPD 2010; 7: 32–43. 30 Pavord ID, Lettis S, Locantore N, et al. Blood eosinophils and
inhaled corticosteroid/longacting β2 agonist efficacy in COPD.
Thorax 2015; 71: 118–25.
31 Bafadhel M, Pavord ID, Russell REK. Eosinophils in COPD: just another biomarker? Lancet Respir Med 2017; 5: 747–59. 32 Dasgupta A, Kuarsgaard M, Capaldi D, et al. A pilot randomized
clinical trial of mepolizumab in COPD with eosinophilic bronchitis.
Eur Respir J 2017; 49: 1602486.
33 Pascoe S, Locantore N, Dransfield MT, Barnes NC, Pavord ID. Blood eosinophil counts, exacerbations, and response to the addition of inhaled fluticasone furoate to vilanterol in patients with chronic obstructive pulmonary disease: a secondary analysis of data from two parallel randomized controlled trials. Lancet Respir Med 2015; 3: 435–42.
34 Hospers JJ, Schouten JP, Weiss ST, Postma DS, Rijcken G. Eosinophilia is associated with increased allcause mortality after a followup of 30 years in a general population sample. Epidemiology 2000; 11: 261–68.
35 Tamada T, Sugiura H, Takahashi T, et al. Biomarkerbased detection of asthmaCOPD overlap syndrome in COPD populations.
Int J Chron Obstruct Pulmon Dis 2015; 10: 2169–76.
36 Woodruff PG, Barr RG, Bleecker ER, et al. Clinical significance of symptoms in smokers with preserved pulmonary function.
N Engl J Med 2016; 374: 1811–21.