Copyright © 2015 Vilnius Gediminas Technical University (VGTU) Press Technika http://www.bjrbe.vgtu.lt
doi:10.3846/bjrbe.2015.41 OF ROAD AND BRIDGE ENGINEERING ISSN 1822-427X / eISSN 1822-4288
2015 Volume 10(4): 325–332
1. Introduction
Over the past decade, the average farm size in the USA is increasing as the number of farms is decreasing. This trend has led to increased agricultural production per individual farm. To have higher efficiency in the farm industry, the farm equipment or agricultural vehicles is simultaneous-ly becoming larger to transfer more agricultural products from individual farms. This rapid shift in farm equipment size has raised concerns about their potential to cause sig-nificant damage to road infrastructure.
A limited number of studies (Fanous et al. 2000; Oman et al. 2001; Phares et al. 2005; Sebaaly et al. 2002) appear in the literature addressing the pavement damage issue caused by heavy farm equipment. However, the re-sults of these previous studies were inconclusive in dra-wing correspondence between farm equipment type and loading to specific pavement distresses. The latest repor-ted study conducrepor-ted in 2005 (Phares et al. 2005) recom-mended a comprehensive investigation, including a de-tailed field study, to better document the impact of farm
IMPACT OF FARM EQUIPMENT LOADING ON LOW-VOLUME CONCRETE
ROAD STRUCTURAL RESPONSE AND PERFORMANCE
Halil Ceylan1, Shiyun Wang2, Sunghwan Kim3 , Kasthurirangan Gopalakrishnan4, Lev Khazanovich5, Shongtao Dai6
1,4Dept of Civil, Construction & Environmental Engineering, Town Engineering Building, Iowa State University,
813 Bissell RD, Ames, IA 50011, USA
2Kleinfelder Inc., Interchange Business Park, 10835 E. Independence ST, Suite 102, Tulsa, OK 74116, USA 3Institute for Transportation, 24 Town Engineering Building, Iowa State University, 813 Bissell RD,
Ames, IA 50011, USA
5Dept of Civil, Environmental & Geo-Engineering, 160 CivE Building, University of Minnesota, 500 Pillsbury
Drive SE, Minneapolis, MN 55455, USA
6Minnesota Road Research Section, Minnesota Department of Transportation, 9011 77th Street NE, Monticello,
MN 55362, USA
E-mails: 1[email protected]; 2[email protected]; 3[email protected]; 4[email protected]; 5[email protected]; 6[email protected]
Abstract. The rapid increase in farm equipment size in the United States of America agricultural industry has raised significant concerns regarding its impact on the low-volume road infrastructure. The study described in this paper investigated the impact of heavy farm equipment (or agricultural vehicle) on the structural behaviour of rigid pave-ment system. A series of full-scale traffic tests were conducted at the Minnesota’s Cold Weather Pavepave-ment Testing Facility (more commonly known as MnROAD) on two existing low-volume rigid pavement sections: (1) to study the effects of agricultural vehicle and weights, traffic wander pattern, pavement structure, and environmental factors on rigid pavement responses (deflections, strains and stresses), and (2) to compare these responses with those of a standard 356 kN (80 kips) five-axle, semi-trailer truck for assessing relative rigid pavement damage caused by heavy farm equipment. Numerical analyses were also carried out for rigid pavement fatigue damage estimations by simulat-ing field test conditions. The Finite Element Model was able to predict rigid pavement responses under complicated heavy agricultural farm equipment loading. The study findings revealed that seasonal change, traffic wander, vehicle loading/configurations, pavement thickness, slab length and modulus of subgrade support are all important factors to be considered in designing rigid pavement subjected to heavy farm equipment loading. The use of tandem or tri-dem axles is recommended for all farm equipment because those axles help to distribute the load and minimize rigid pavement damage.
equipment on low-volume roads. Additionally, there was not enough information available to quantitatively estima-te the pavement damage caused by heavy farm equipment.
A pooled-fund study Effects of Implements of Husban-dry (Farm Equipment) on Pavement Performance (Lim et al.
2012) was initiated in early 2007 to gain a better understan-ding of the interaction of farm equipment with the pave-ment structures in the USA especially in the Midwest regi-on including Minnesota, Iowa, Illinois, and Wiscregi-onsin. The overall objectives of this pooled fund study were to deter-mine the pavement responses under various types of farm equipment and to compare these responses with a standard five-axle, semi-trailer truck. A wide range of vehicle types, axle load magnitudes, tire type, and vehicle wander pat-terns was used to determine the effect of farm equipment loading on pavement structures through a full-scale test program. A detailed description of this pooled-fund study is presented elsewhere (Lim et al. 2012).
The study reported in this paper, a subset of the po-oled-fund study, focused on investigation of the effects of heavy farm equipment loading on rigid pavement perfor-mance through both field work as well as numerical analy-sis. Note that the previous studies reported in the literature have mainly focused on flexible pavement in this regard. Two instrumented Portland cement concrete (PCC) pave-ment sections at the Minnesota’s Cold Weather Pavepave-ment Testing Facility (MnROAD) were utilized to determine pa-vement responses generated by various types of farm equi-pment including a grain cart (G), a Terragator (R), a straight truck (S), and a tanker (T). An additional standard semi-trailer truck (Mn80) was included in the test program to be used as a reference (control) vehicle for determination of re-lative damage caused by farm equipment. Pavement respon-se data collected were analyrespon-sed to identify the effects of ve-hicle types, veve-hicle weight, traffic wander pattern, pavement structure, and environmental factors on pavement respon-ses under heavy farm equipment loadings. The results of experimental and analytical work are discussed in this pa-per highlighting the significant impact of farm equipment or agricultural vehicles on rigid structures under different traffic loading and environmental conditions.
2. Overview of full-scale test program
2.1. Test sections
Two PCC pavement sections at the MnROAD test facility were utilized to determine pavement responses generated by
various types of agricultural vehicles and a typical five-axle semi-trailer truck. MnROAD is a full-scale accelerated pave-ment testing facility that gives researchers a unique, real-life laboratory to study and evaluate pavement performance (Snyder 2009). MnROAD is located along Interstate 94 (I-94) from about 64 km (40 miles) northwest of Minne-apolis/St. Paul. It contains more than 50 test cells on three different segments including a portion of I-94. The cells rep-resent a high traffic volume road and a low traffic volume road loop. Each testing cell is approximately 152 m (500 ft) long and varies from types of subgrade, aggregate base, and surface material to roadbed structure and drainage methods.
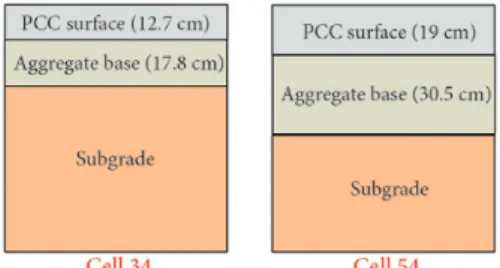
The rigid pavement sections used for testing were cell 32 and cell 54 of the low-volume loop at the MnRO-AD test facility. Cell 32, representing thin PCC pavements, consists of 12.7 cm (5 in) thick concrete slab over 17.8 cm (7 in) thick gravel base while cell 54 (representing thick PCC pavements) consists of 19 cm (7.5 in) thick concrete slab over 30.5 cm (12 in) thick gravel base (Fig. 1). It is arguable that these thicknesses are not represent the whole of USA, but only the Midwest region. Note that the focus of the study was on testing low-volume road pavements. The PCC slab panel lengths are 3 m (10 ft) for cell 32 and 4.6 m (15 ft) for cell 54. The PCC slab panel width of both cells is 3.6 m (12 ft). Cell 32 does not have dowel bars, but cell 54 has 2.54 cm (1 in) do-wel bars in the transverse joints. Granular shoulders were adjacent to both lanes of cell 32 and cell 54. Both cells have strain gages instrumented at various locations to measure strain responses under loads. Cell 54 also has linear variable differential transformers (LVDTs) at the edge of the concrete slabs to measure vertical deflection responses.
Data acquisition was accomplished with various ty-pes of electronic data collection equipment at MnROAD. All sensors embedded into each test cell were wired into the data acquisition system. The MnROAD data acqui-sition system was set up in such a way that it begins to record response measurements when a test vehicle appro-aches a testing cell and passes a trigger. These systems col-lected response measurements at a rate of 1200 data points per second (1200 Hz) and each vehicle pass typically has a collection time of 15 s to 18 s. Approx 18 000 to 22 000 data points per sensor were recorded under one vehicle run. Lim et al. (2012) provided a more detailed descrip-tion of the instrumentadescrip-tion and data acquisidescrip-tion system in both cells.
2.2. Test vehicles
A total of seven field test runs with various types of test vehicles were conducted from 2008 to 2010. Two rounds of testing in each year were conducted, one during spring when pavement experiences freeze-thaw environments and another during fall when agricultural vehicles operate at a higher frequency. For each round of testing, a test pro-gram was developed to include a range of vehicle load levels (weights), target wheel path (wander distance) and redun-dancy of vehicle passes in order to obtain a more complete and repeatable data set. However, the number of vehicle passes was governed by time and manpower constraints.
A total of twelve agricultural vehicles were tested throughout the duration of project. Each agricultural ve-hicle had 0% (empty), 50% (half-loaded), 80% or 100% (fully-loaded) loading during testing. In addition, a stan-dard semi-trailer truck was included in the test program to be used as the reference (control) vehicle. This semi-trailer had a gross vehicle weight of 356 kN (80 kips) and labelled as “Mn80”. Again, detailed descriptions of all test vehicles are provided by Lim et al. (2012).
The test vehicles were categorized into five groups: a grain cart, a Terragator, a straight truck, a tanker and a standard semi-trailer truck. The heaviest vehicle in each group was utilized as the representative vehicle for the analysis in this paper. Table 1 lists the total vehicle weights along with axle loads for five representative vehicles label-led as G1 representing the grain cart, R6 – the Terragator, S5 – the straight truck, T6 – the tanker, and Mn80 – the standard semi-trailer truck. The dimensions of these ve-hicles are presented in Fig. 2.
2.3. Traffic wander characterization
An exact account of the traffic wander was required since the lateral movement of the passing vehicle tires dictates where the loads were placed (Buiter et al. 1989; Willis, Timm 2008). The test vehicles were directed to travel at 0 cm (0 in), 30.5 cm (12 in) and 61 cm (24 in) of traffic wander distance defined as the distance from the pavement edge to outside wheel edge. The actual traffic wander distance were some different from the target distance. To provide the necessary precision for interpreting the data, the actual vehicle wander posi-tions were measured. Length scales were installed to help the vehicle drivers properly align the vehicle tires on the desired distance. Video cameras were placed at each test section to record the vehicles’ actual position at the time each vehicle passing the scale. Videos were reviewed afterward and the exact traffic wander posi-tion of each vehicle pass was determined.
For consistency in analysis of sensor data, traffic wander pattern was also characterized in terms of relative
offset to sensor defined as the distance from the centre of the rear wheel to the sensor location. Since the sensor location is known, relative offset for a specific vehicle run for a specific sensor is calculated as: (traffic wander dis-tance) – (sensor location) + (one-half the tire width). A positive value of relative offset means that the wheel was driven toward the centreline of the pavement while a ne-gative value of relative offset means that the wheel was driven toward the pavement shoulder. Fig. 3 illustrates how vehicle traffic wander patterns were characterized in terms of traffic wander distances.
Table 1. Five representative test vehicles analysed
Vehicle ID G1 R6 T6 S5 Mn80
Testing Round Fall 2010 Spring 2010 Fall 2010 Spring 2009 All
Type/Volume Grain cart/1000 bushels Terragator/4200 gal Tanker/6000 gal Straight Truck/4400 gal Standard Semi-trailer Truck
Number of total
axles/rear axles 3/1 2/1 4/2 3/2 5/2
Load level 0% 100% 50% 100% 0% 100% 50% 80% 356 kN
Axle 1 weight, t 5 5 13 15 5 5 6 7 5
Axle 2 weight, t 7 9 13 19 8 10 6 9 8
Axle 3 weight, t 5 26 3 11 7 9 8
Axle 4 weight, t 4 14 7
Axle 5 weight, t 8
Total weight, t 17 40 26 34 20 40 19 25 36
Fig. 2. Dimensions for test vehicles (dimension unit – cm; not to scale)
2.4. Data mining: Peak-Pick analysis
Large amount of data points were collected from all in-stalled sensors when one vehicle passed. A data mining process was necessary to extract the desired responses from properly functioning sensors. To achieve this, a Peak-Pick program developed for Minnesota Department of Trans-portation (MnDOT) by the University of Minnesota re-searchers was employed. Peak-Pick analysis was performed on data collected from all sensors with two available analy-sis modes (automatic and manual Peak-Pick mode). In au-tomatic mode, Peak-Pick auau-tomatically locates peaks and troughs (maximum and minimum) values from the time-history response measurements of properly functioning sensors. However, there were some occasions when Peak-Pick automatic mode did not detect the peaks and troughs. The sensor measurements that were not analysed by Peak-Pick in automatic mode were reviewed under the nual mode. In the manual mode, the Peak-Pick user ma-nually picks the peaks of the time-history response measu-rements. Improperly functioning sensors were determined when no trace of the response was found or the response was too noisy. The response measurements from improperly functioning sensors were excluded from the data analysis. A
Microsoft Excel’s Visual Basicfor Application (Excel Macro) was also employed to automatically summarize Peak-Pick analysis results. Further elaboration of the information rela-ted to the Peak-Pick program it is possible to find in MnRO-AD Offline Data Peak-Picking Program User Guide of 2007. 3. Pavement distress monitoring
After each round of testing, manual distress surveys were conducted. The first observed distress was the corner break in cell 32 (12.7 cm or 5 in PCC slab) during the fall 2009 field testing cycle. This corner crack was aggravated during
the spring 2010 test cycle as shown in Fig. 4a. Additional new corner cracks (Fig. 4b) were observed in cell 32 during spring 2010. These corner cracks were due to the bending of the concrete slab and lack of the subgrade support as well as the heavy loading of test vehicles. Water was also responsible for all those corner breaks because pumping occurred while test vehicle were traveling through those pavement joints. As the vehicle approached the joint, the tire pushed the con-crete slab downward. Water accumulating underneath the concrete pavement slab was then extruded upward. The ex-truded water brought fine soil particles with them and there-fore left a hollow space underneath the concrete slab.
In addition to previously observed corner cracks, lon-gitudinal cracking (Fig. 4c) was observed on a slab nearby cell 32 after fall 2010 field testing cycle. The investigation using finite element analysis indicated that the upward slab curling from the built-in temperature gradient increa-sed the bending stress on top of the slab (Wang et al. 2011). The increase in the bending stress on top of the slab has led to these surface cracks. No significant distress was obser-ved in cell 54 representing thick PCC pavements (19 cm or 7.5 in PCC slab) in this study.
4. Analysis of field testing data
An evaluation of relative pavement damage induced by five representative test vehicles was conducted by comparing measured critical pavement responses (strain and deflection) generated by these vehicles. The analysis results presented in this paper were based on a comparison of measured respons-es near mid-slab edge which are recognized as critical loca-tion for fatigue damage on rigid pavements. Other factors affecting pavement responses are also discussed.
4.1. Effect of seasonal variation and traffic wander Test vehicles were selected based on availability, applica-tion frequency, and recommendaapplica-tions by the farm equip-ment industry. Ideally, each test vehicle has been tested at the same time. However, due to availability constraints, this was not fulfilled. Mn80 was used as the control vehi-cle during all testing rounds. Therefore, Mn80’s pavement responses were used as the reference measurements to evaluate the effects of seasonal condition on pavement re-sponses. Seasonal conditions incorporated in test program include spring weather condition when pavement experi-ences freeze-thaw environments and fall weather condition when agricultural vehicles operate at a higher frequency.
Fig. 5 presents the comparisons of the tensile strain responses at the bottom of the PCC slab near mid-slab edge
Fig. 4. Pavement distress observed nearby cell 32
produced by Mn80 during spring 2009, fall 2009, spring 2010 and fall 2010, respectively. In these comparisons, strain responses produced by Mn80 during spring 2009 are sligh-tly lower than those produced during other seasons. Strain responses produced by Mn80 during fall 2010 are slight-ly higher than those produced in the other seasons. It has been recognized that frozen base and subgrade layers have higher stiffness and thawing base and subgrade layers have lower stiffness (Christopher et al. 2006; Dempsey, Thomp-son 1973; Janoo, Berg 1990, 1998). Although the spring test programs designed in this study were expected to represent weakest state experiencing freeze-thaw cycle, the base and subgrade layers were still experiencing freezing at the time of field testing due to prolonged harsh winter conditions. Therefore, strain responses observed during spring test pro-gram did not exhibit higher measurements. However, the results still demonstrated that the seasonal conditions have an effect on the pavement responses.
The pavement strain responses produced by Mn80 de-creased when traffic wander distances inde-creased up to about 51 cm (20 in). As the traffic wander distances exceeded 51 cm (20 in), strain produced during all seasons became identical. This result demonstrated that traffic wander have a pronounced effect on the pavement responses. Rigid pave-ment damage was reduced to minimal if the vehicle was dri-ven 0.5 m (1.5 ft) to 0.6 m (2.0 ft) away from PCC slab edge.
4.2. Effect of vehicle type and weight
Fig. 6 compares tensile strain responses from farm equip-ment tested in this study at different load levels to the refer-ence Mn80 under same test (seasonal) periods. As a general trend, an increase in vehicle weight leads to an increase in pavement responses. However, the magnitude of increase in the maximum tensile strain is not proportional to the in-crease in the load level. This is attributed to the complexity of the agricultural vehicle’s configuration. Another factor re-lated to this trend is that the increase in gross vehicle weight is not proportional to the increase in each axle weight (Table 1). G1 with 100% loading produced the highest tensile strain responses among all five vehicles. This is attributed to higher rear axle weight of G1 than the other vehicles when G1 is fully loaded. R1 with 100% loading produced slightly higher tensile strain responses than Mn80. Howe-ver, T6 with 100% loading and S5 with 80% loading did not produce higher tensile strain responses than Mn80. Agricultural vehicles tested in this study produced lower tensile strain responses than Mn80 when they were emp-ty (G1 and T6) or partially loaded (R6 and S5). Similar to Mn80 vehicle traffic wander effect, rigid pavement da-mage was reduced to minimal even when agricultural ve-hicles were fully loaded if these veve-hicles were driven 0.5 m (1.5 ft) to 0.6 m (2.0 ft) away from PCC slab edge.
Fig. 7 compares vertical deflection responses from G1 and T6 at fully-loaded and empty conditions to Mn80
Fig. 6. Effect of vehicle type and weight on tensile strains at the bottom of the PCC slab near mid-slab edge
under same test (seasonal) periods. Similar to findings from previous comparisons, G1 with 100% loading produ-ced higher vertical deflections and both empty agricultural vehicles produced lower vertical deflections than Mn80. However, T1 with 100% loading produced higher vertical deflections than Mn80.
4.3. Effect of tire type
The use of flotation tires in agricultural vehicle are becom-ing increasbecom-ingly popular due to its wider footprint and lower inflation pressure which allows the vehicle to travel over soil and unbound aggregate material with minimal compaction and deformation (Lim et al. 2012). An issue arose as to whether this characteristic was translated di-rectly to rigid pavement performance.
Two similar straight trucks with the same tank capa-city of 4400 gallons were fitted with two different tire types. S5 was with flotation tires and S4 was fitted with regular radial ply dual tire configuration. Fig. 8 compares the axle weight and the tensile strain responses produced by both straight trucks at 50% and 80% loading. The S5 with flo-tation tires produced slightly lower axle weight and tensile strain responses than S4 with radial tires. However, these lower measurements from S5 with flotation tire did not provide significant benefits to rigid pavement performance. 4.4. Effect of PCC pavement structure
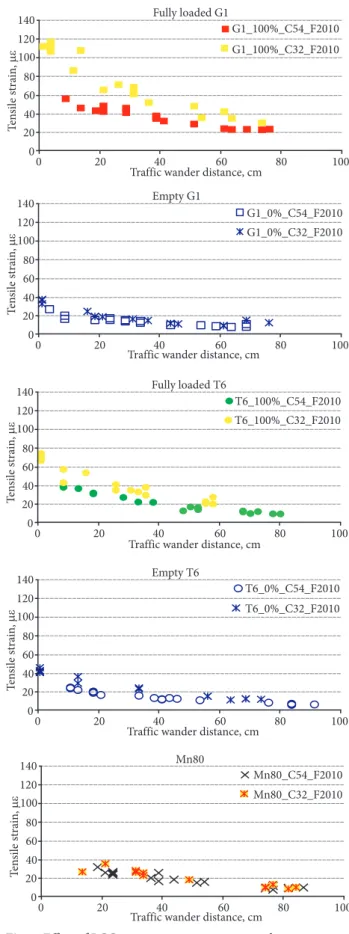
As stated previously, two rigid pavement sections were uti-lized to evaluate the effect of PCC pavement thicknesses on pavement responses. The tensile strain responses for G1 and T6 at fully-loaded (100%) and empty (0%) conditions were compared between cell 32 (thin section) and cell 54 (thick section) along with the responses from Mn80. Fig. 9 presents these comparisons. The thicker PCC slab thick-ness (cell 54) resulted in lower tensile strains than the thinner PCC slab thickness (cell 32) when both G1 and T6 were fully loaded. However, less significant reduction in
tensile strain responses were observed for cell 54 in com-parison to the cell 32 when both G1 and T6 were empty and Mn80 travelled.
Fig. 8. Effect of tire type on tensile strains at the bottom of the PCC slab near mid-slab edge (S5 is fitted with flotation
5. Numerical simulation for fatigue damage characterization
Although the full-scale testing provided a wealth of in-formation on pavement responses produced by each farm equipment in comparison to Mn80, all agricultural vehicles were not tested under exactly similar conditions due to test vehicle availability constraints. To address this limitation, numerical simulations using Finite Element Model (FEM) was conducted to estimate rigid pavement fatigue damage resulting from agricultural vehicles. Many fatigue models for concrete pavement have been developed using field and laboratory data. Most of these models relate the stress ratio, the ratio of the tensile stress to the PCC modulus of rupture (MOR), to estimate the number of loads until failure for fatigue damage estimations. For consistency in evaluation, this study utilized the stress ratio as an evalua-tion index for fatigue damage characterizaevalua-tion. It is specu-lated that fatigue damage is expected to occur to the PCC slab if the stress ratio is over 0.5 in accordance to Pavement Analysis and Design of 1993 by Yang H. Huang.
An ISLAB2005 was utilized to estimate the critical pa-vement stress produced by full loaded agricultural vehicles (G1, R6, T6, and S5) and Mn80 on cell 32 (thin PCC section) and cell 54 (thick PCC section). The ISLAB2005 is a FE ba-sed structural analysis program specially developed for rigid pavement analysis by Applied Research Associates, Inc. in the United States of America. It has been utilized by many pre-vious studies (Hansen et al. 2002, 2006; Heath et al. 2003; Jeong, Zollinger 2005; Kim et al. 2011; 2014) to investigate rigid pavement behaviours under various load conditions.
The ISLAB2005 allows the user to manually define ri-gid pavement layer properties, vehicle loading with wheel configuration, and the number of the nodes. A set of requi-red inputs was preparequi-red from field testing program and sen-sitivity analysis results. Detailed description of input prepa-ration for the ISLAB2005 is available in Wang (2011). The PCC MOR estimated from compressive strength and elastic modulus was 4826 kPa (700 psi) based on the PCC strength and stiffness correlation specified in the AASHTO Mecha-nistic-Empirical Pavement Design Guide (MEPDG) of 2008.
Fig. 10 presents the stress ratio comparisons for fully-loaded agricultural vehicles and Mn80 on cell 32 and cell 54. All fully-loaded agricultural vehicles exhibi-ted higher stress ratios than standard semi-trailer truck on both cell 32 and cell 54. Since higher stress ratio indi-cates higher fatigue damage potential, G1 has the highest fatigue damage potential, followed by R6, T6, and S1. All examined test vehicles have higher potential to induce fati-gue failure in thinner PCC section (cell 32) than in thicker PCC section (cell 54).
6. Summary and conclusions
A full-scale traffic test program was conducted under a pooled-fund study to investigate the effects of farm (ag-ricultural) vehicles on rigid pavement performance. Key observations from this study are as follows:
1. The field experiment demonstrated that the pa-vement structural characteristics, axle weights, seasonal effects, traffic wander, and vehicle type/configuration have a pronounced effect on the rigid pavement responses.
2. In comparison to the standard 356 kN (80 kips) five-axle semi-trailer truck (Mn80), higher levels of ten-sile strains at the bottom of the Portland cement concrete slab near mid-slab edge were caused by a fully-loaded 1000 bushel grain cart and a fully loaded 4200 gallon Terragator. However, fatigue damage estimations through numerical simulations indicate that a fully loaded tanker and a fully loaded straight truck also have higher potential to induce fatigue damage rather than the standard 356 kN (80 kips) five-axle semi-trailer truck (Mn80).
3. Several corner breaks were observed in the 12.7 cm (5.0 in) thick Portland cement concrete pavement section (cell 32) which were further aggravated by increased traf-fic loading causing pumping and loss of subgrade support. However, no significant distress was observed in the 19 cm (7.5 in) thick Portland cement concrete pavement section (cell 54) which is relatively thicker than cell 32.
4. The thicker Portland cement concrete slab (cell 54) resulted in lower tensile strains than the thinner Portland cement concrete slab (cell 32) when the grain cart was fully loaded. However, less significant reduction in tensile strains was observed in cell 54 compared to cell 32 when grain cart was empty.
5. Straight truck with flotation tires produced slightly lower axle weight and tensile responses than the one with radial tires. However, these lower measurements from straight truck with flotation tires did not provide signifi-cant benefits in terms of rigid pavement performance.
6. Analysis of measured and simulated pavement res-ponses demonstrated that pavement damage was reduced to minimal even when farm equipment was fully loaded if the vehicle is driven 0.5 m (1.5 ft) to 0.6 m (2.0 ft) away from the edge of the Portland cement concrete slab.
7. The field experiment confirmed that pavement responses are governed mainly by axle weight, not gross vehicle weight. Hence, increasing the number of axles is beneficial, although it is important to ensure even load dis-tribution among axles.
References
Buiter, R.; Cortenraad, W. M. H.; Van Eck, A. C.; Van Rij, H. 1989. Effects of Transverse Distribution of Heavy Vehicles on Thickness Design of Full-Depth Asphalt Pavements, Trans-portation Research Record 1227: 66–74.
Christopher, B. R.; Schwartz, C.; Boudreau, R. 2006. Geotechnical Aspects of Pavements, FHWA Report No. NHI–05–037. Wash-ington, D. C.: National Highway Institute, Federal Highway Administration, U.S. Dept of Transportation. 888 p.
Dempsey, B. J.; Thompson, M. R. 1973. Vacuum Saturation Method for Predicting Freeze-Thaw Durability of Stabilized Materials, Highway Research Record 442: 44–57.
Fanous, F.; Coree, B. J.; Wood. D.2000. Response of Iowa Pave-ments to a Tracked Agricultural Vehicle. Final Report for Iowa DOT Project No. HR-1075. Ames, IA: Center for Transpor-tation Research and Education, Iowa State University. 16 p. Hansen, W.; Smiley, D. L.; Peng, Y.; Jensen, E. A. 2002.
Validat-ing Top-Down Premature Transverse Slab CrackValidat-ing in Joint-ed Plain Concrete Pavement, Transportation Research Record
1809: 52–59. http://dx.doi.org/10.3141/1809-06
Hansen, W.; Wei, Y.; Smiley, D. L.; Peng, Y.; Jensen, E. A. 2006. Ef-fects of Paving Conditions on Built-in Curling and Pavement Performance, International Journal of Pavement Engineering
7(4): 291–296. http://dx.doi.org/10.1080/10298430600798952
Heath, A. C.; Roesler, J. R.; Harvey, J. T. 2003. Modeling Longi-tudinal, Corner and Transverse Cracking in Jointed Concrete Pavements, International Journal of Pavement Engineering 4(1): 51–58. http://dx.doi.org/10.1080/102984303100016073393
Janoo, V. C.; Berg, R. L. 1990. Thaw Weakening of Pavement Structures in Seasonal Frost Areas, Transportation Research Record 1286: 217–233.
Janoo, V. C.; Berg, R. L. 1998. PCC Airfield Pavement Response during Thaw-Weakening Periods, Journal of Cold Regions En-gineering 12(3): 138–151.
http://dx.doi.org/10.1061/(ASCE)0887-381X(1998)12:3(138)
Jeong, J. H.; Zollinger, D. G. 2005. Environmental Effects on the Behavior of Jointed Plain Concrete, Journal of Transportation Engineering 131(2): 140–148.
http://dx.doi.org/10.1061/(ASCE)0733-947X(2005)131:2(140)
Kim, S.; Ceylan, H.; Gopalakrishnan, K. 2014. Finite Element Modelling of Environmental Effects on Rigid Pavement
De-formation, Frontiers of Structural and Civil Engineering Jour-nal 8 (2): 101–114.
http://dx.doi.org/10.1007/s11709-014-0254-x
Kim, S.; Gopalakrishnan, K.; Ceylan, H. 2011. A Simplified Ap-proach for Predicting Early-Age Concrete Pavement Defor-mation, Journal of Civil Engineering and Management 17 (1): 27–35. http://dx.doi.org/10.3846/13923730.2011.554003
Lim, J.; Azary, A; Khazanovich, L.; Wang, S.; Kim, S.; Ceylan, H.; Gopalakrishnan, K . 2012. Effects of Implements of Husbandry (Farm Equipment) on Pavement Performance. Final Report No. MN/RC 2012-08. Minneapolis, MN: Dept of Civil Engi-neering, University of Minnesota. 551 p.
Oman, M.; Deusen, D. V.; Olson. R.2001. Scoping Study: Impact of Agricultural Equipment on Minnesota’s Low Volume Roads. Final Report. Maplewood, MN: Office of Materials and Road Research, Minnesota Dept of Transportation. 42 P.
Phares, B. W.; Wipf, T.; Ceylan, H. 2005. Impacts of Overweight Implements of Husbandry on Minnesota Roads and Bridges.
Synthesis Report No. MN/RC – 2005-05. Ames, IA: Center for Transportation Research and Education, Iowa State Uni-versity. 10 p.
Sebaaly, P.; Siddharthan, R.; El-Desouky, M.; Strand, D.; Huft, D. 2003. Effect of Off-Road Equipment on Flexible Pavements,
Transportation Research Record 1821: 29–38.
http://dx.doi.org/10.3141/1821-04
Snyder, M. B. 2009. Lessons Learned from MnROAD (1992– 2007): Whitetopping Design, Construction, Performance and Rehabilitation, in Transportation Research Board 88th Annual
Meeting Compendium of Papers DVD. 11−15 January 2009, Washington, D.C. 20 p.
Wang, S. 2011. The Effects of Implements of Husbandry Farm Equip-ment on Rigid PaveEquip-ment Performance. PhD thesis. Ames, IA: Dept of Civil Engineering, Iowa State University. 354 p. Willis, J. R.; Timm, D. H. 2008. Repeatability of Asphalt Strain
Measurements under Full-Scale Dynamic Loading, Transpor-tation Research Record 2087: 40–48.
http://dx.doi.org/10.3141/2087-05